
The Analysis
During 2025, Sherlock Company conducted a benchmarking study of Third-Party Administrators. The combined membership served by these five organizations was 1.1 million members, and the membership included Medical and Dental. The data surveyed was 2024 calendar year results.
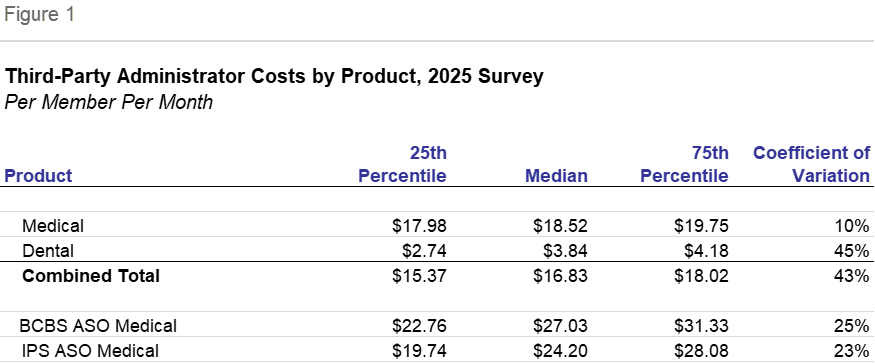
These administrators are considerably lower cost than health insurers in more or less comparable products. Median medical product costs were $18.52 PMPM versus $27.03 for Blue Cross Blue Shield ASO/ASC arrangements, and $24.20 for Independent/Provider-Sponsored ASO products. Interestingly, several of the TPAs included in this study are sister organizations to health insurers included in other Sherlock Benchmarks universes.
Part of this is structural, stemming from the markets served by TPAs. For instance, unlike insurers, TPAs do not serve individual members and the overall infrastructure reflects this. As a result, Sales and Marketing expenses were far lower.
The execution of Account Membership and Administration activities is key to understanding differences in cost. This cluster accounts for the bulk of core expenses across all three groups. Blue Plan median costs were 53.8% higher than the TPA median, while IPS median costs were 27.5% above TPA levels. Within this cluster, the most significant component is Information Systems Expenses. Blue Plan median IS costs were 161.0% above TPA levels, while IPS median IS costs were 136.9% higher than TPA. This suggests that both Blues and IPS plans operate with heavier technology infrastructure than TPAs.
If you are interested in licensing these materials or are interested in participating in our upcoming survey, we hope you will not hesitate to contact us. Much more information on health plan costs and operational drivers is available by licensing the Sherlock Benchmarks. Tables of Contents, report formats, citations, quality assurance and other information can be found here.