
The Analysis
While financial benchmarks can identify functions with cost variances, understanding what drives those differences requires looking at operational data. This analysis looks at the operational factors behind cost differences across health plans, using data from the 2025 Sherlock Benchmarks.
The patterns are intuitive but worth quantifying: inquiry volume correlates with costs in both Provider Relations and Member Services. Claims automation correlates with lower costs in Claims. The strength of these relationships suggests that plans focused on cost management should look at what's generating volume, not just how efficiently they're handling it.
Provider Relations Services
More inquiries, higher costs. Provider Relations is the health plan's initial point of contact for providers. Inquiries include telephone calls, written correspondence, and electronic submissions.
Figure 1 shows the relationship between total provider inquiries per year and Provider Relations Services costs PMPM. The relationship is statistically significant (P=0.007, R²=36%). Plans with more provider inquiries have higher costs in this function.
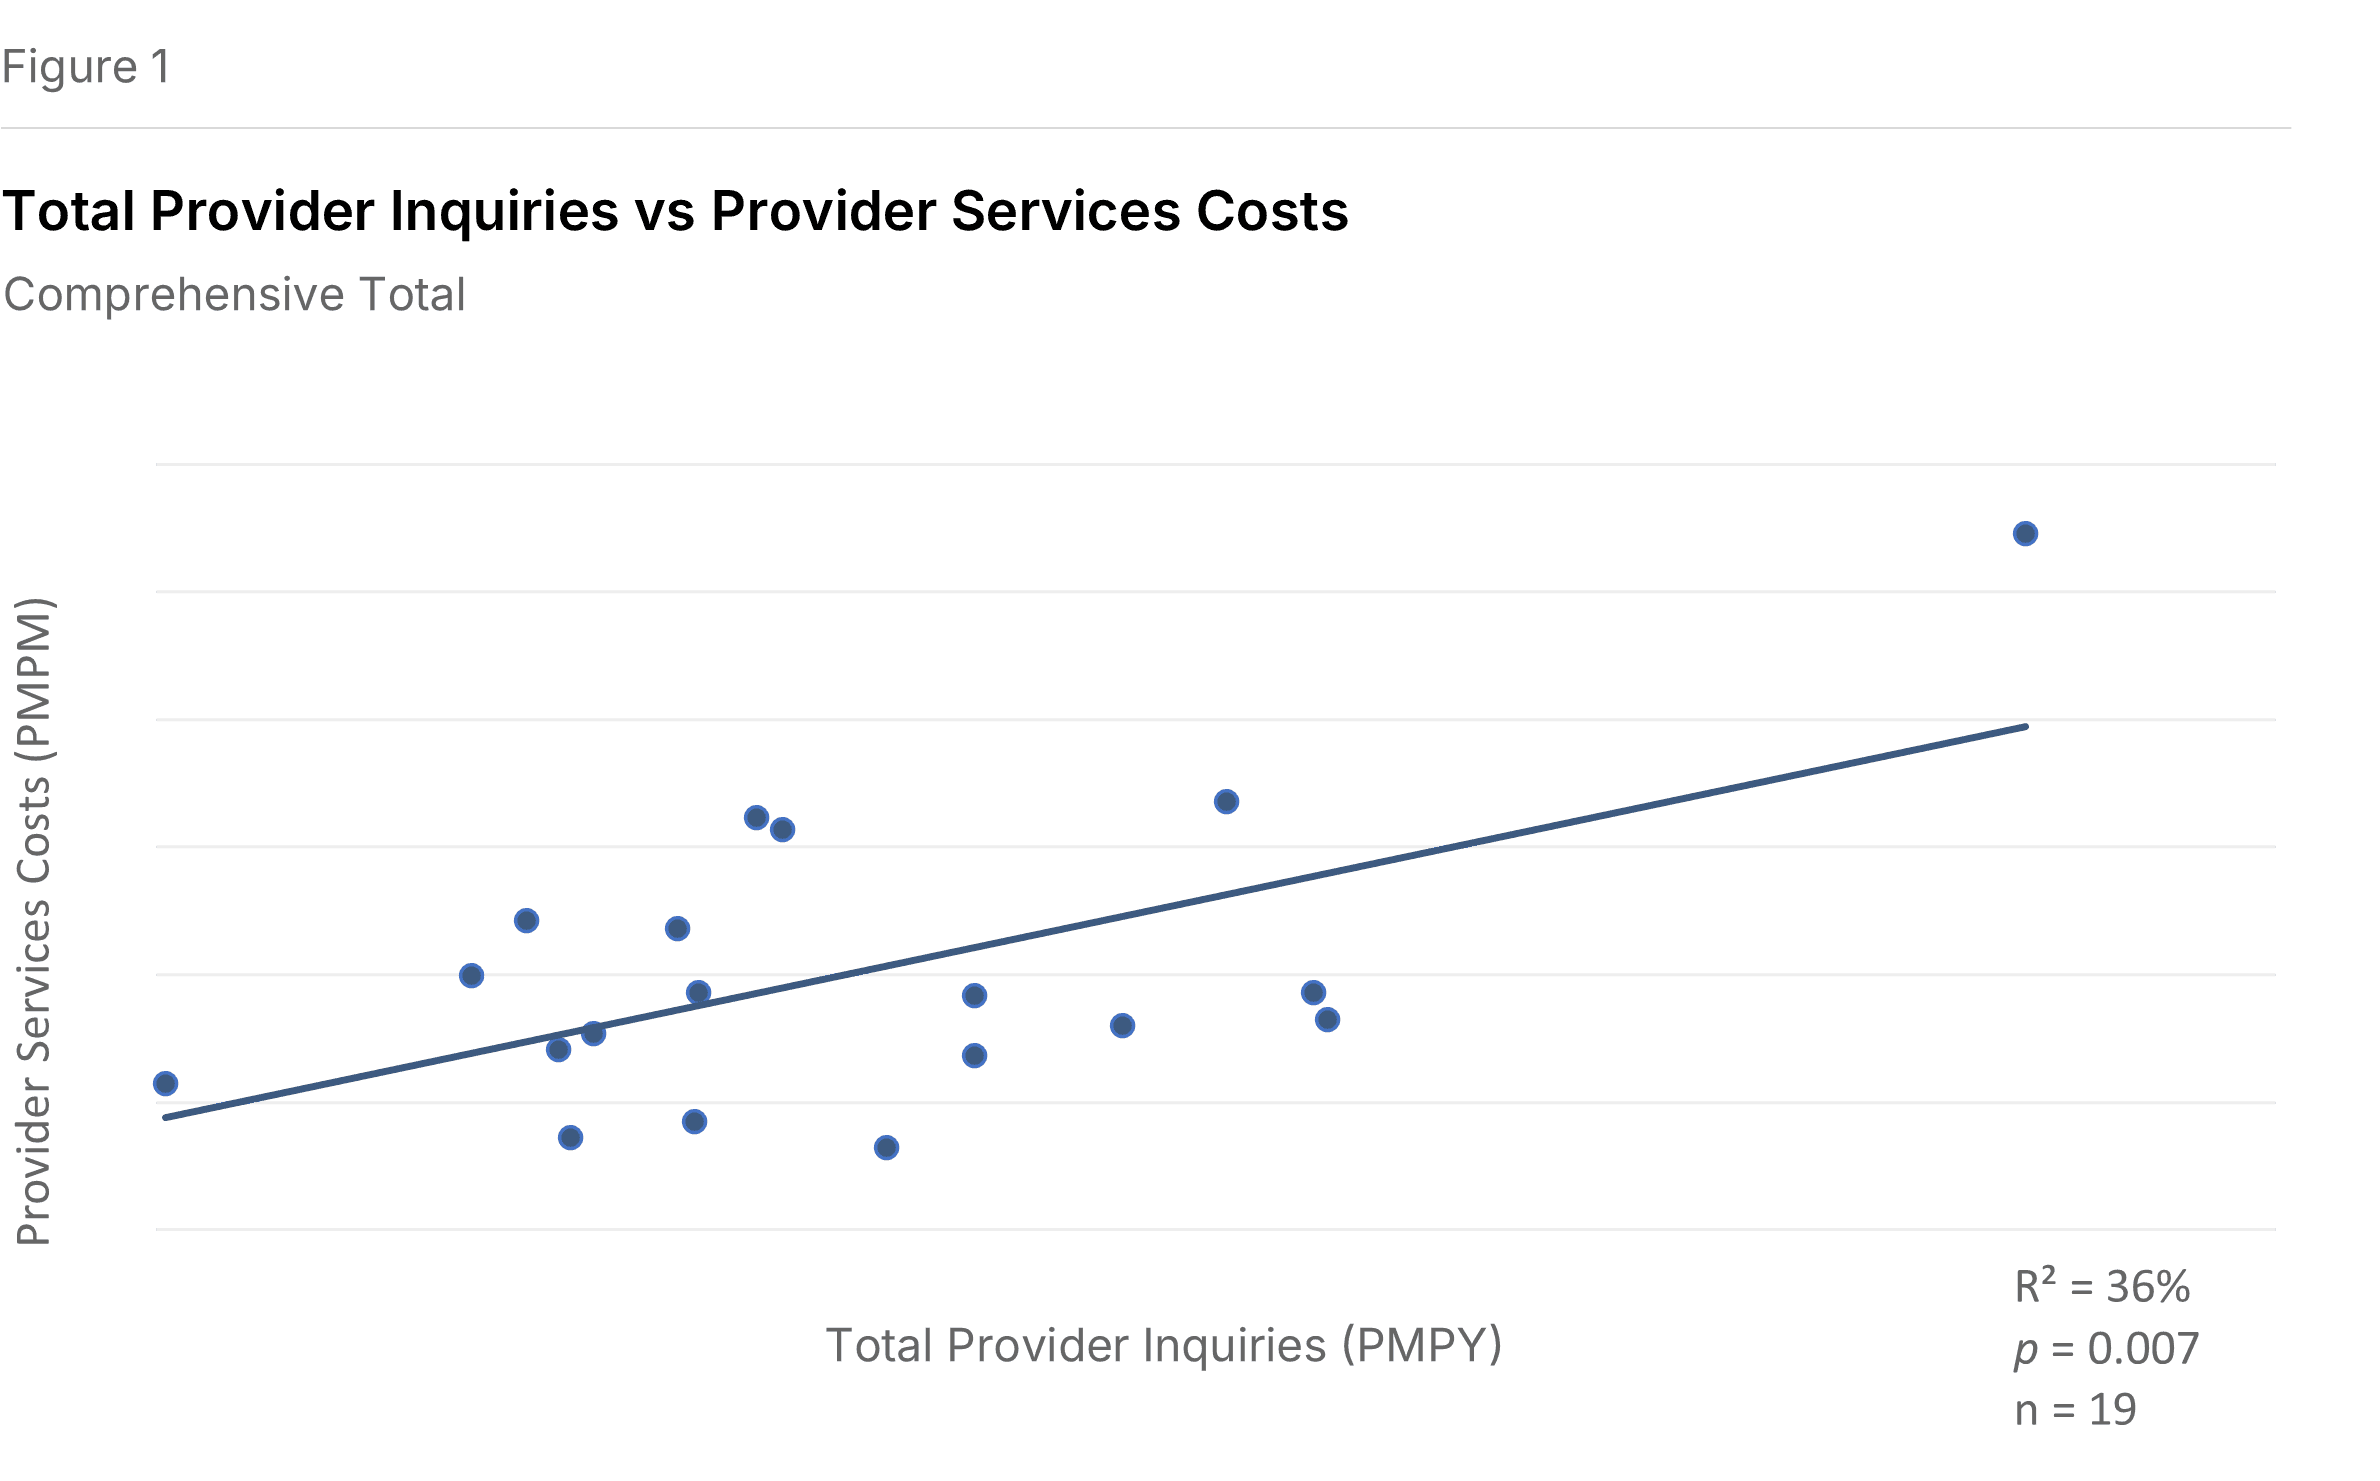
The R² tells us that inquiry volume explains about a third of the cost variation. Other factors matter too—call duration, compensation levels, staffing models—but volume is clearly a meaningful driver.
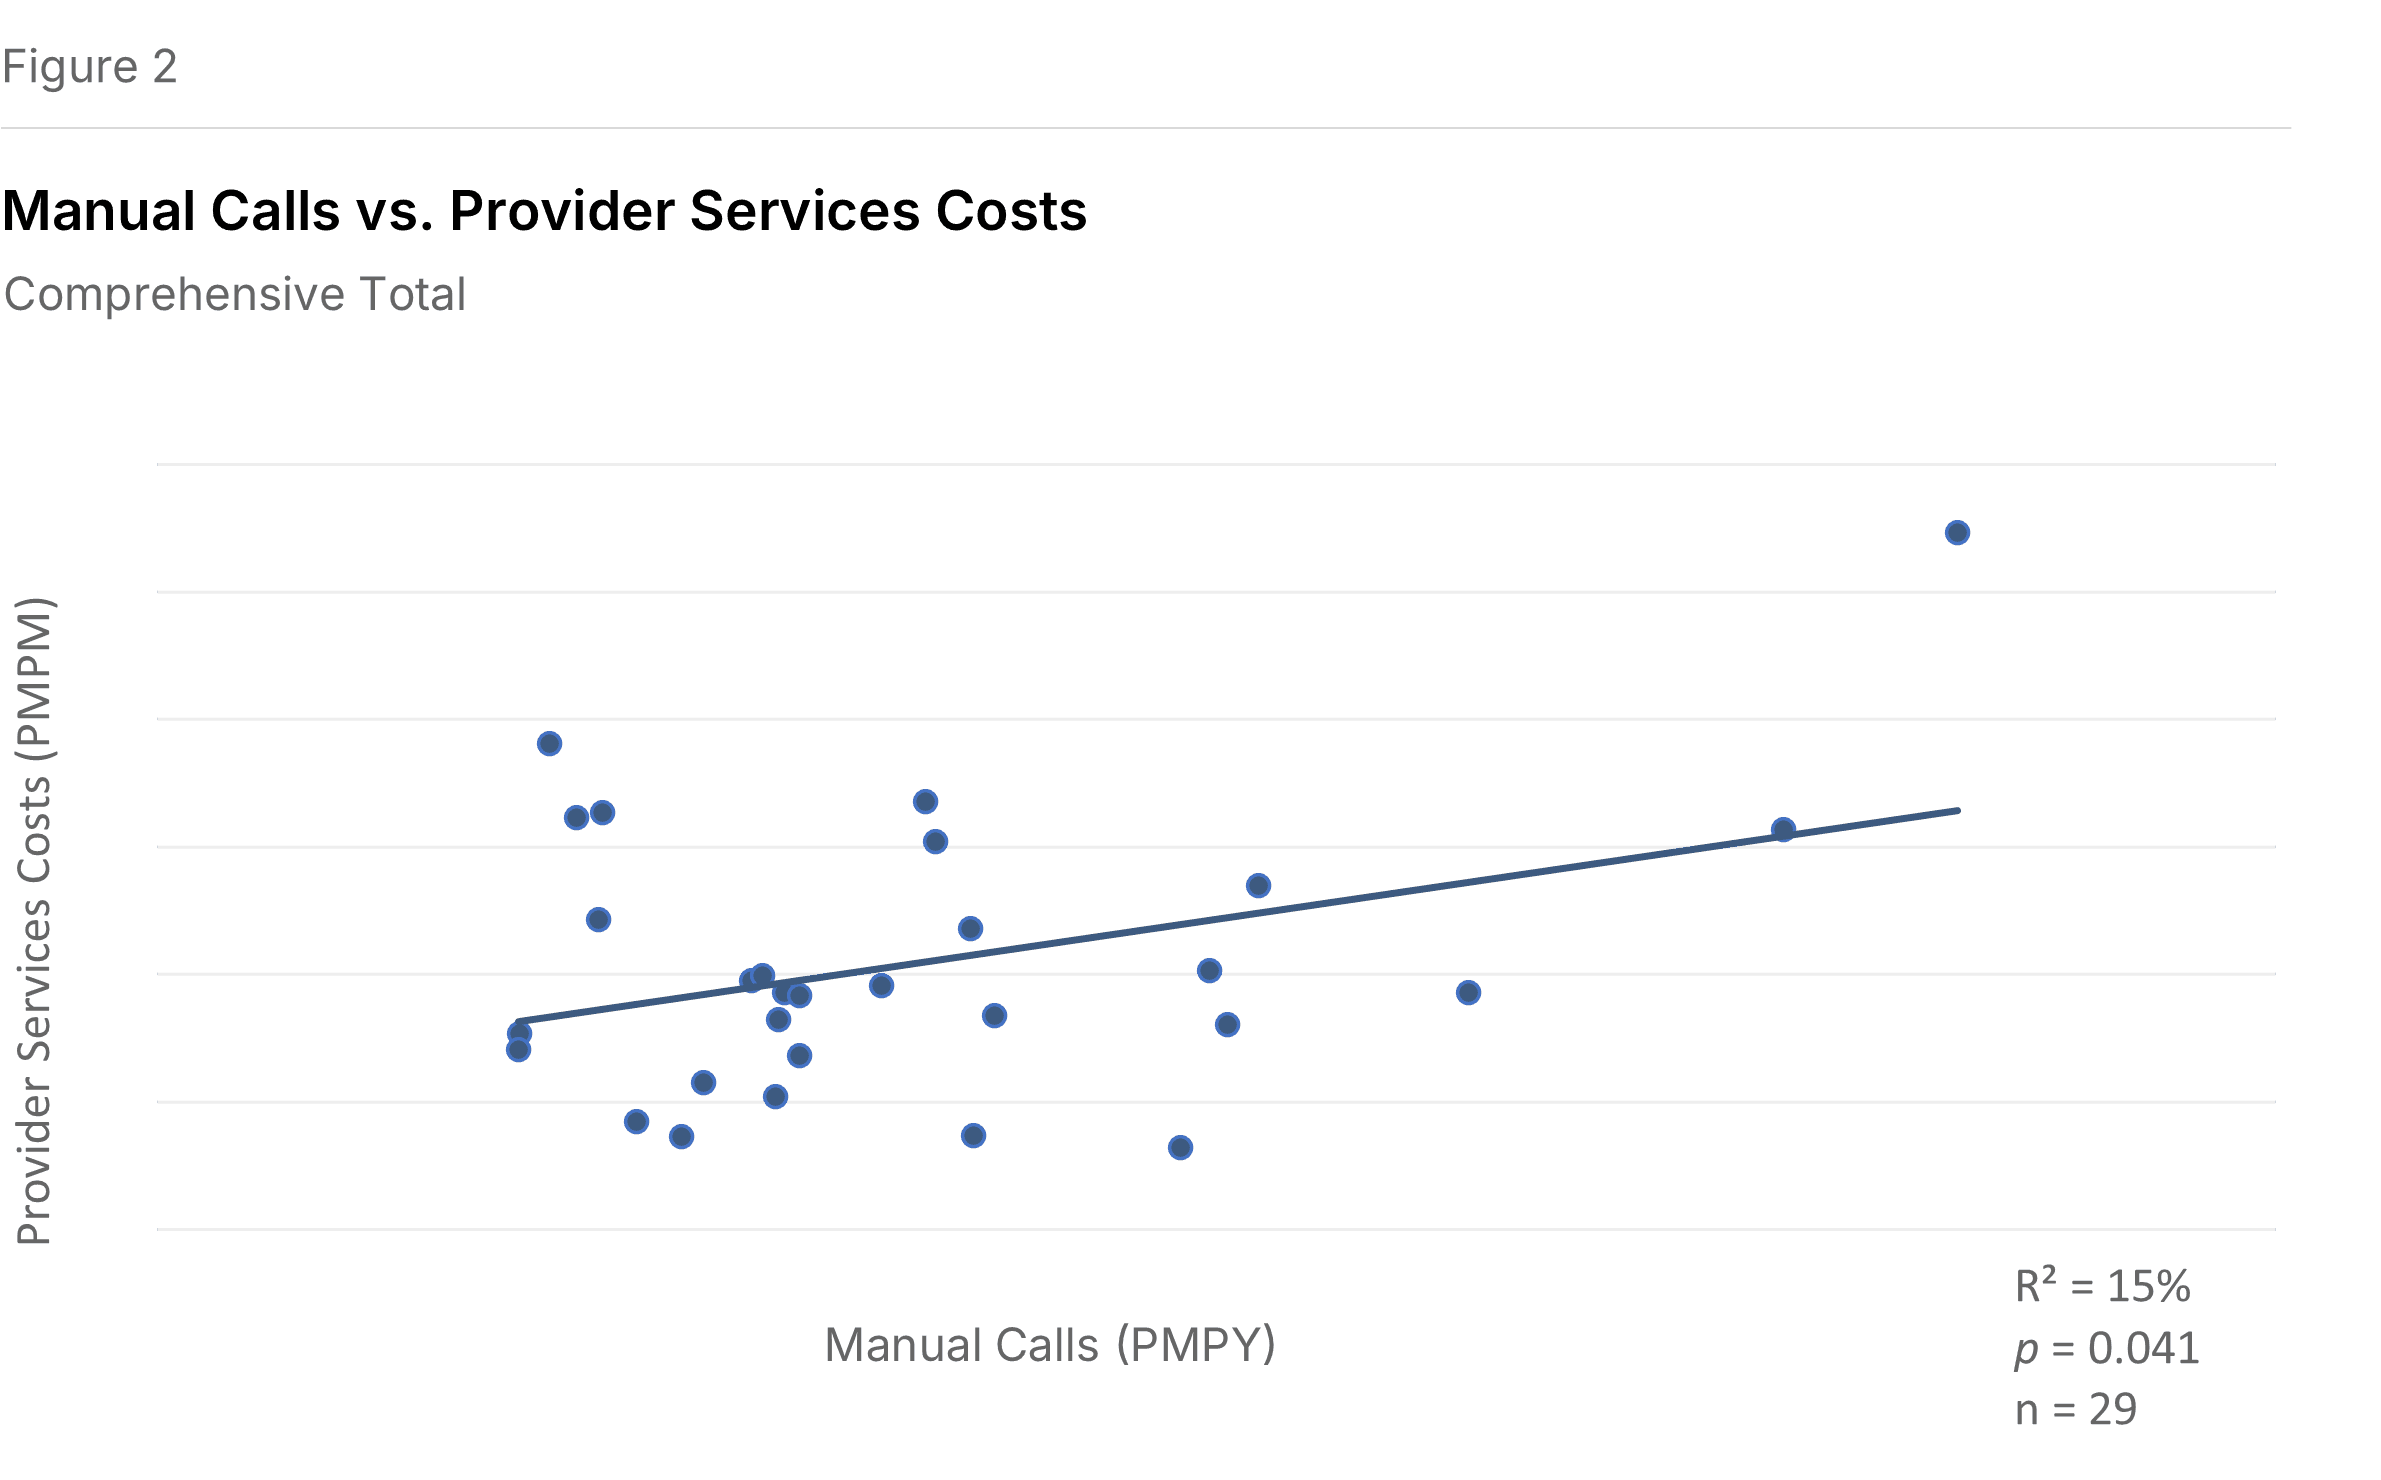
Figure 2 narrows the focus to manual calls specifically (telephone contacts handled by a representative in a call center). The relationship with Provider Relations costs remains positive, though weaker (P=0.041, R²=15%).
Member Services
The largest sub-function in Customer Services. Member Services is the primary point of contact between members and the health plan. Inquiry volume shows a consistent relationship with costs across multiple measures.
Figure 3 looks at total manual inquiries per member per year—all member contacts requiring a response from a customer service rep, including calls, written inquiries, and electronic inquiries. The relationship with Member Services costs is significant (P=0.006, R²=26%). More inquiries, higher costs.
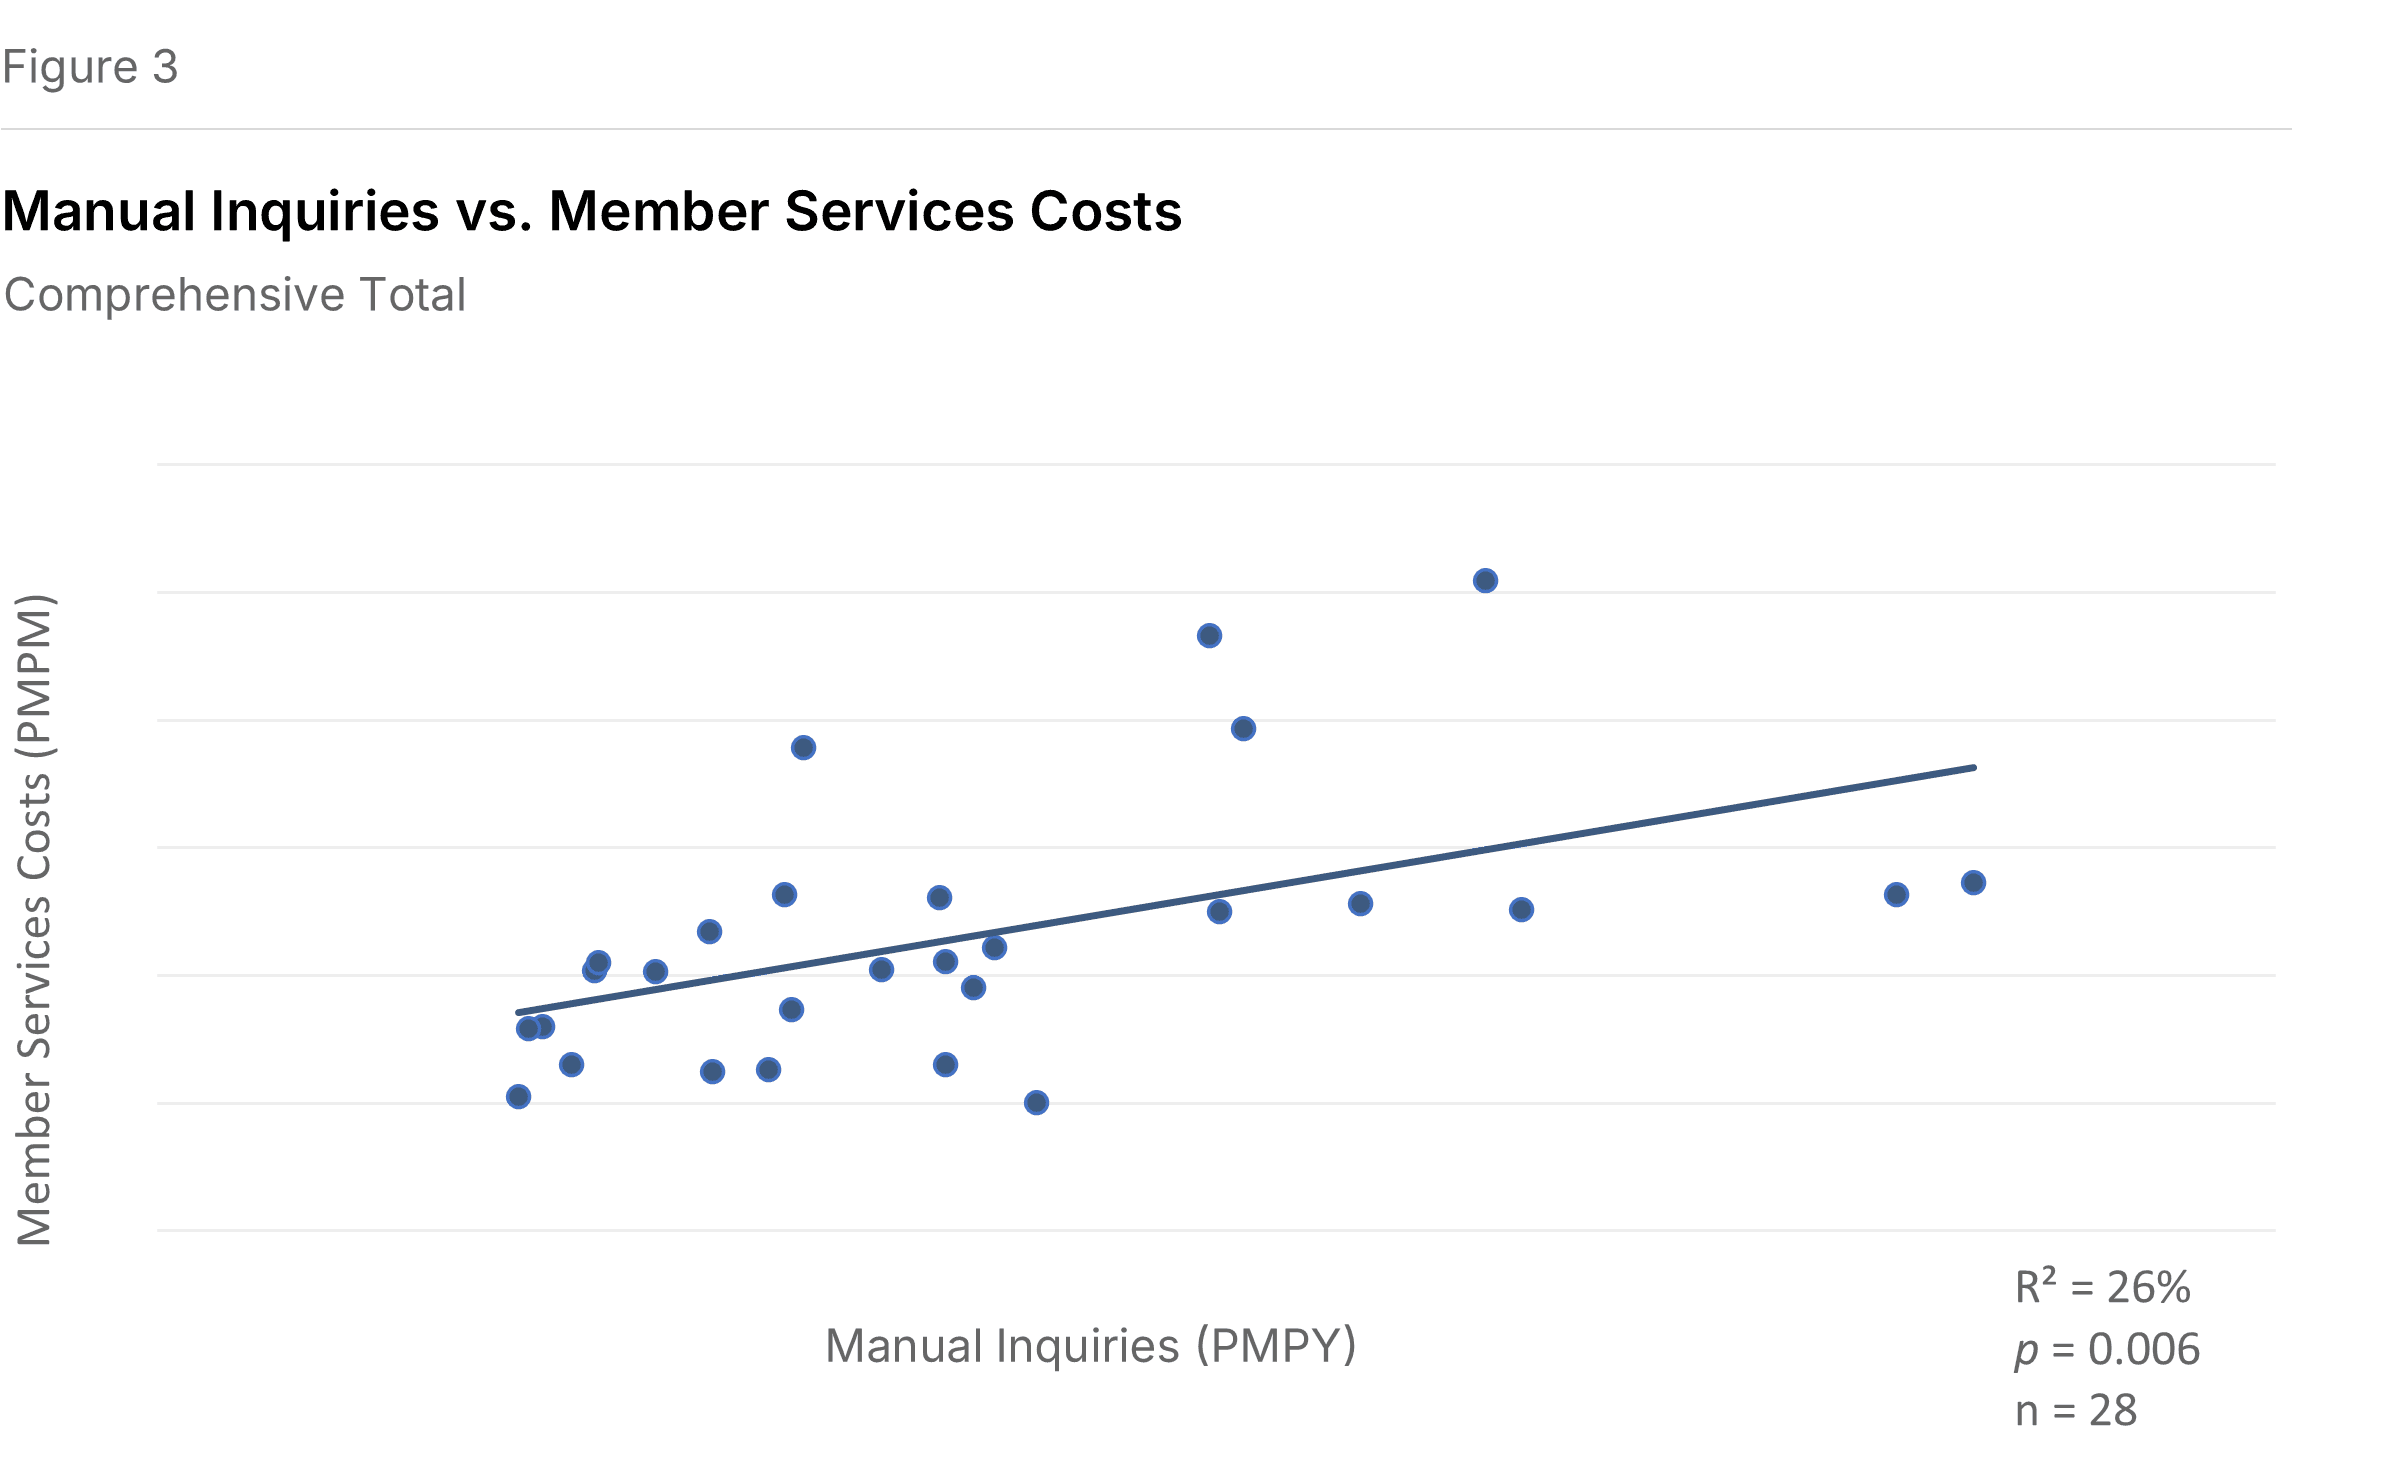
Figure 4 isolates manual calls. The pattern holds (P=0.004, R²=28%).
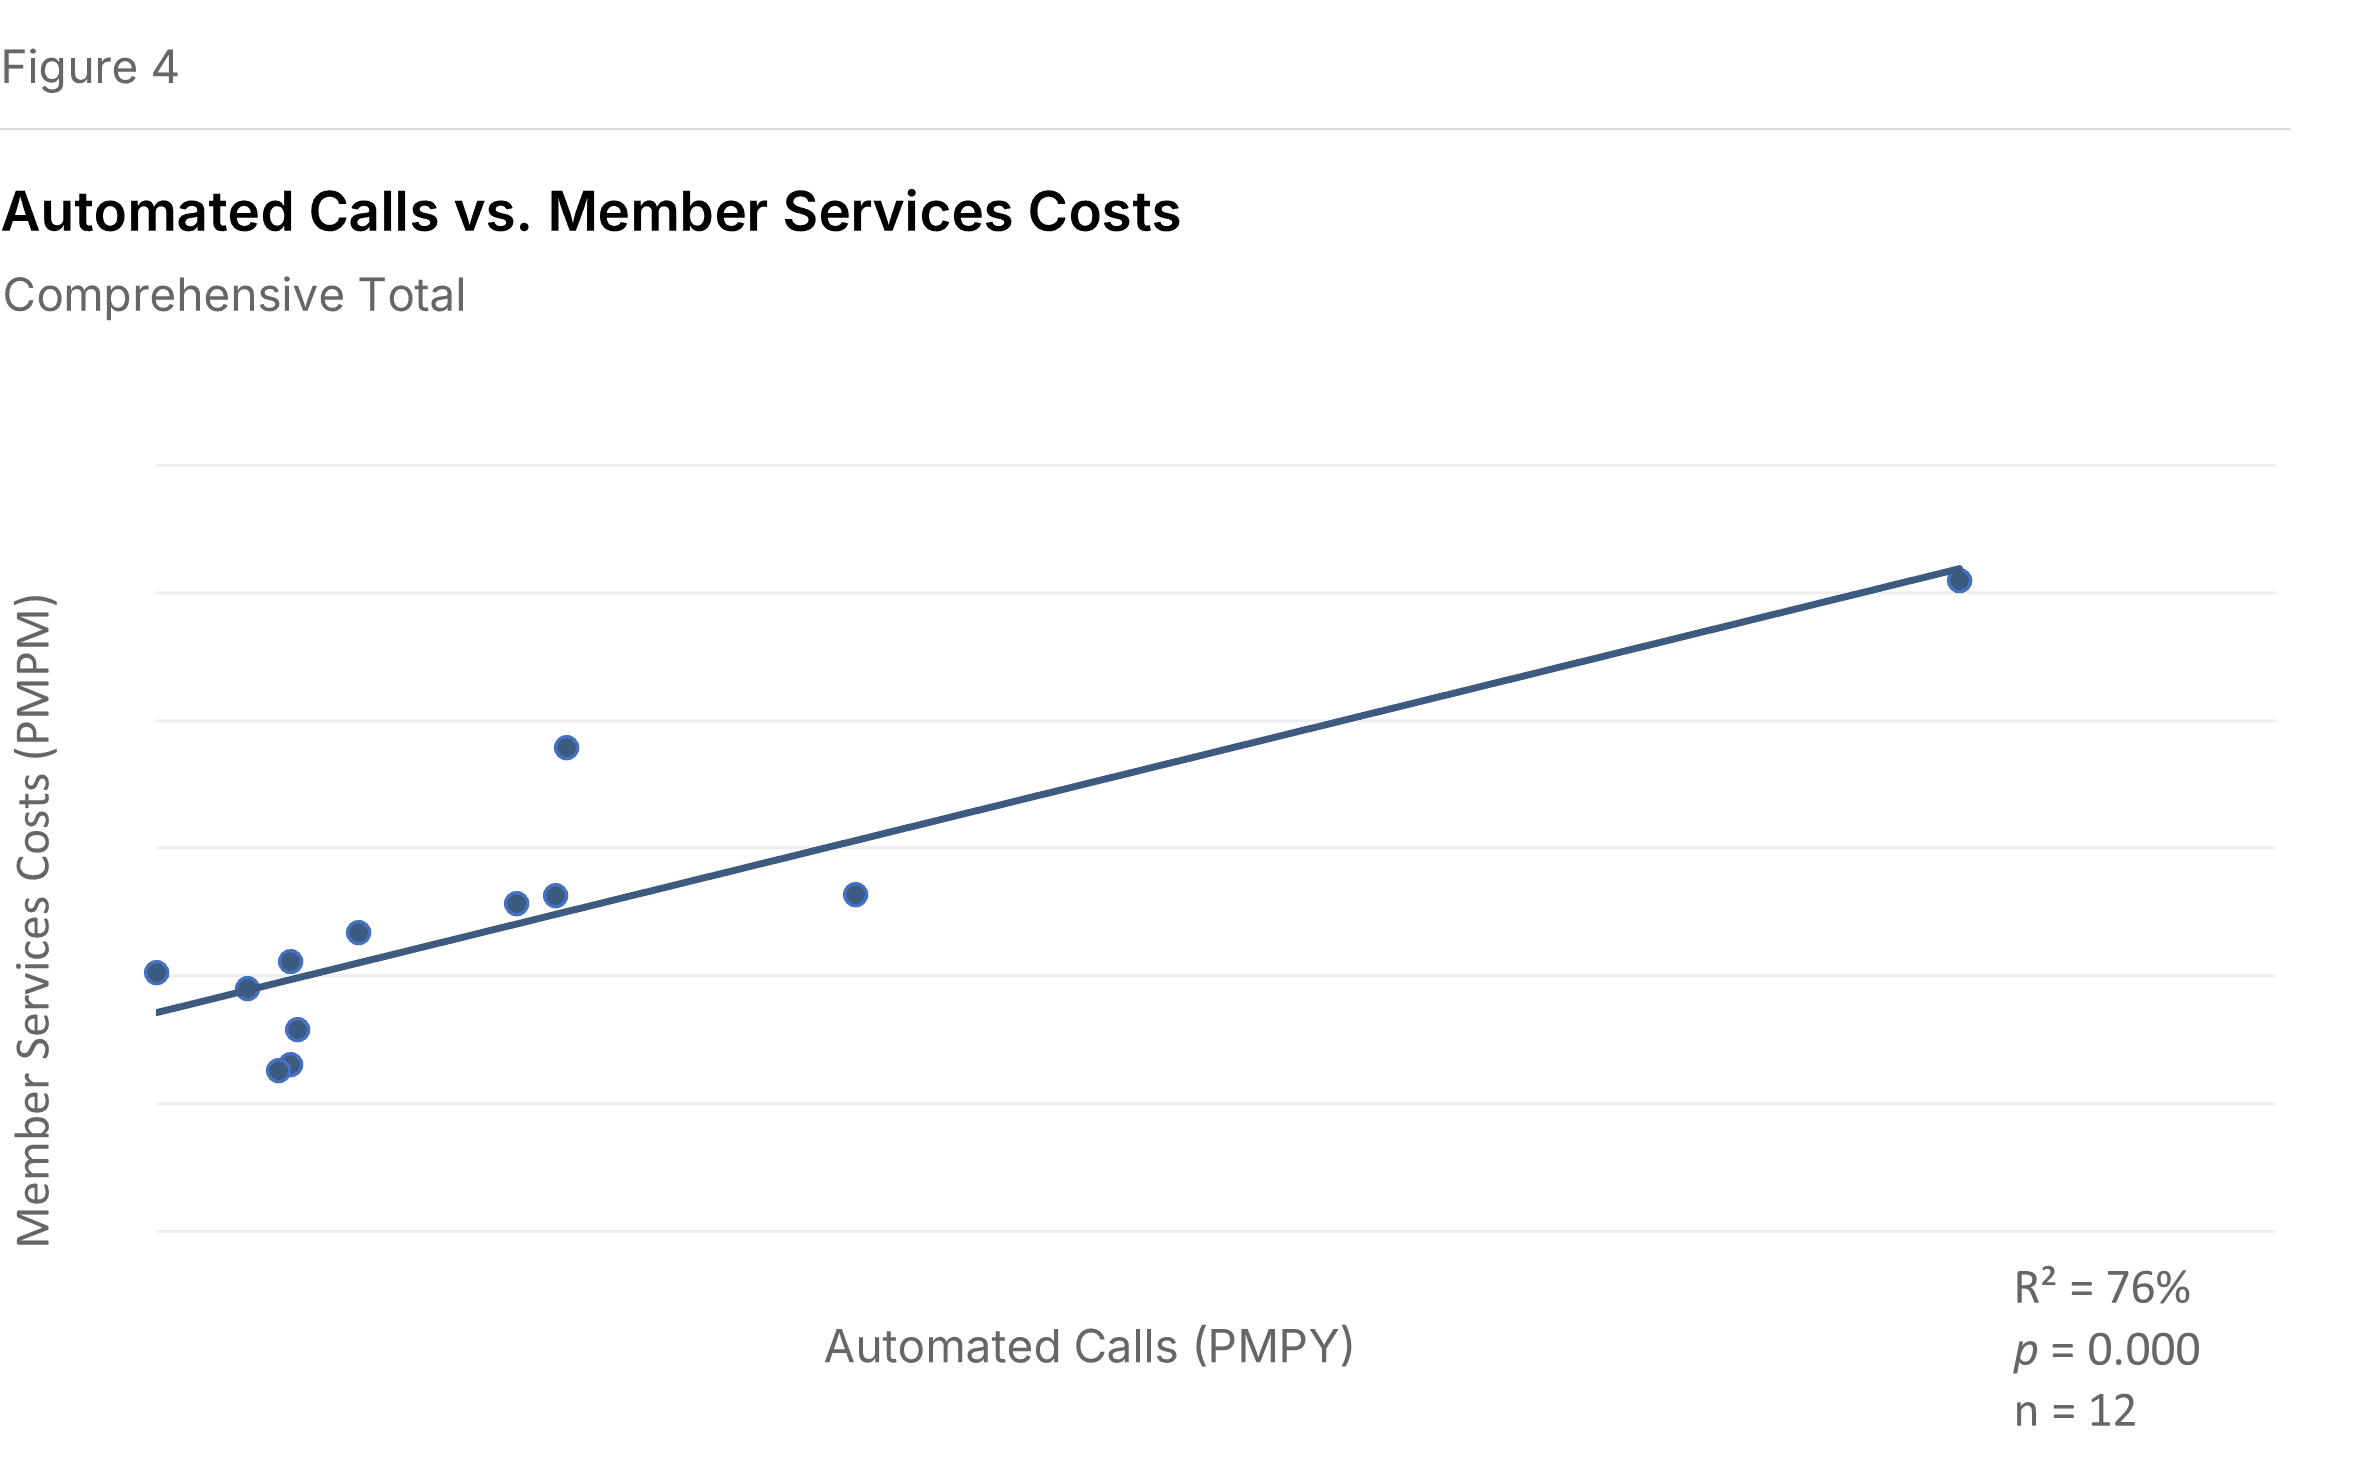
Automated calls don't eliminate the cost relationship. Figure 5 shows something initially counterintuitive: plans with higher volumes of automated calls (those handled entirely by an automated system, no rep involved) also tend to have higher Member Services costs. The relationship is strong (P=0.0002, R²=76%).
This likely reflects that automation volume tracks with overall member engagement. Plans with more member interaction have more of everything—automated and manual. Automation handles volume; it doesn't eliminate the operational footprint.
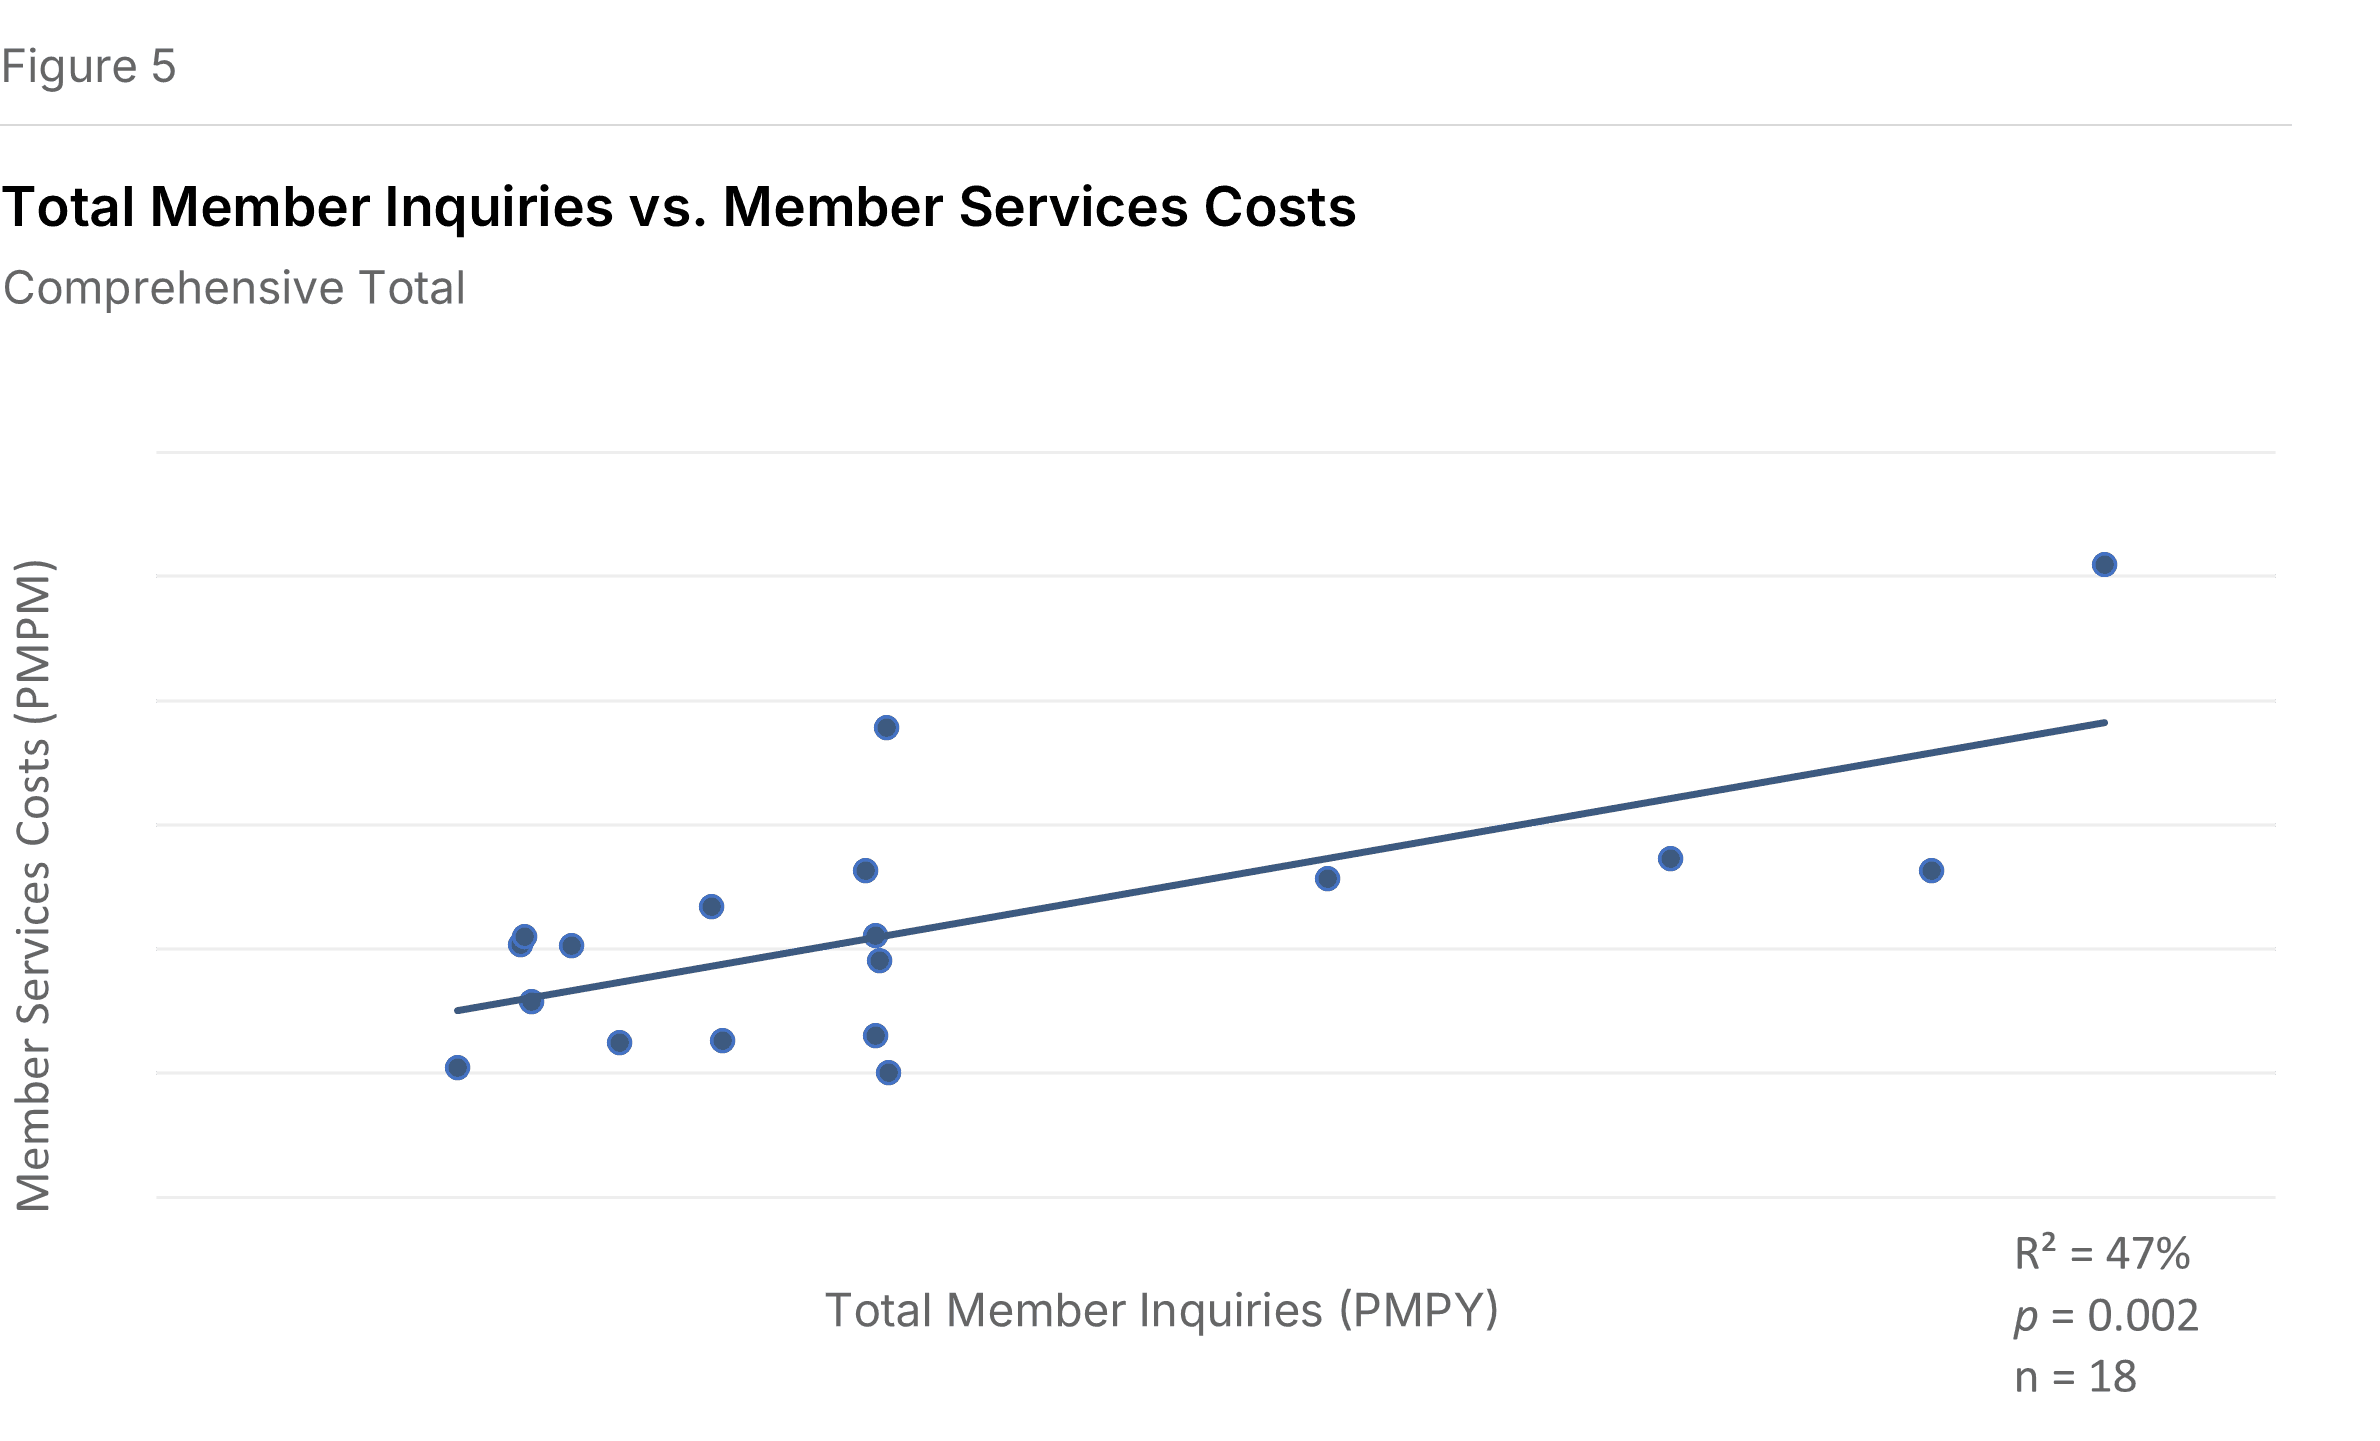
Figure 6 combines manual and automated inquiries into total member inquiries. The positive relationship with costs holds (P=0.002, R²=47%).
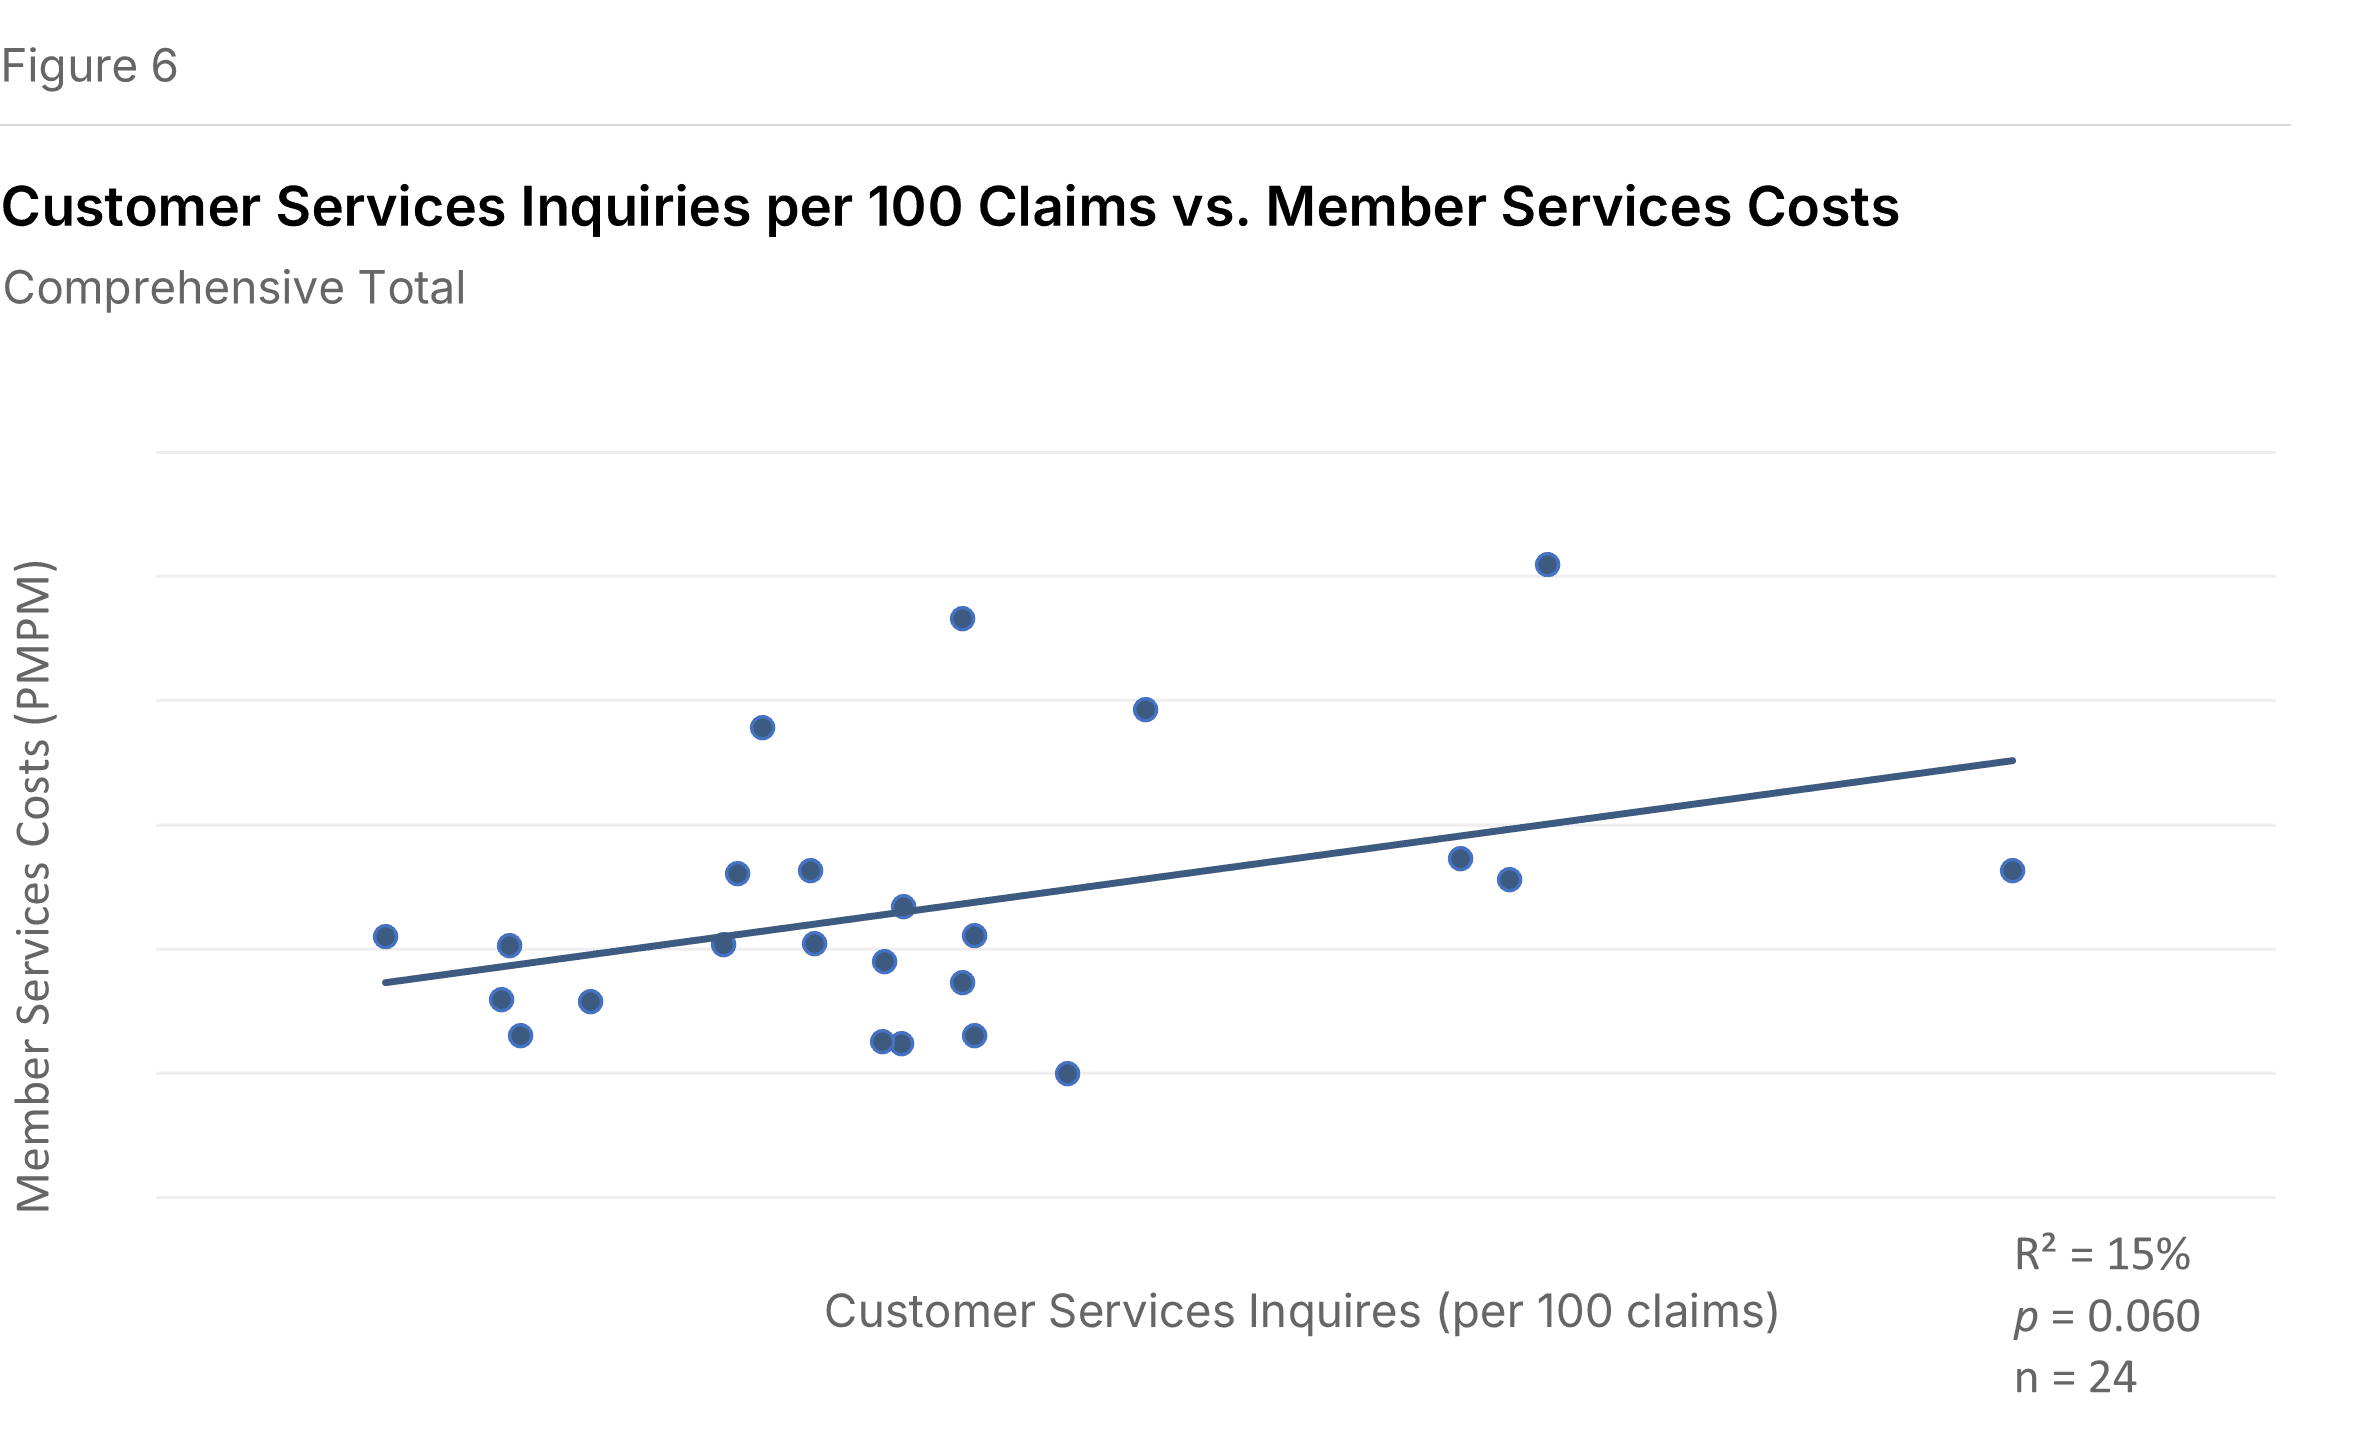
The relationship persists when standardizing inquiries per 100 claims rather than per member (P=0.060, R²=15%), which makes sense given that claims questions represent a significant share of member inquiries (17% median for Blues Commercial, 15% for IPS Commercial). See Figure 6 below.
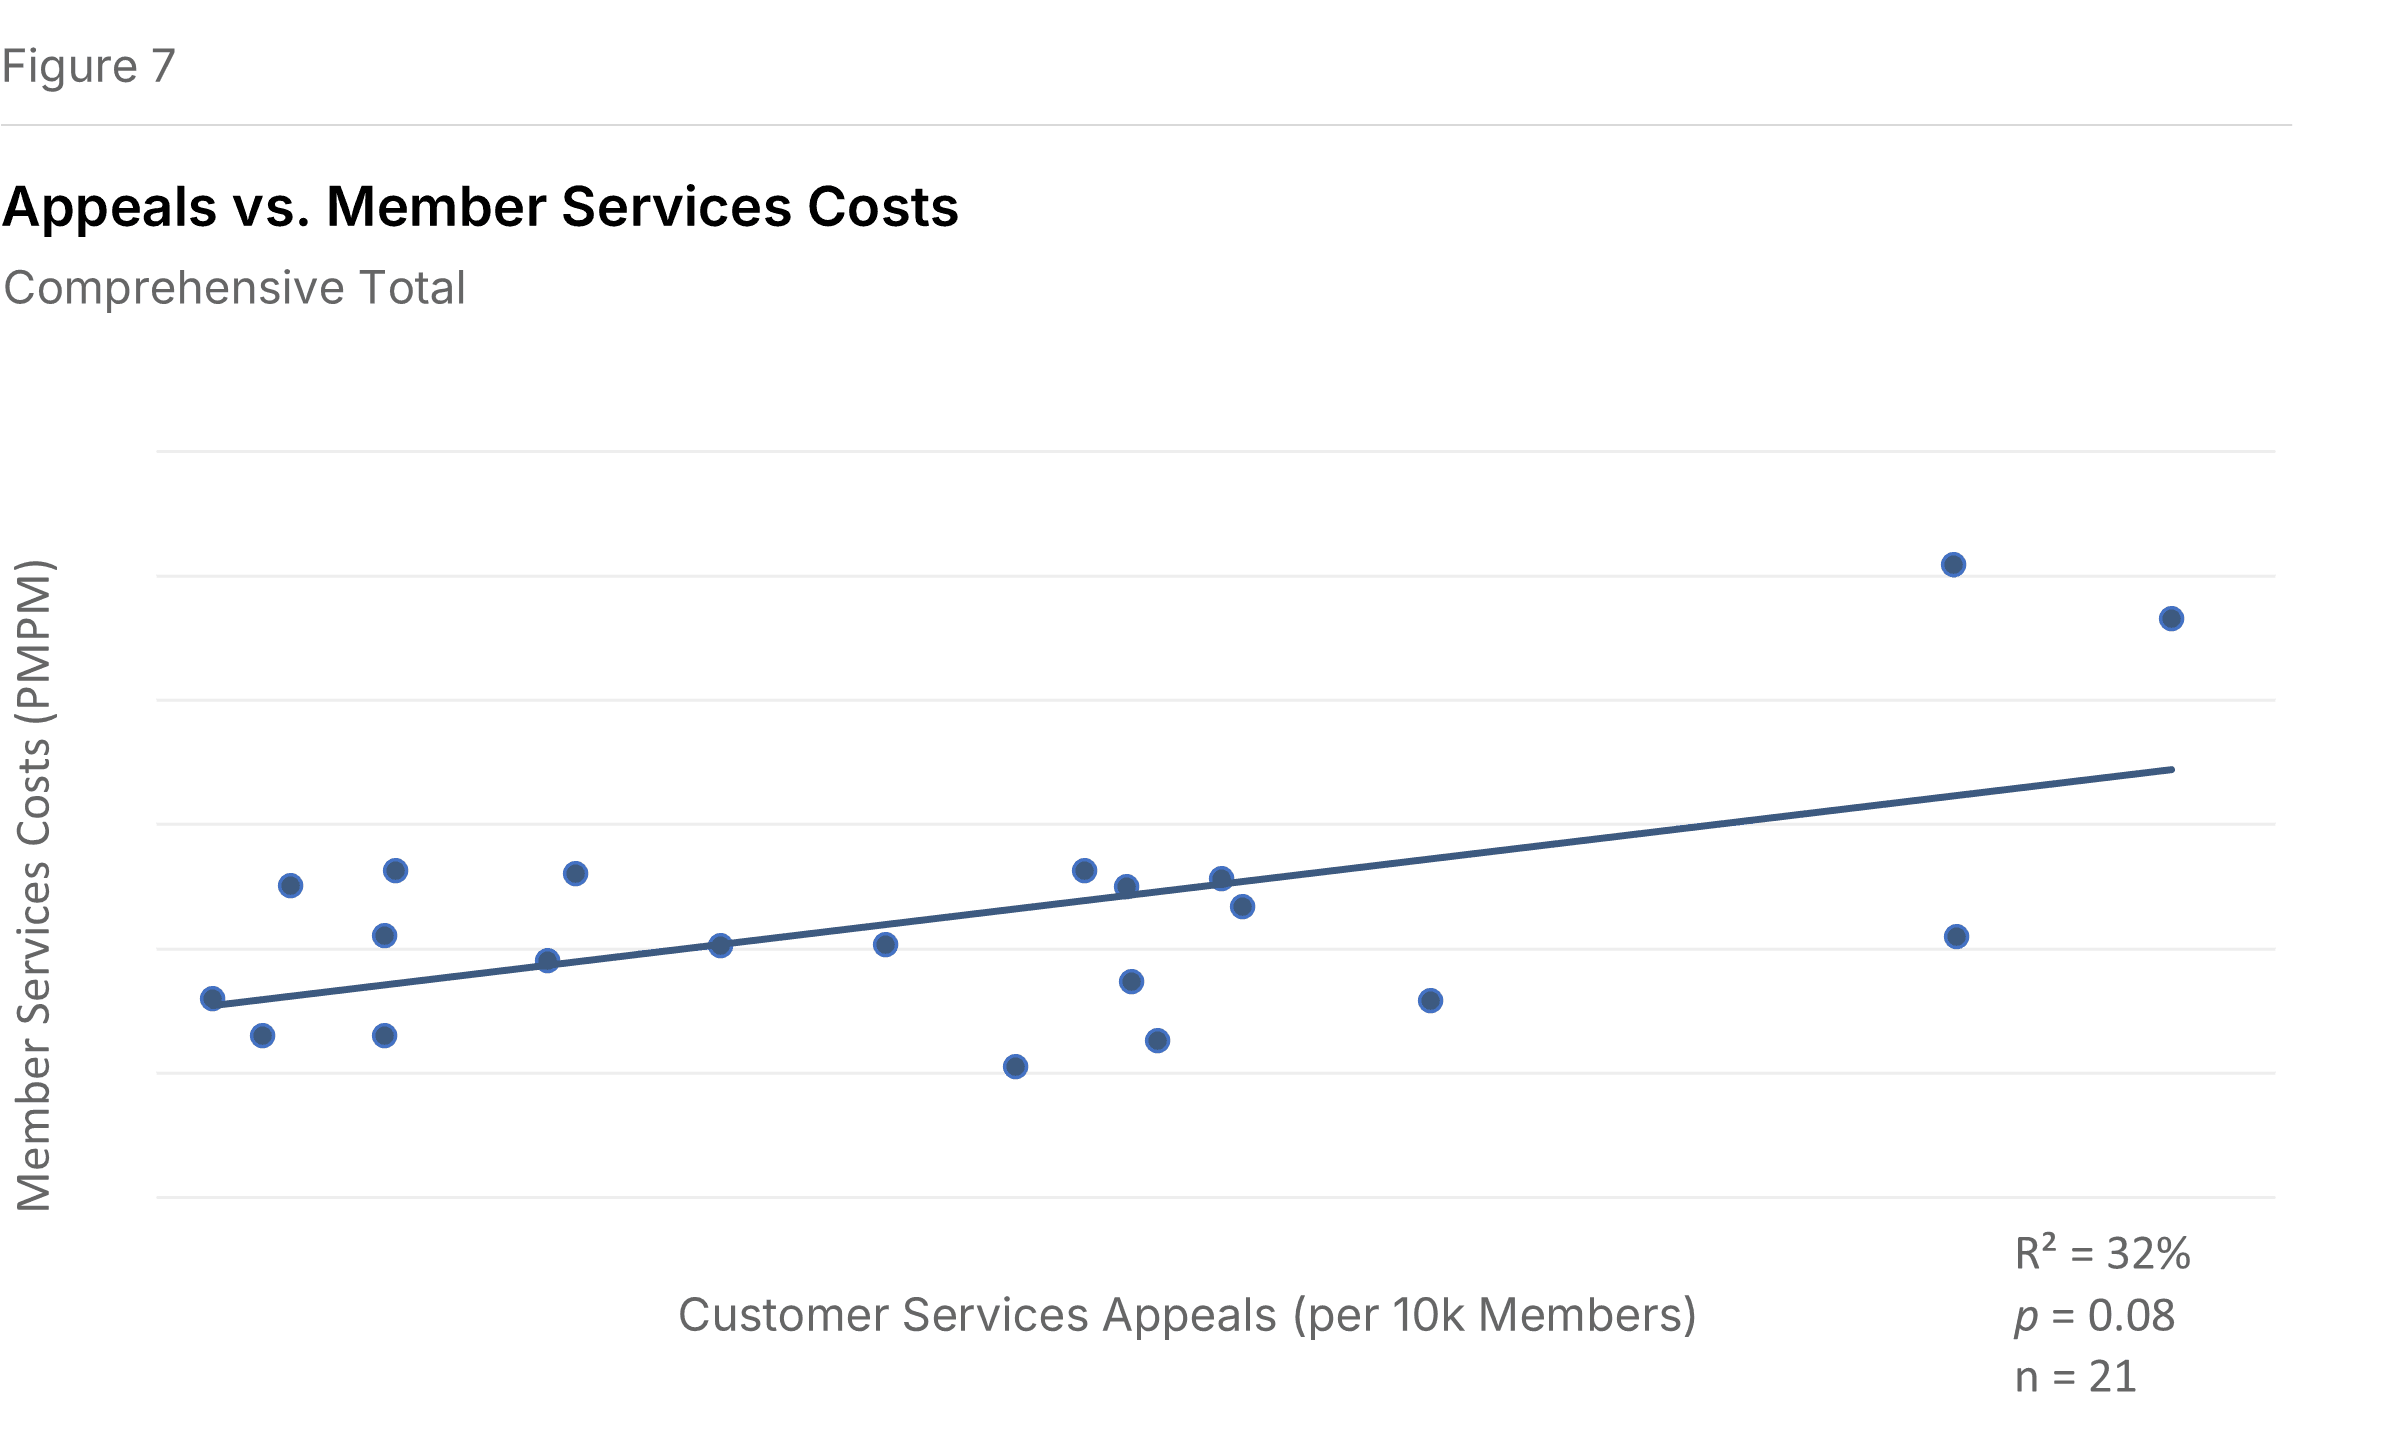
Appeals add cost. Figure 7 shows the relationship between appeals per 10,000 members and Member Services costs. Appeals are requests to change a plan decision, initiated by either members or providers. The correlation is significant (P=0.008, R²=32%). Reducing the conditions that generate appeals may matter as much as processing them efficiently.
Claims Automation
Higher auto-adjudication, lower manual claims costs. Most health plan claims are processed automatically through rules in Information Systems. Auto-adjudicated claims—those processed without manual intervention, including those handled by scripts that extend standard rules—are an IS cost. Claims that fail auto-adjudication become a Claims function cost.
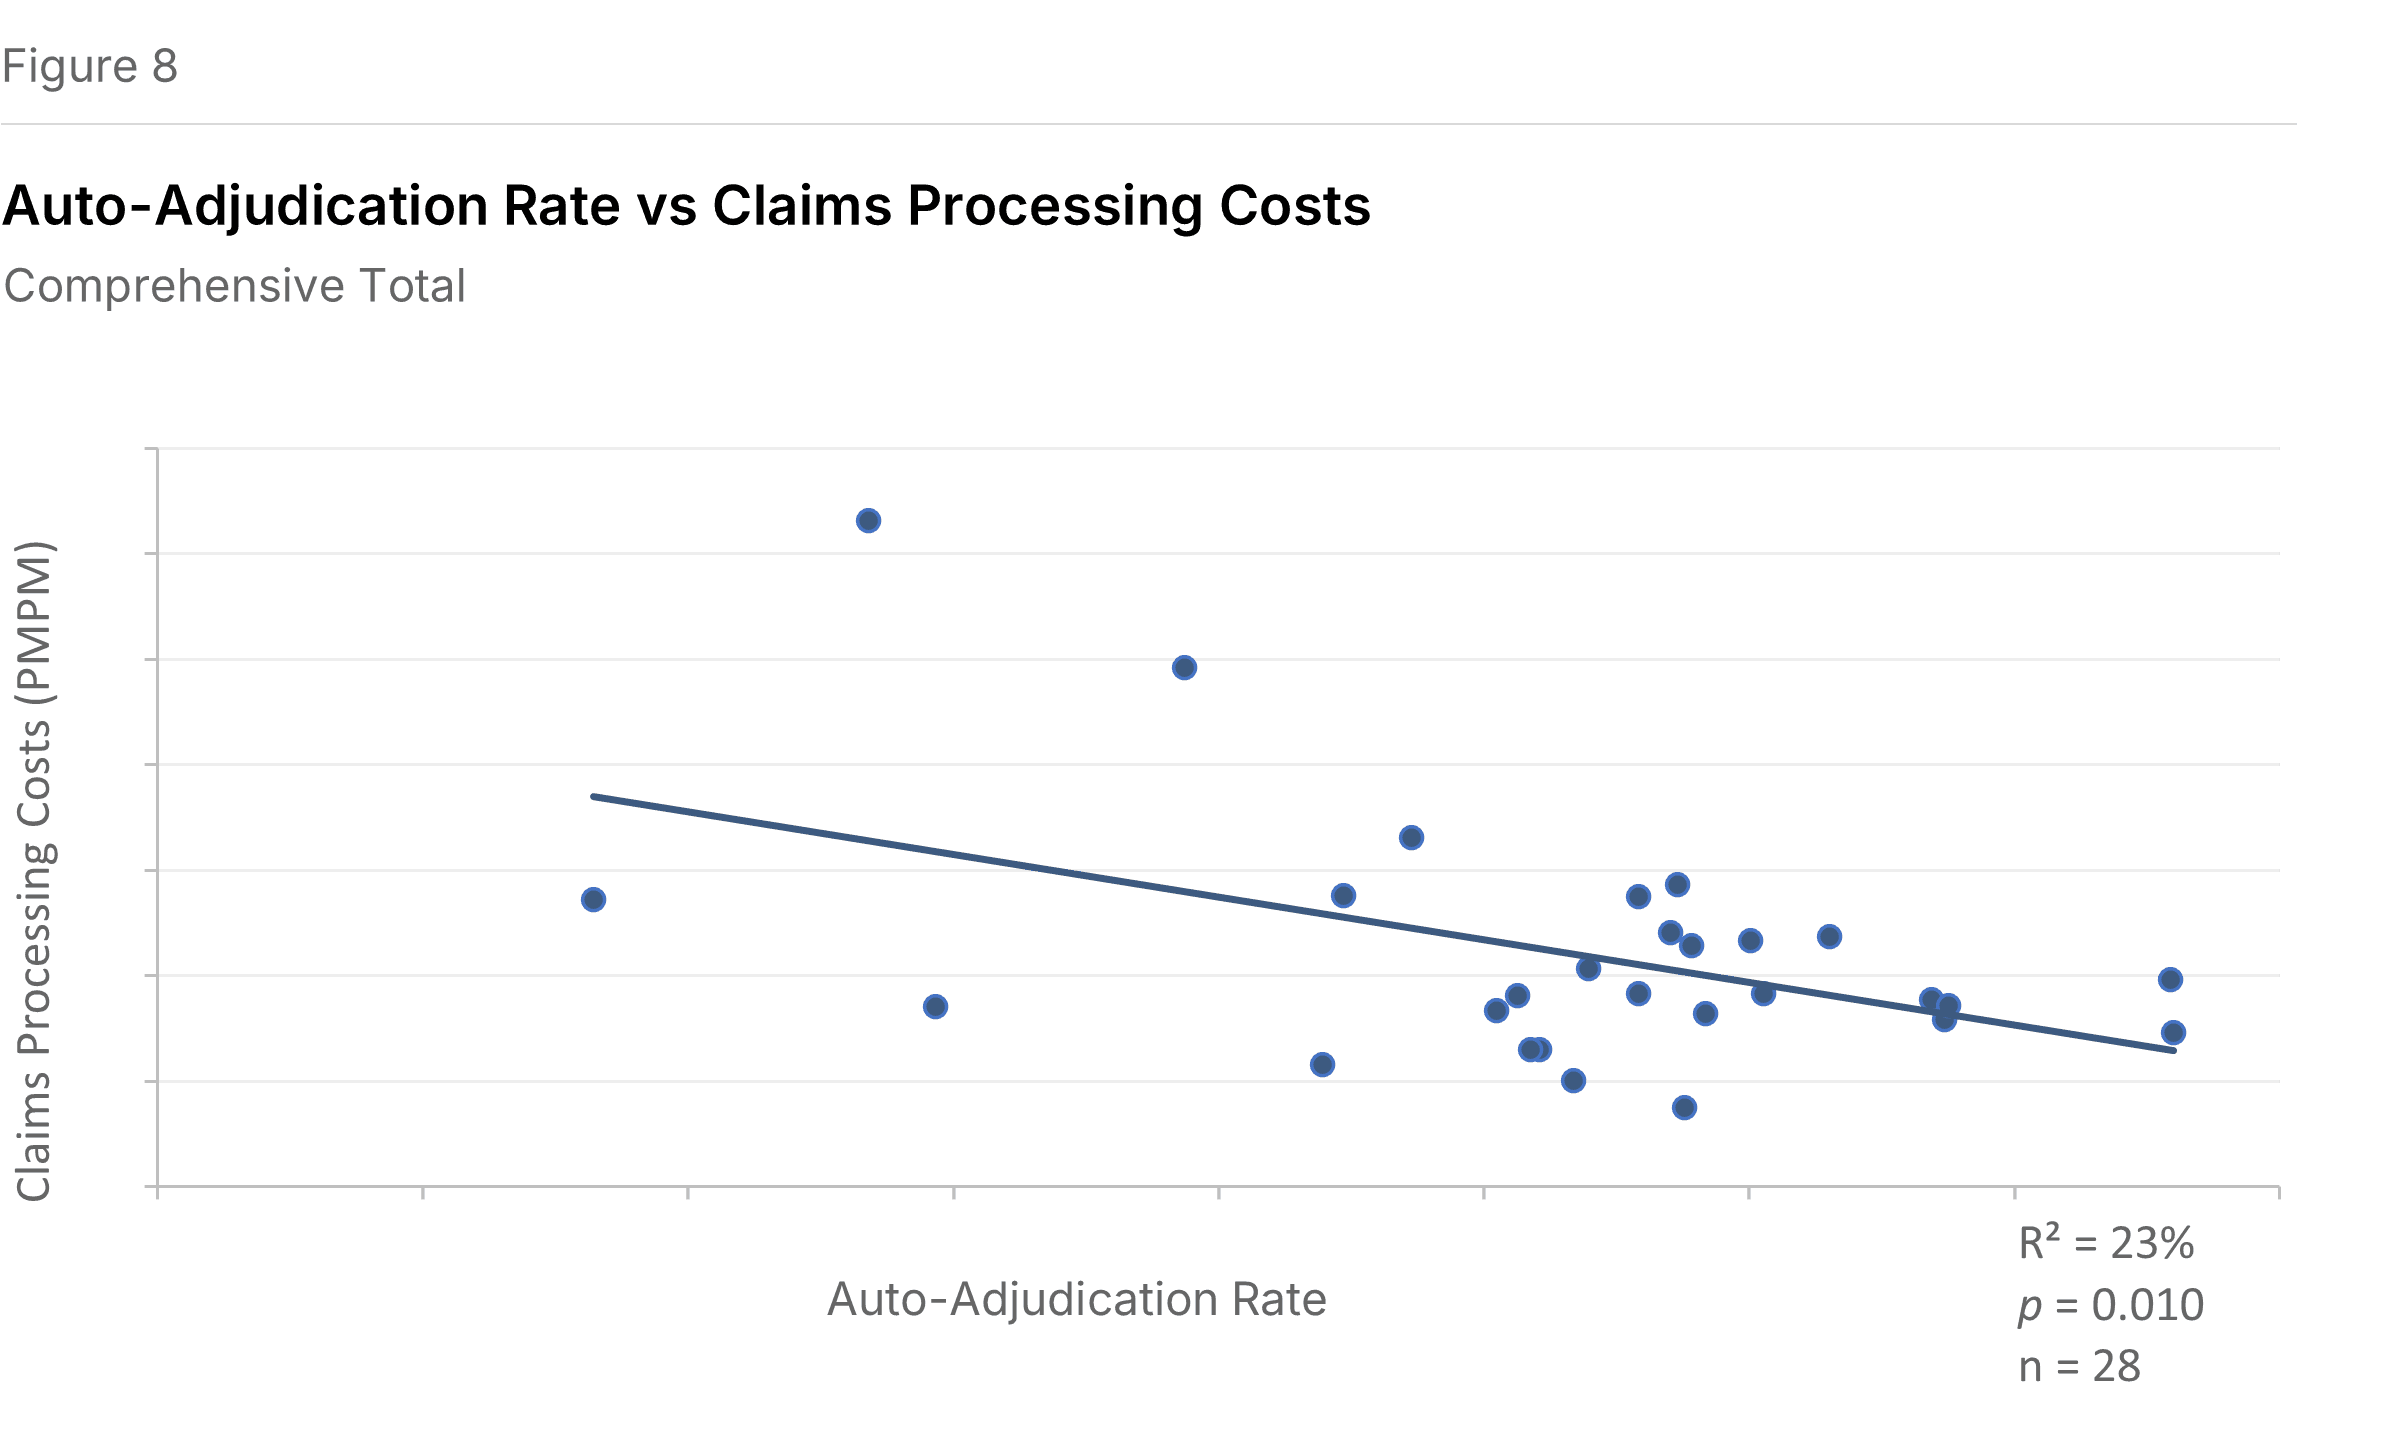
Figure 8 confirms the expected inverse relationship: plans with higher auto-adjudication rates have lower costs in the Other Claims sub-function (P=0.010, R²=23%). Other Claims represents the majority of costs in the Claims functional area and reflects mainly manual processing.
What This Means
These relationships point in a consistent direction: administrative cost management isn't only about efficiency within functions. It's about understanding what generates the work.
High provider inquiry volume might stem from confusing contracts, poor directory accuracy, or slow claims payment. High member inquiry volume might reflect unclear EOBs, benefit complexity, or gaps in self-service options. Low auto-adjudication rates might indicate outdated rules, inconsistent provider data, or over-customized benefit designs.
Efficiencies achieved in operational metrics can drive improvements in financial performance. In a low-margin industry, even modest improvements matter.
About This Analysis
This analysis is based on 32 plans that participated in the 2025 Sherlock Benchmarks, reflecting results from the year ended 2024. Not all plans supplied every operational metric or serve all products benchmarked.
We use a 0.10 P-value threshold for significance—generous, but appropriate for exploratory analysis. R² values indicate how much of the cost variation is explained by the operational metric; in most cases, a minority, meaning other factors also contribute. We have not removed outliers that are apparent only visually.
Unless otherwise noted, all relationships reflect Comprehensive Total products (physician/hospital coverage, excluding standalone Part D).