
Summary
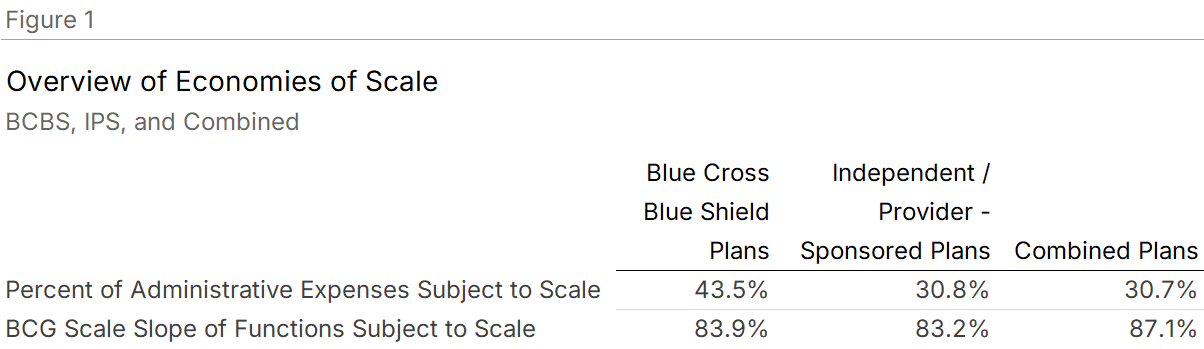
Scale matters, but less than you might think. Health plans in the 2025 Sherlock Benchmarks show economies of scale in a minority of administrative functions. Where scale effects exist, doubling plan size reduces costs in those functions to roughly 83-87% of their pre-doubling levels. But scale-sensitive functions represent only 30-44% of total administrative costs, depending on plan type.
For Blue Cross Blue Shield Plans, 22 functions showed significant economies of scale, comprising 43.5% of administrative costs. Doubling membership in these functions yields costs at 83.9% of pre-doubling values. Subtotal expenses (excluding miscellaneous business taxes) also showed scale effects, with a BCG Slope of 94.4%.
For Independent/Provider-Sponsored (IPS) Plans, scale effects were more limited. Ten functions showed economies of scale, representing 30.8% of costs. Doubling membership yields 83.2% of pre-doubling costs in affected functions. Subtotal expenses did not show significant scale effects.
The combined universe of 26 plans showed 11 functions with significant scale effects, comprising 30.7% of costs. Doubling yields 87.1% of pre-doubling values in affected functions.
Applied to a $69 PMPM administrative cost assumption (consistent with commercial insured products), scale savings from doubling plan size equal $2.72 PMPM, or 3.9%. Because health insurance margins are thin, this modest cost reduction translates to a 27.8% increase in operating earnings.
Blue Cross Blue Shield Results
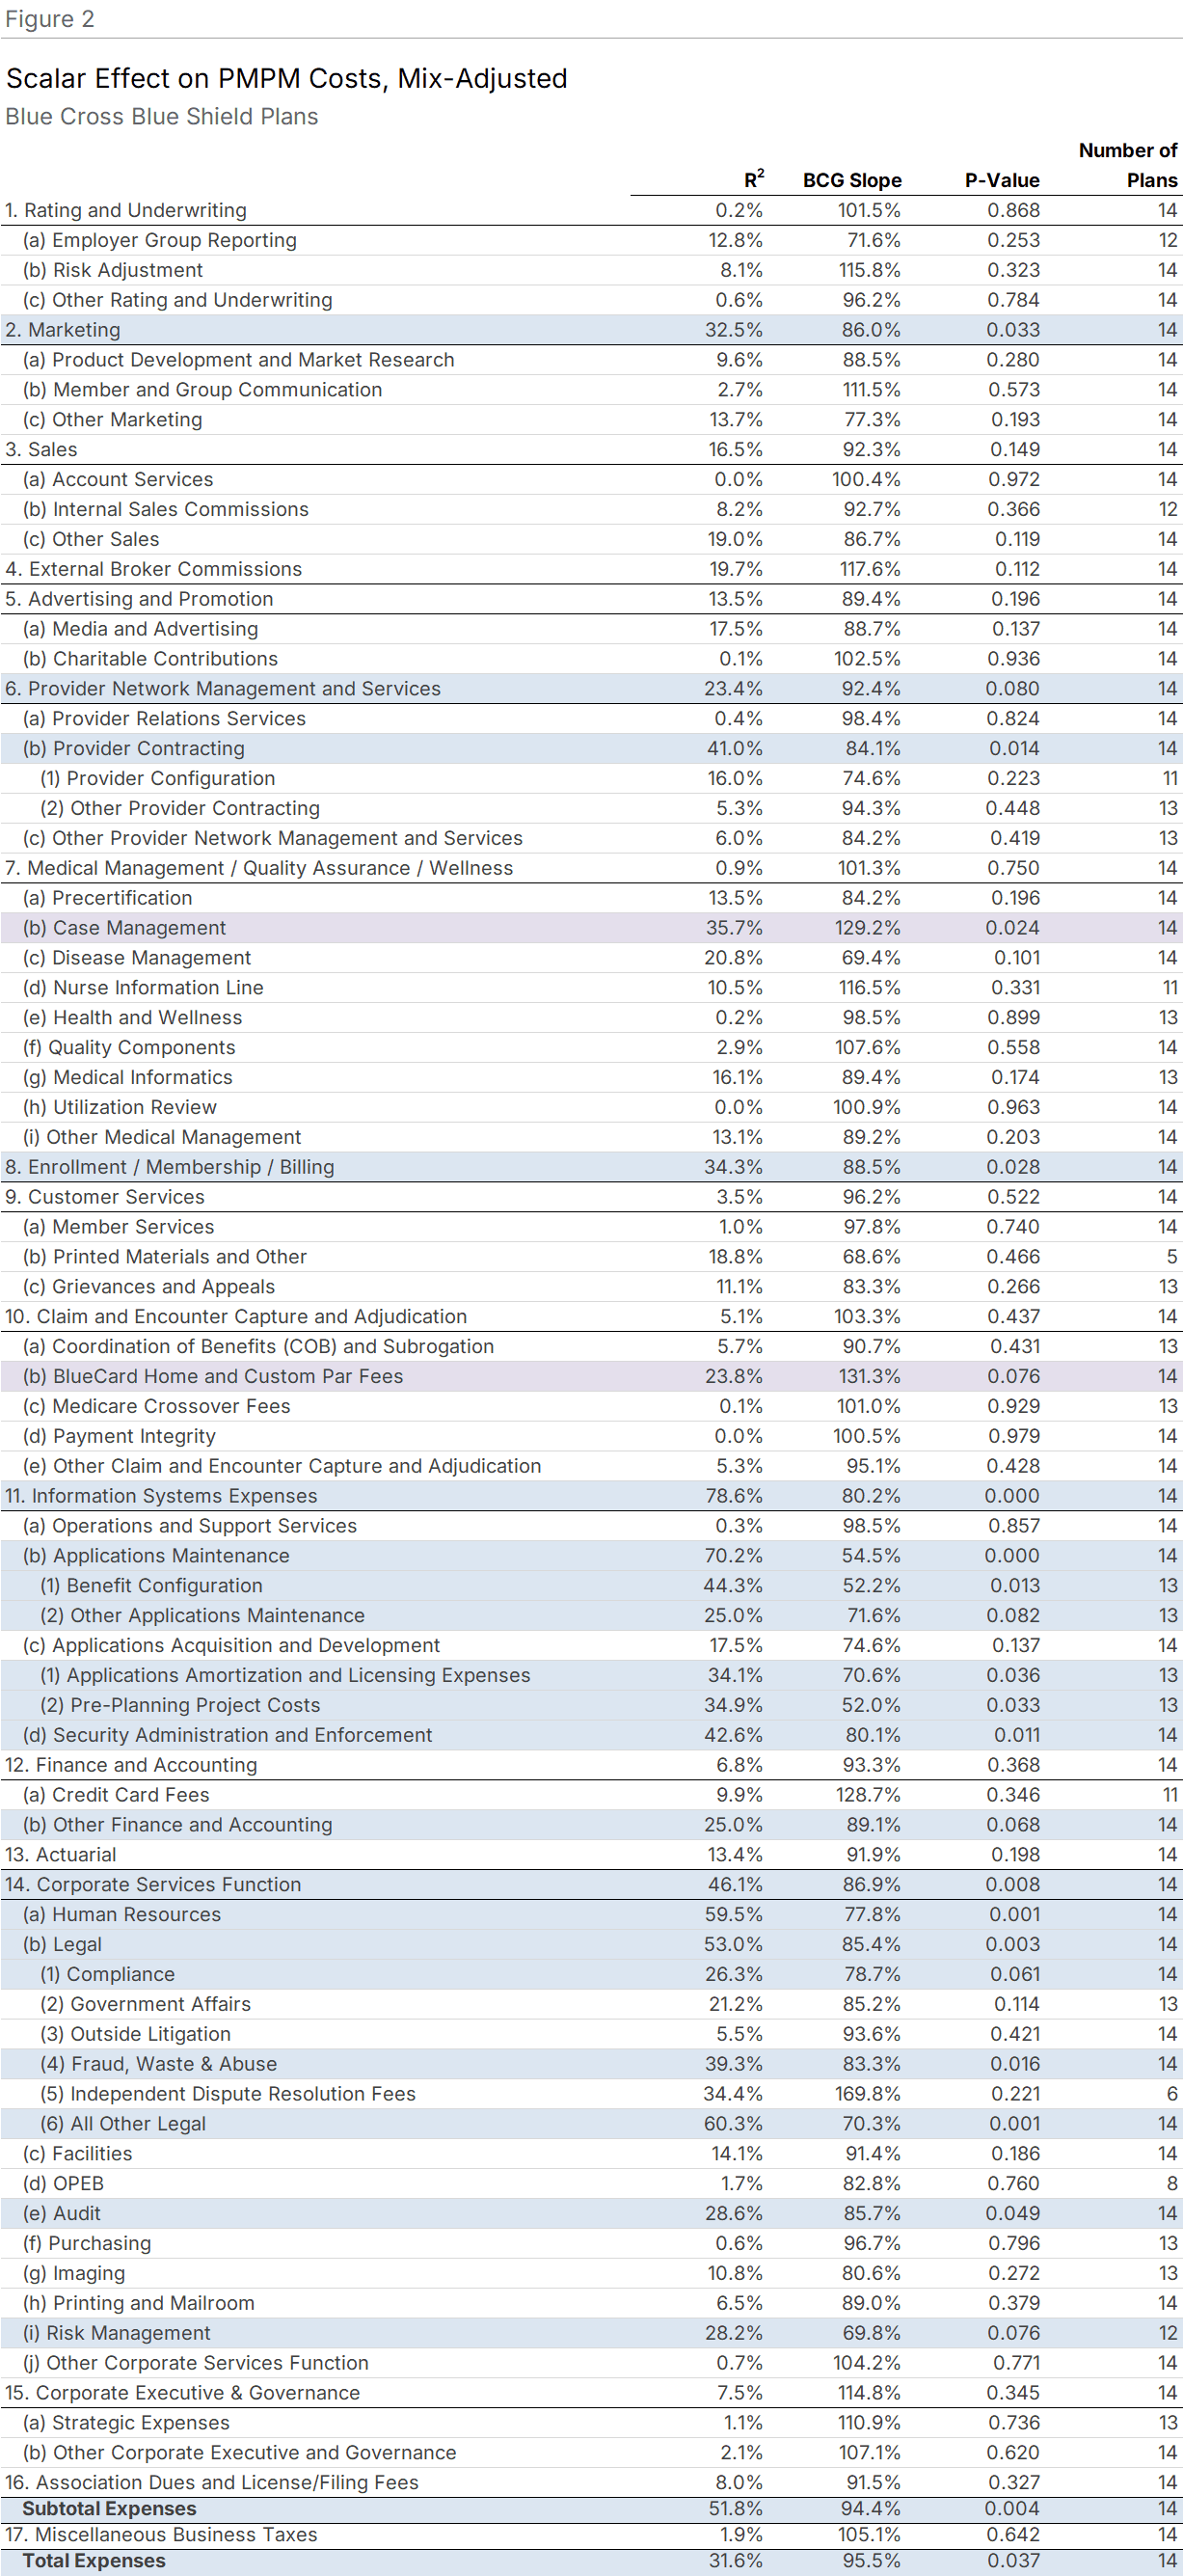
Scale effects are significant but concentrated. Figure 2 shows regression results for the 14 Blue Cross Blue Shield Plans in this analysis, ranging from 347,000 to over 5 million members.
Of total administrative expenses, 43.5% are in functions significantly subject to economies of scale (P<0.10). The slopes indicate that doubling plan size reduces costs in these functions to 83.9% of their pre-doubling levels. Subtotal Expenses showed a BCG Slope of 94.4%.
Of nearly 80 functions and subfunctions analyzed, 22 exhibited economies of scale. These included Provider Configuration, Information Systems, and Corporate Services.
Two functions showed diseconomies of scale, meaning costs increased with size: Case Management, and BlueCard Home and Custom Par Fees. These represented 4.5% of total administrative expenses.
Independent/Provider-Sponsored Plan Results
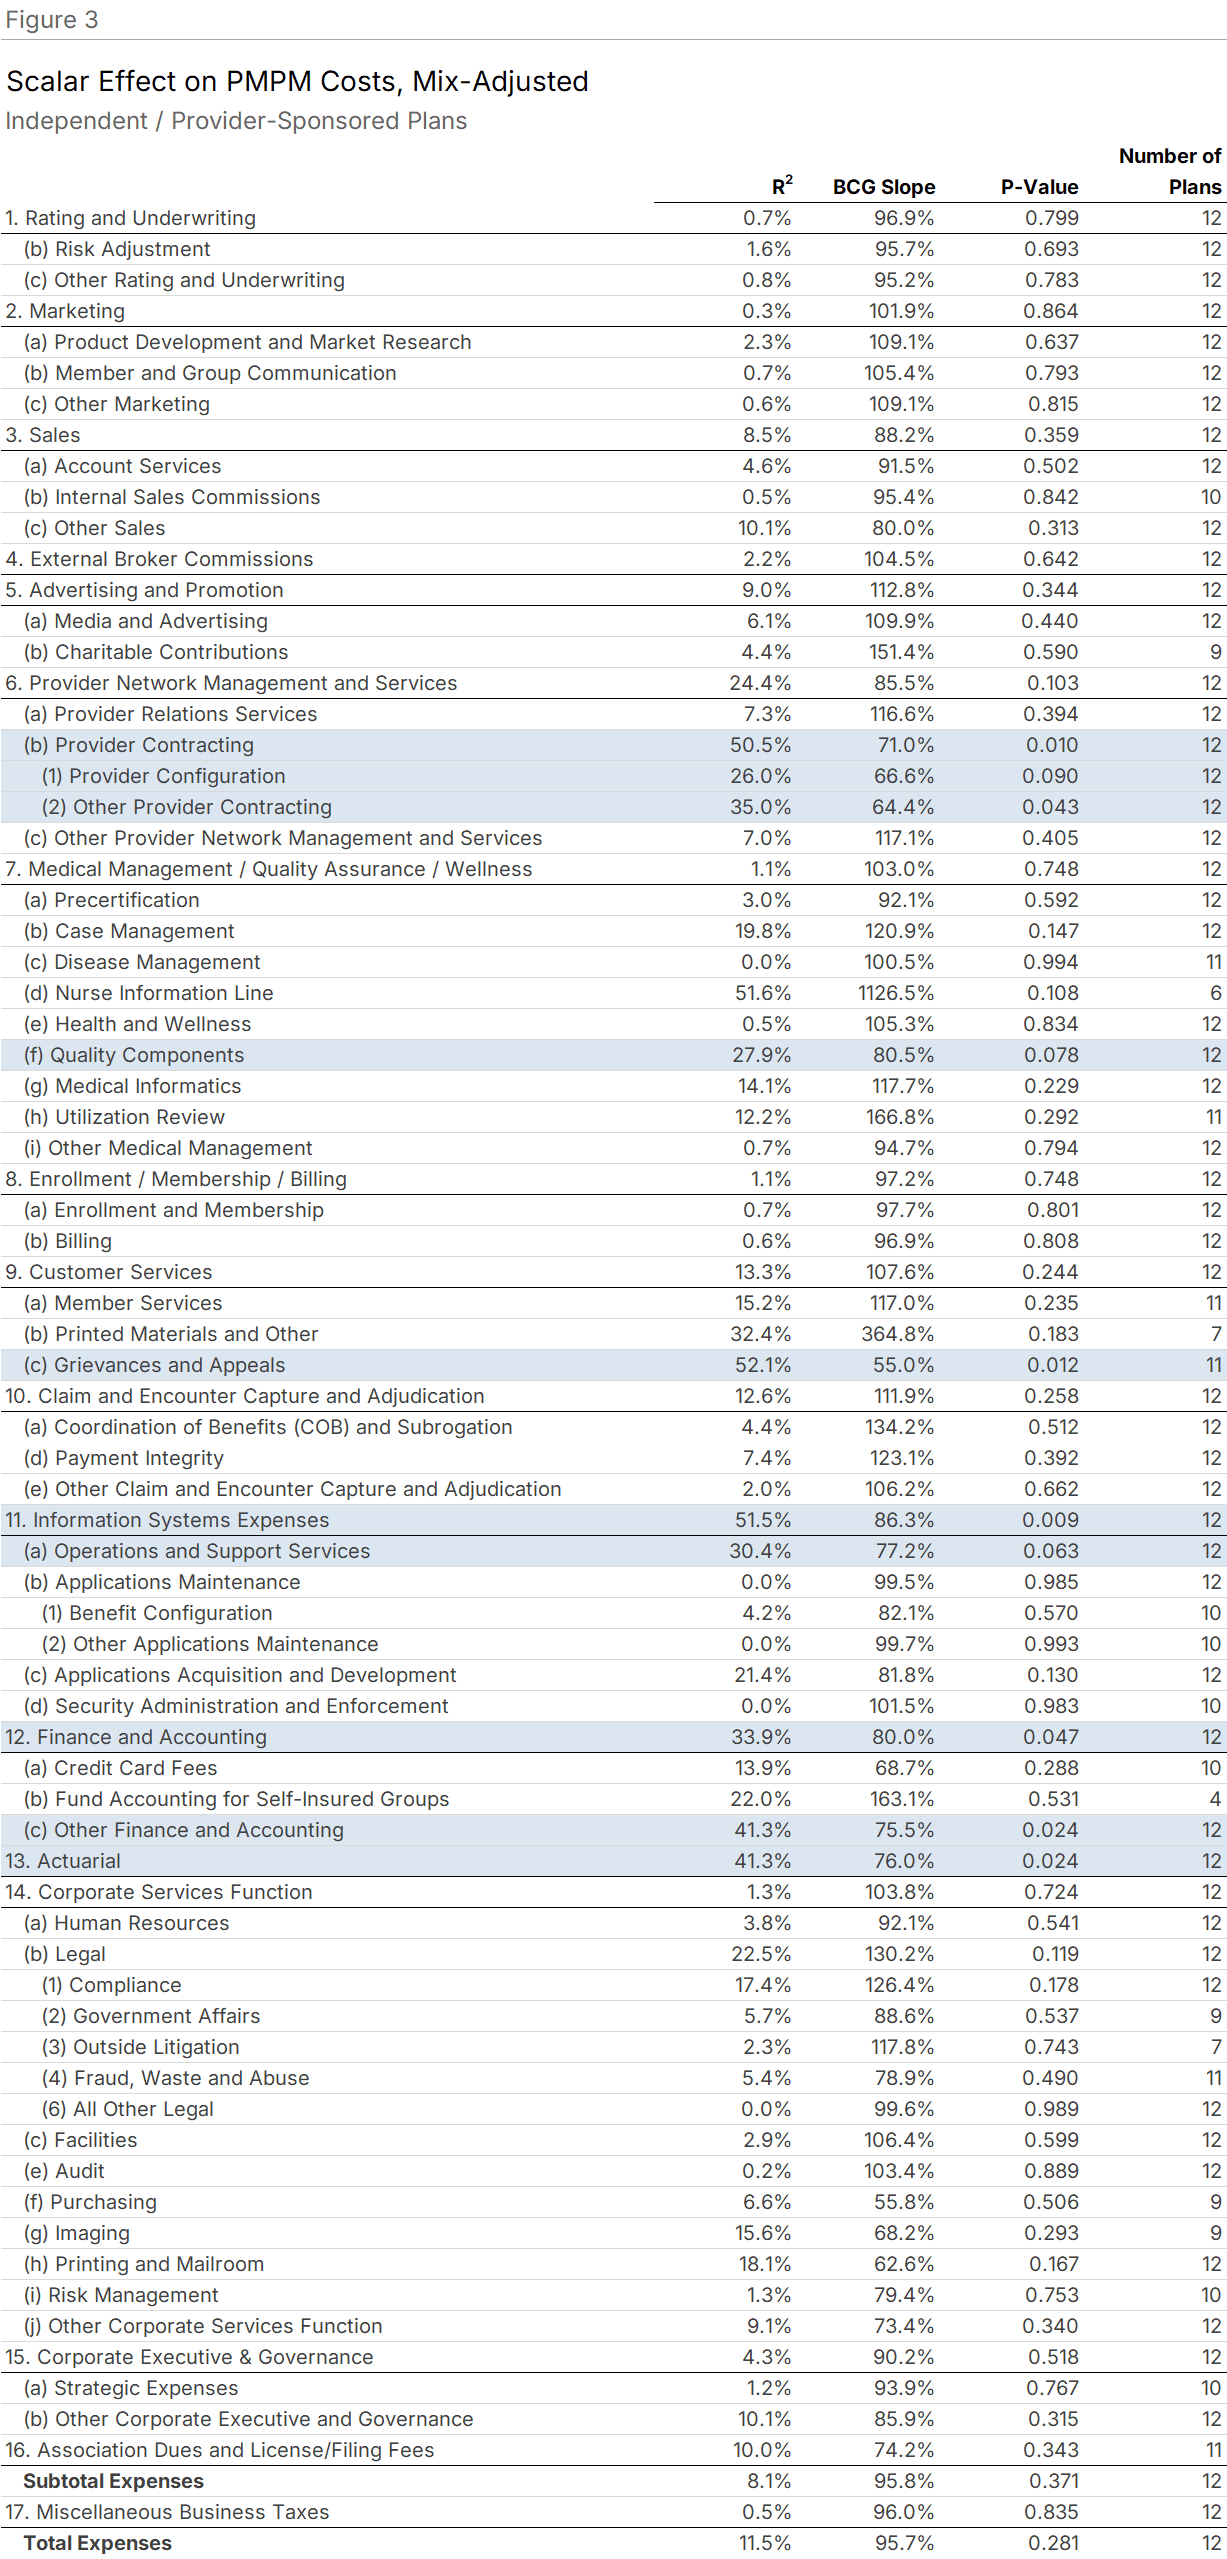
Fewer scale effects, similar slopes. Figure 3 shows results for 12 IPS plans, ranging from fewer than 100,000 to 1.4 million members.
Of administrative expenses, 30.8% are in functions exhibiting economies of scale at P<0.10. Doubling membership yields costs at 83.2% of pre-doubling values in affected functions. Subtotal expenses were not significant, with a BCG Slope of 95.8%.
Ten functions showed economies of scale, including Provider Contracting, Information Systems, Finance and Accounting, and Actuarial. No functions showed statistically significant diseconomies of scale.
Combined Universe Results
Larger sample, broader size range, similar story. Blue Cross Blue Shield Plans and IPS plans reflect different origins and operational philosophies. Blues tend to spend more on Information Systems; IPS plans, often owned by health systems, tend to spend more on Medical Management. Despite these differences, combining the universes increases sample size and the range of plan sizes.
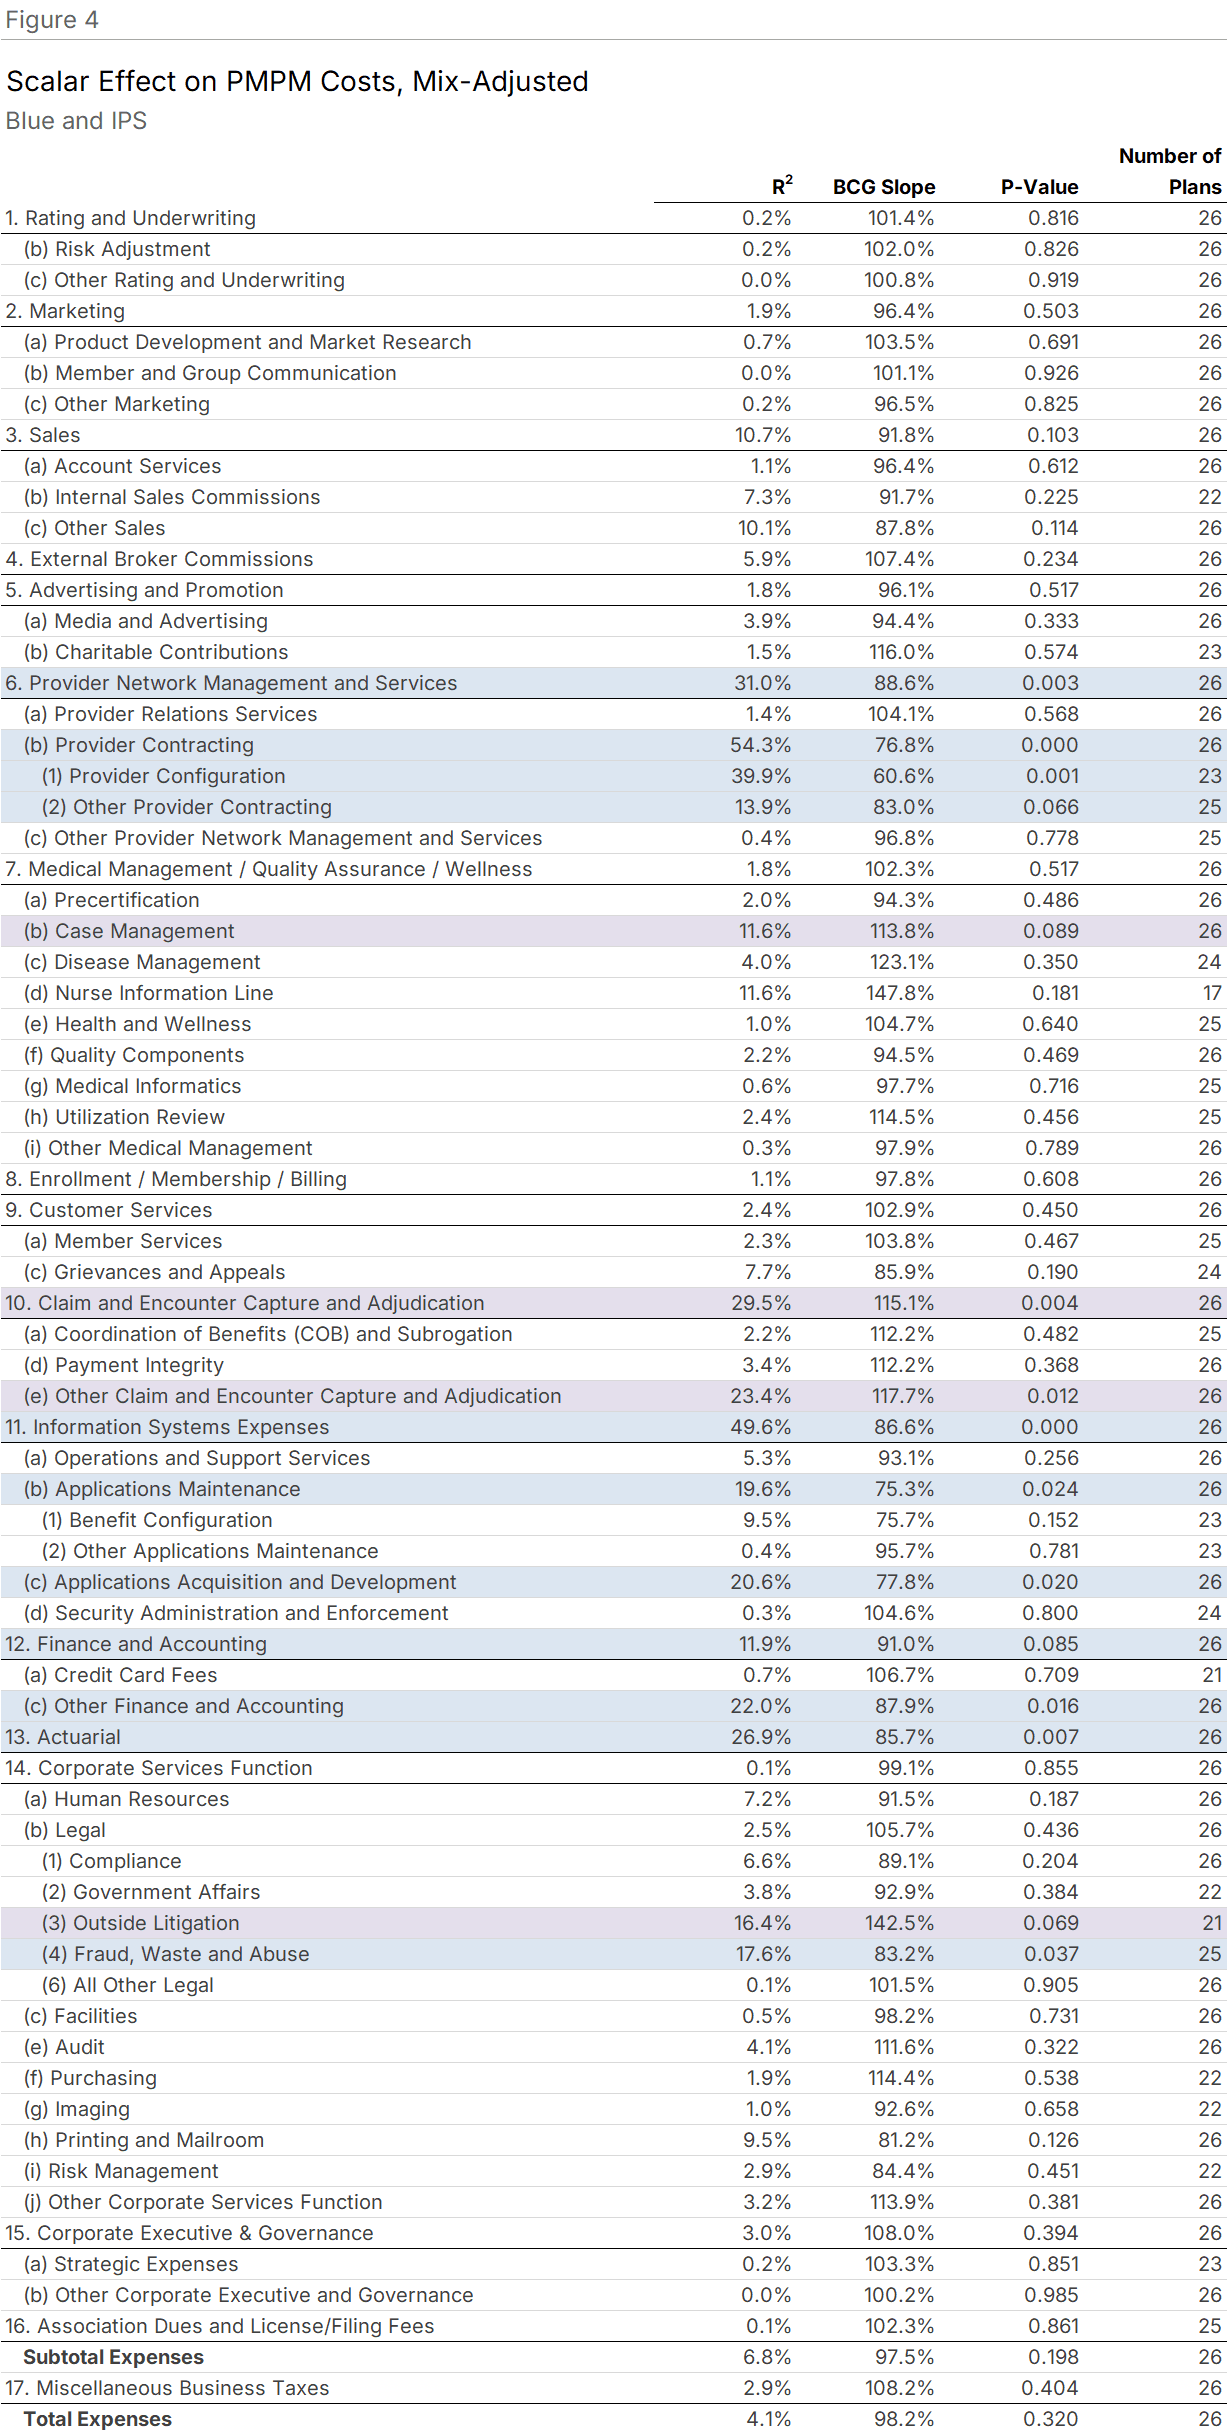
Figure 4 shows results for all 26 plans, ranging from fewer than 100,000 to over 5 million members.
Of administrative expenses, 30.7% are subject to economies of scale. Doubling plan size yields costs at 87.1% of pre-doubling values in affected functions. Eleven functions showed significant scale effects, including Provider Network Management and Services, Provider Contracting, Information Systems, Finance and Accounting, and Actuarial.
Four functions showed diseconomies of scale: Case Management, Claims, Other Claims, and Outside Litigation.
Applying the Results
Worked examples for mergers and growth scenarios. Understanding scale effects is useful when estimating costs for a growing plan, whether through organic growth or acquisition.
Doubling Through Acquisition
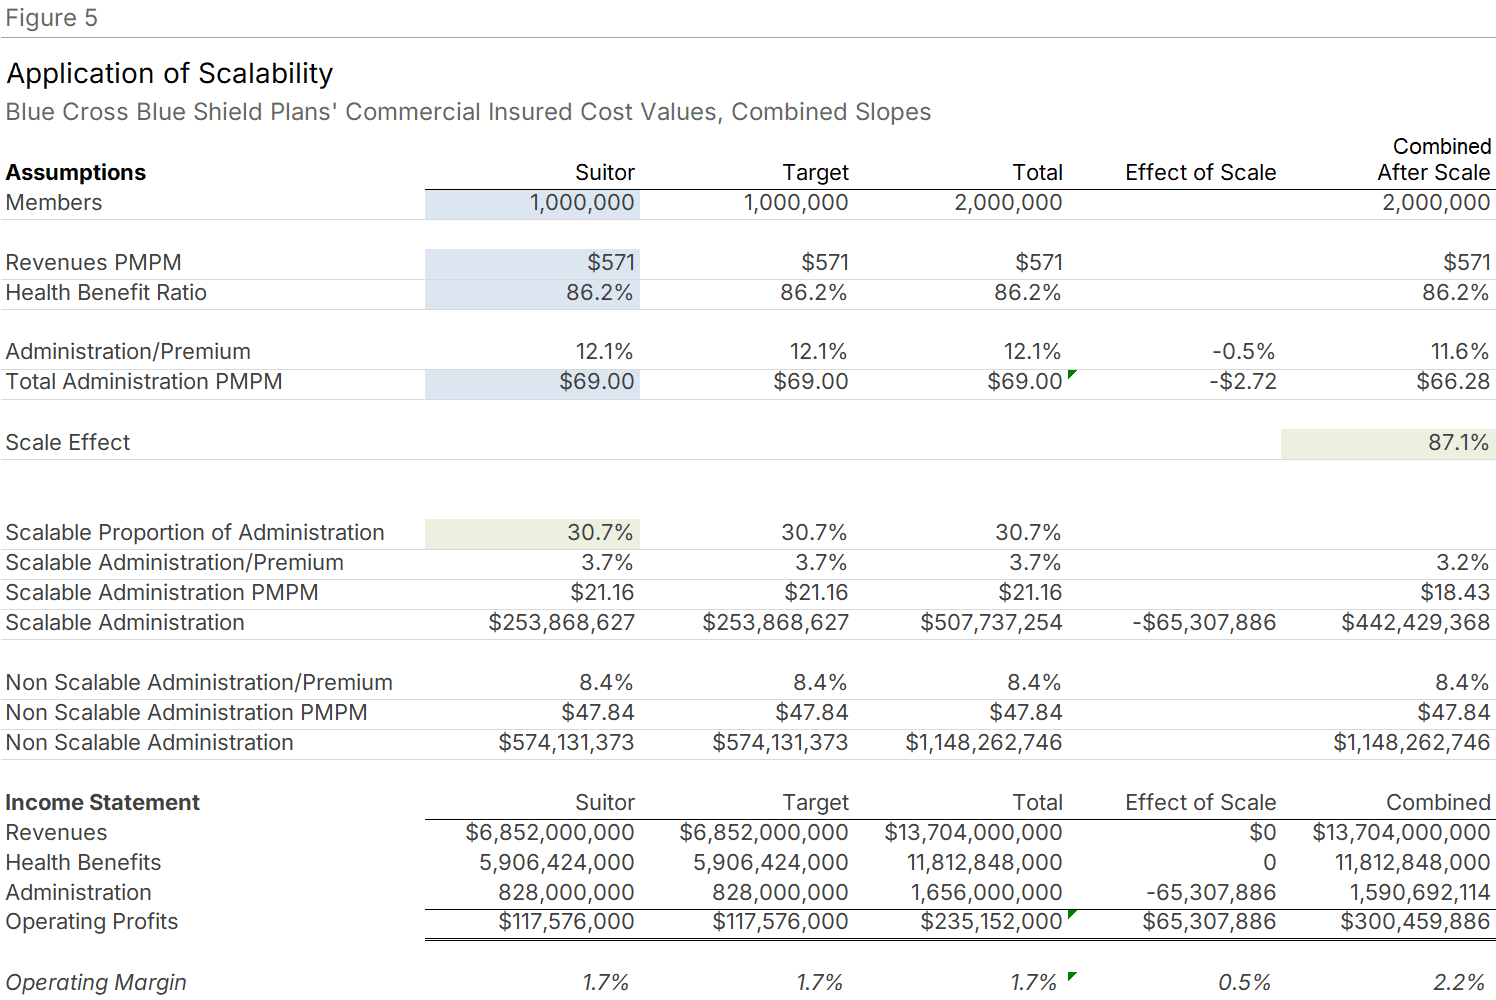
Figure 5 applies the combined universe results to a scenario where a plan exactly doubles in size through acquisition.
The inputs: 30.7% of administrative costs are subject to scale, with a BCG Slope of 87.1%. Total administrative costs are $69.00 PMPM, so $21.16 PMPM is subject to scale effects. Premium revenue is $571 PMPM (consistent with commercial insured products).
Applying the 87.1% slope to the 3.7 percentage points of premium represented by scalable expenses yields 3.2 percentage points post-doubling. The $21.16 PMPM falls to $18.43 PMPM, a savings of $2.72 PMPM.
For a combined entity of 2 million members, this equals $65 million annually on a combined administrative expense base of about $1.7 billion, a reduction of 3.9%.
While modest in the context of total costs, the earnings impact is substantial. Operating profits increase from $235 million to $300 million, a gain of 27.8%.
Acquiring a Smaller Plan
The BCG Slope describes doubling, a special case. For other growth scenarios, we convert to a marginal scale effect based on the relative sizes of the acquiring and target plans.
Figure 6 shows the calculation. If a plan increases membership by 50% (a one million member plan acquiring a 500,000 member plan), the marginal scale effect is 76.8%. The calculation steps are shown in the figure.
Incidentally, applying the marginal scale approach to the doubling scenario in Figure 5 yields the same $65 million savings, validating the method.

Figure 7 applies the 76.8% marginal scale effect to the 50% growth scenario. Multiplying 76.8% by the target's $127 million in scalable expenses yields estimated scale-related savings of $29.5 million.
The target's administrative expenses fall by 7.1%, from $414 million to $385 million. Operating profits increase by 50.1%, from $59 million to $88 million.
Once the marginal scale framework is established, it applies to any growth scenario. This provides a useful initial approximation when detailed analysis is not feasible. For greater precision, apply individual function slopes to each functional area. Due diligence will refine these estimates further, particularly where networks overlap or operational philosophies differ.

Why Scale Effects Are Limited
The nature of health plan work constrains scale benefits. Many expect health insurers to enjoy substantial scale economies, as manufacturers, transportation companies, and hospitals do. The actual effects are more modest.
Consider what health plans do. Many activities grow proportionally with membership: responding to customer inquiries, processing manual claims, handling enrollment transactions. Each new member requires the same services as existing members. Even functions that seem fixed, like Corporate Executive and Governance, tend to add support staff, increase compensation, and expand enterprise consulting as plans grow.
Technical economies of scale, such as claims auto-adjudication, can create savings but also generate offsetting costs. When auto-adjudication handles routine claims, the remaining manual claims are more complex. Adjudicating them requires higher-level staff with greater expertise and higher compensation. This dynamic appears across many automated functions.
The industry structure itself offers evidence. Health coverage organizations range from UnitedHealth, with 50 million members and nearly $350 billion in annualized revenue, to plans serving tens of thousands of members. UnitedHealth's administrative expenses appeared no lower than those of Blue Cross Blue Shield Plans in calendar 2023. (This comparison excluded product mix differences, excluded products like Stand-Alone Part D and Optum service operations, and added our estimate of UnitedHealth's medical management expenses to administration from health benefits.) The coexistence of vastly different-sized competitors in a low-margin market argues against overstating scale advantages.
Observations and Qualifications
What the data shows and doesn't show. Diseconomies of scale. Some functions showed costs increasing with size. In the Blue universe, two functions exhibited diseconomies; in the combined universe, four. We do not know the cause, but possibilities include strategic investments in growth, membership retention efforts, and challenges associated with higher market share.
Cross-sectional limitations. This study analyzes firms of various sizes at a single point in time. Each firm operates differently and in different competitive environments. Differences attributed to scale may also stem from other factors. Larger organizations may operate in service areas with competitive conditions that affect costs independently of technical and administrative economies.
Size bounds. The conclusions are most reliable within the range of plan sizes in the study. Organizations smaller than those reflected here would likely enjoy steeper cost declines as they grow, consistent with the curved nature of scale relationships when fixed and variable costs are present.
No time-series analysis. Because strategic decisions are long-term, we elected not to employ a short-duration time-series approach.
Using the Scale Calculator
Apply these findings to your own plan. The content of this study is reflected in an Economies of Scale Model on our website (Scale Calculators).
To use the model: Enter the percent difference between your current membership and your projected long-term membership. Then enter the PMPM cost for any cluster or total value. The model returns the cost after applying the scale effect.
Expense estimates may be calculated in total or by functional clusters: Sales and Marketing, Medical and Provider Management, Account and Membership Administration, and Corporate Services.
Methodology
Data Source
This analysis uses survey results from Blue Cross Blue Shield Plans and Independent/Provider-Sponsored plans also used for the 2025 Sherlock Benchmarks. All data reflects calendar year 2024 and has undergone extensive validation by both Sherlock Company and participating plans. The 26 plans collectively served 51.8 million Americans. Blue Plan membership ranged from about 347,000 to over 5 million. IPS plan membership ranged from under 100,000 to 1.4 million.
Defining Economies of Scale
Economies of scale occur when unit costs decline as output volume increases. For health plans, volume is member months. Costs are administrative expenses classified by function, with approximately 70 functions and subfunctions reported by each plan. Unit costs are PMPM.
Controlling for Product Mix
Product mix differences complicate any scale analysis. Administering a comprehensive product for seniors costs more than one for working-age members, as administrative activities correlate with underlying health needs. To address this, each plan reports function costs segmented by product (Medicare Advantage, Commercial Insured, etc.). We reweight each plan's PMPM costs to eliminate product mix effects. Comparisons express each plan's expenses as differences from universe mean values, after reweighting by the plan's own product mix. Values above 100% indicate higher-than-average costs; below 100%, lower.
Regression Approach
We measured economies of scale by regressing costs in each function against member months. Technical and administrative economies of scale imply fixed and variable cost components, producing a curved relationship. For ease of interpretation, we converted to a linear form by regressing natural logs of percent differences from mean values against natural logs of member months.
Statistical Thresholds
A relationship is considered significant at P<0.10. A P-value of 0.10 means: assuming no actual scale relationship exists, you would observe the measured difference in 10% of similar studies due to random sampling error. Lower P-values indicate more reliable results.
BCG Slope
The BCG Slope expresses scale intuitively as the percent of pre-doubling costs remaining after membership doubles. It is calculated as 2 raised to the power of the regression slope.
R-Squared
R² describes how much of the variation in costs is explained by scale. It is unusual for R² to exceed 50% in these regressions. Scale is an important factor where we identify significance, but other factors also explain cost differences between plans, including information system investment cycles and operational choices.
Note: We are indebted to the Boston Consulting Group for introducing the BCG Slope and technical aspects of estimating economies of scale. We are also grateful to Stephen R. Niezgoda, Professor in the departments of Materials Science & Engineering and Mechanical & Aerospace Engineering at The Ohio State University, for his review of our approach and insights on the underlying premises. All errors are the responsibility of Sherlock Company.