
The Analysis
Health plans with higher Medicare risk adjustment expenses also tend to report higher Medicare premium revenue, higher health care costs, and more chart reviews.1 Together, these relationships suggest that risk adjustment spending is concentrated in plans with greater medical complexity and higher coding intensity. While the analysis does not directly measure causal return on investment, the premium relationship is consistent with risk adjustment's role in helping payments better reflect member acuity. We also analyzed Medicaid and Individual coverage for the same trends but found weaker correlations.
These risk adjustment expenses involve analyzing clinical data to align revenue compensation with the risk factors of a plan's membership. There are three market segments that apply:
Medicare Advantage. Essential activities include assigning CMS-HCCs to members, conducting chart reviews, and managing audit-related expenses to verify that submitted diagnosis codes are fully supported by medical records.
ACA commercial coverage. Risk adjustment applies to the individual and small-group markets. The program transfers funds from plans with relatively lower-risk enrollees to plans with relatively higher-risk enrollees using a state transfer formula based on enrollee actuarial risk and related factors, with the goal of stabilizing premiums and reducing selection bias.
Medicaid managed care. These expenses stem from activities that support state-specific payment methodologies designed to reflect the health status of enrolled members. Unlike Medicare Advantage, Medicaid risk adjustment is not a single national model: states and their actuaries may apply prospective or retrospective risk adjustment in setting capitation rates, using generally accepted models in a budget-neutral manner. As a result, the scope and intensity of plan activity can vary materially by state.
Premium Impacts
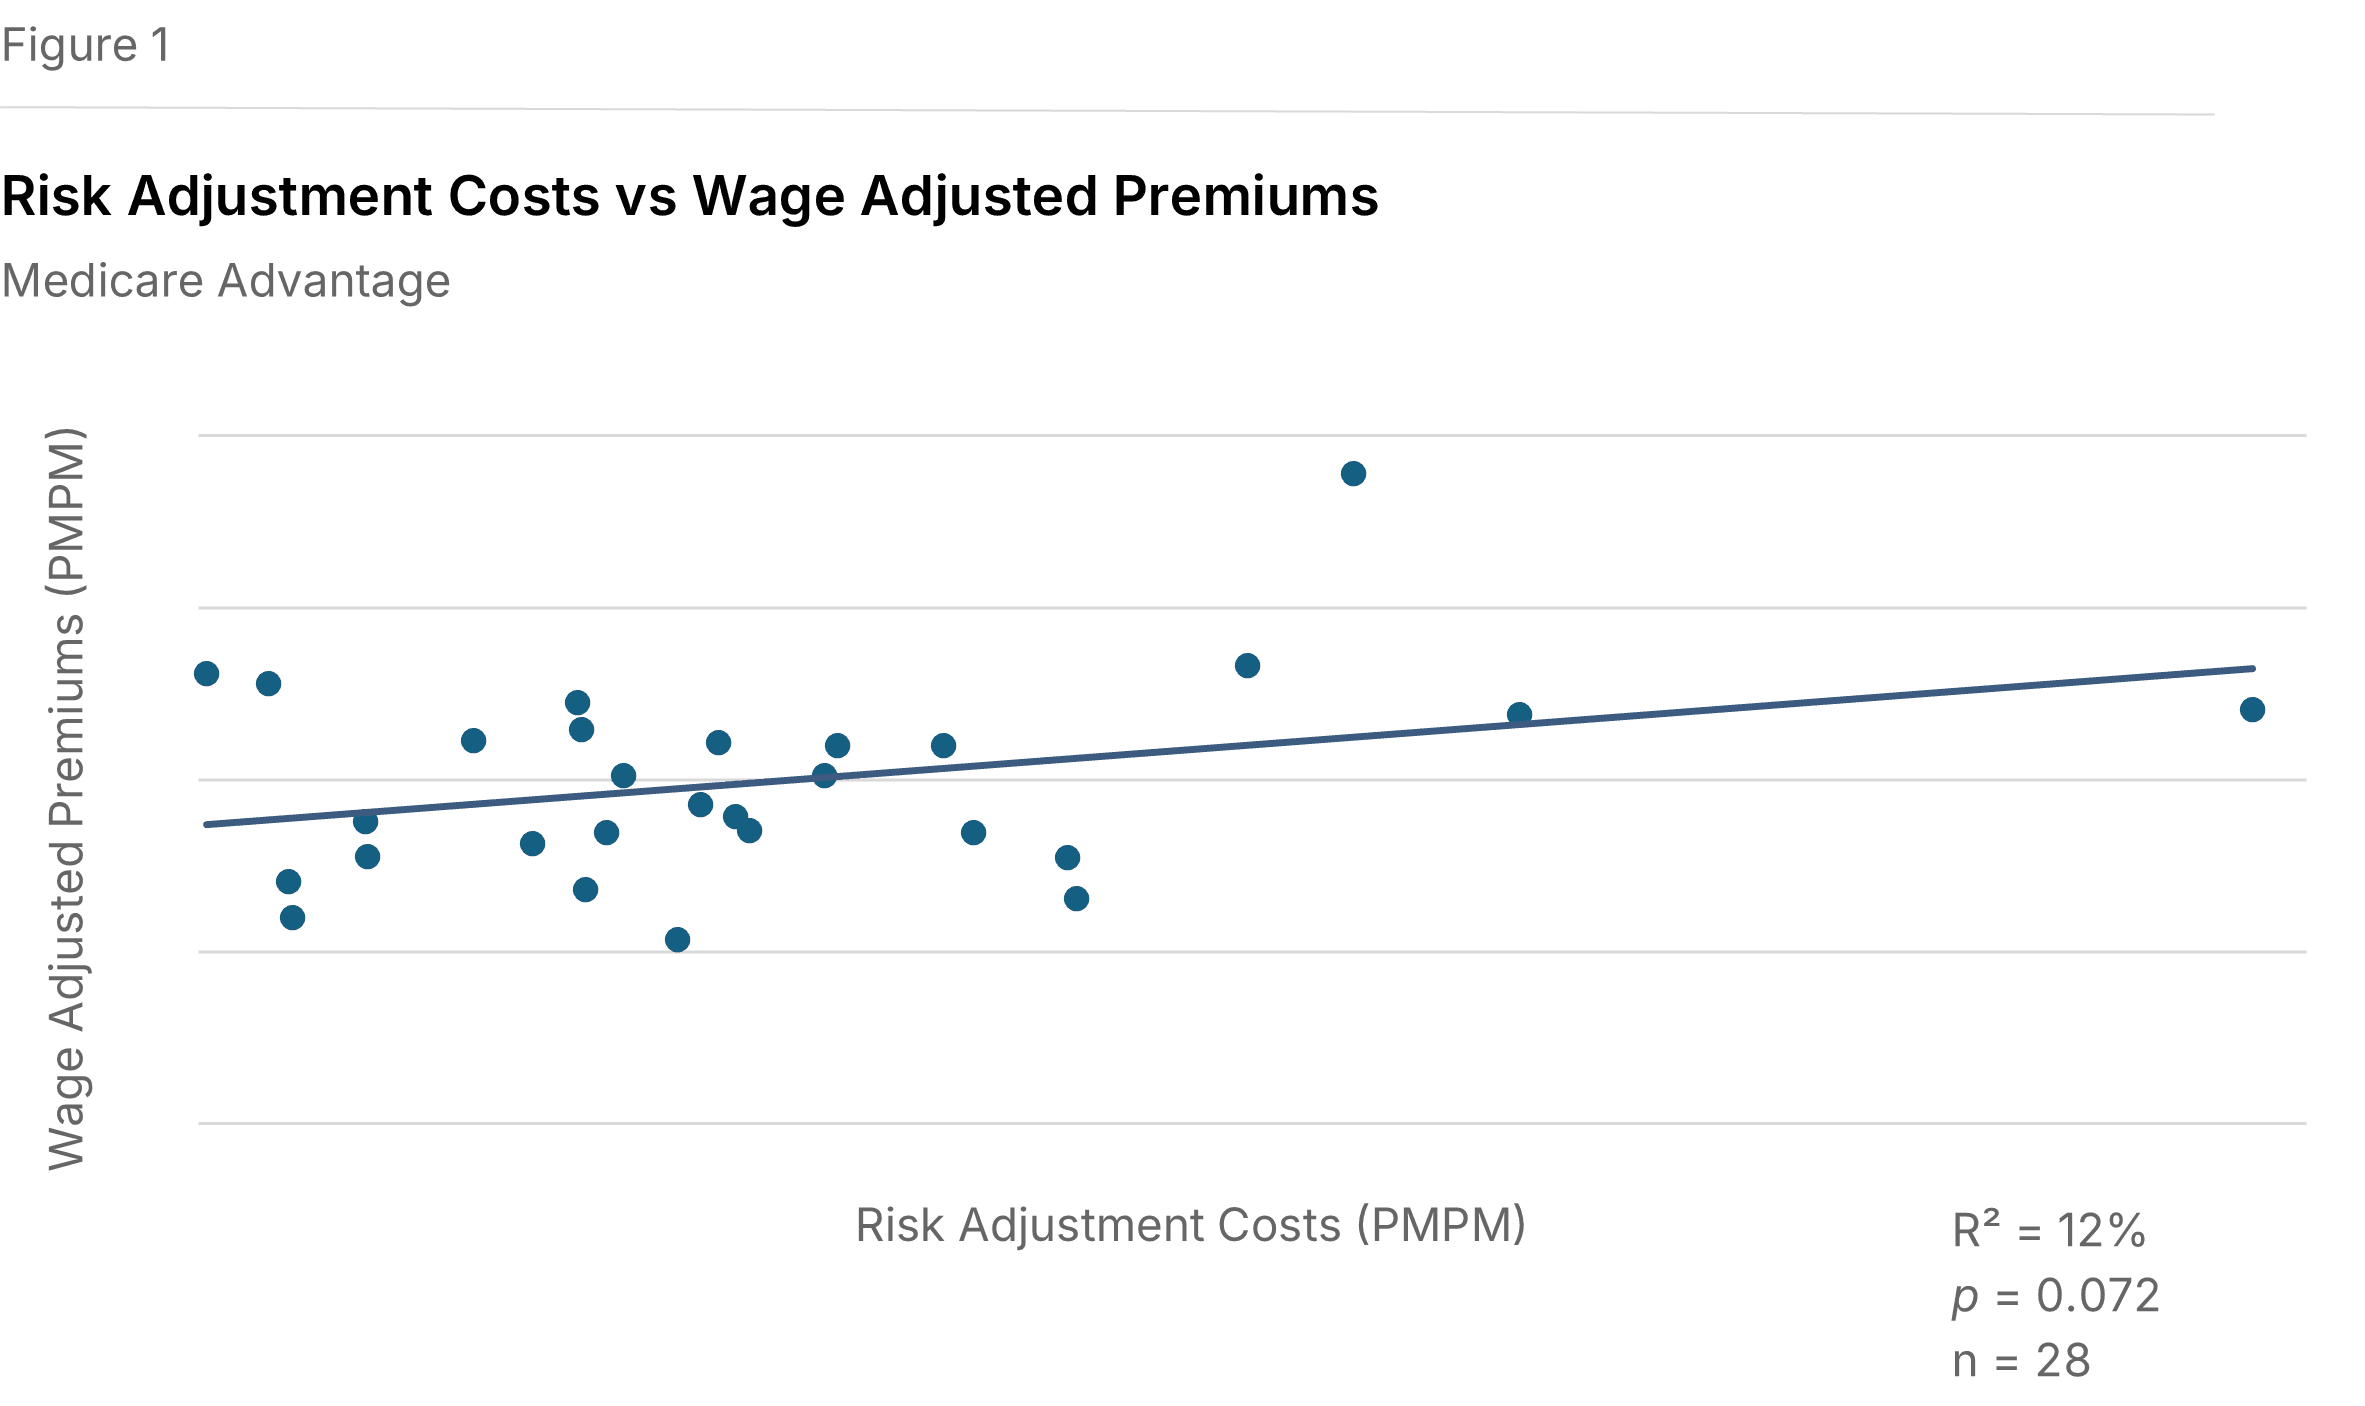
Higher spending is associated with higher premiums. Figure 1 illustrates a positive relationship between Medicare risk adjustment expenses per member per month (PMPM) and wage-adjusted Medicare premiums PMPM. The wage adjustment reduces the cost-of-living effect of geographic differences by dividing each plan's premium PMPM by its relative hospital wage index. The data shows a positive slope that meets our study threshold for statistical significance (P=0.072, R²=12%), indicating that plans with higher risk adjustment spending also tend to have higher wage-adjusted Medicare premiums.
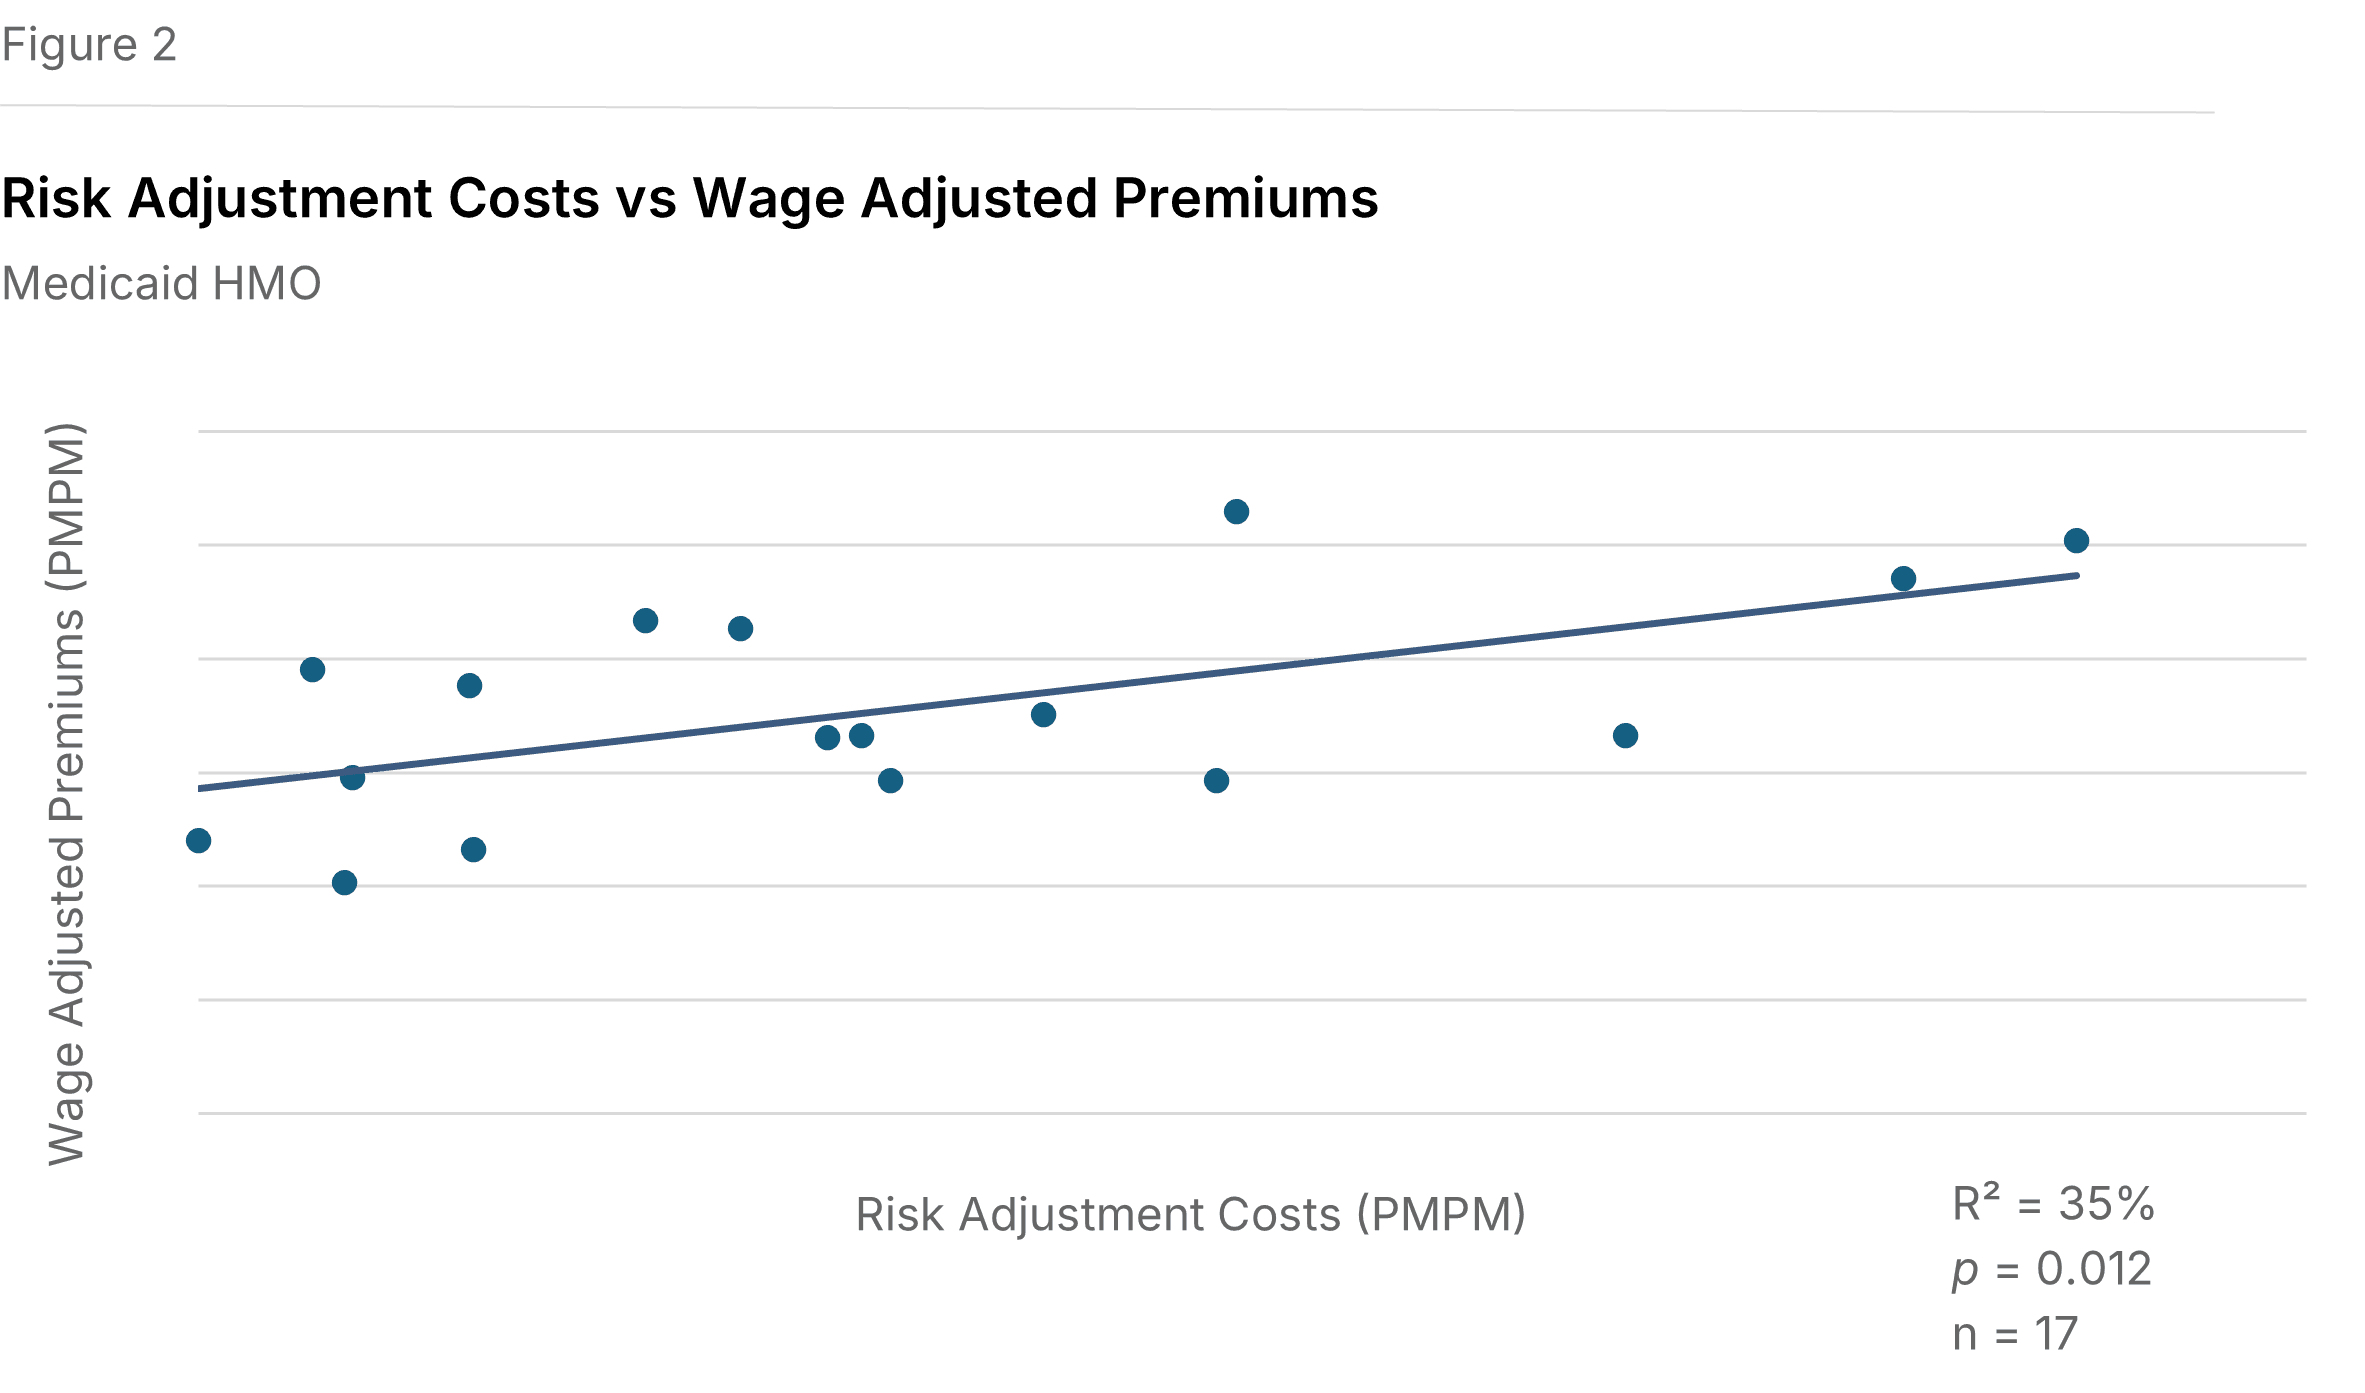
Medicaid premiums show similar gains. As shown in Figure 2, a comparable positive slope exists between Medicaid risk adjustment expenses and wage-adjusted Medicaid premiums (P=0.082, R²=19%).
Individual premiums do not follow the trend. Analyzing relationships between Individual market risk-adjustment expenses and premiums, both as-reported and adjusted for cost-of-living, returned no significant correlations.
Health Care Costs
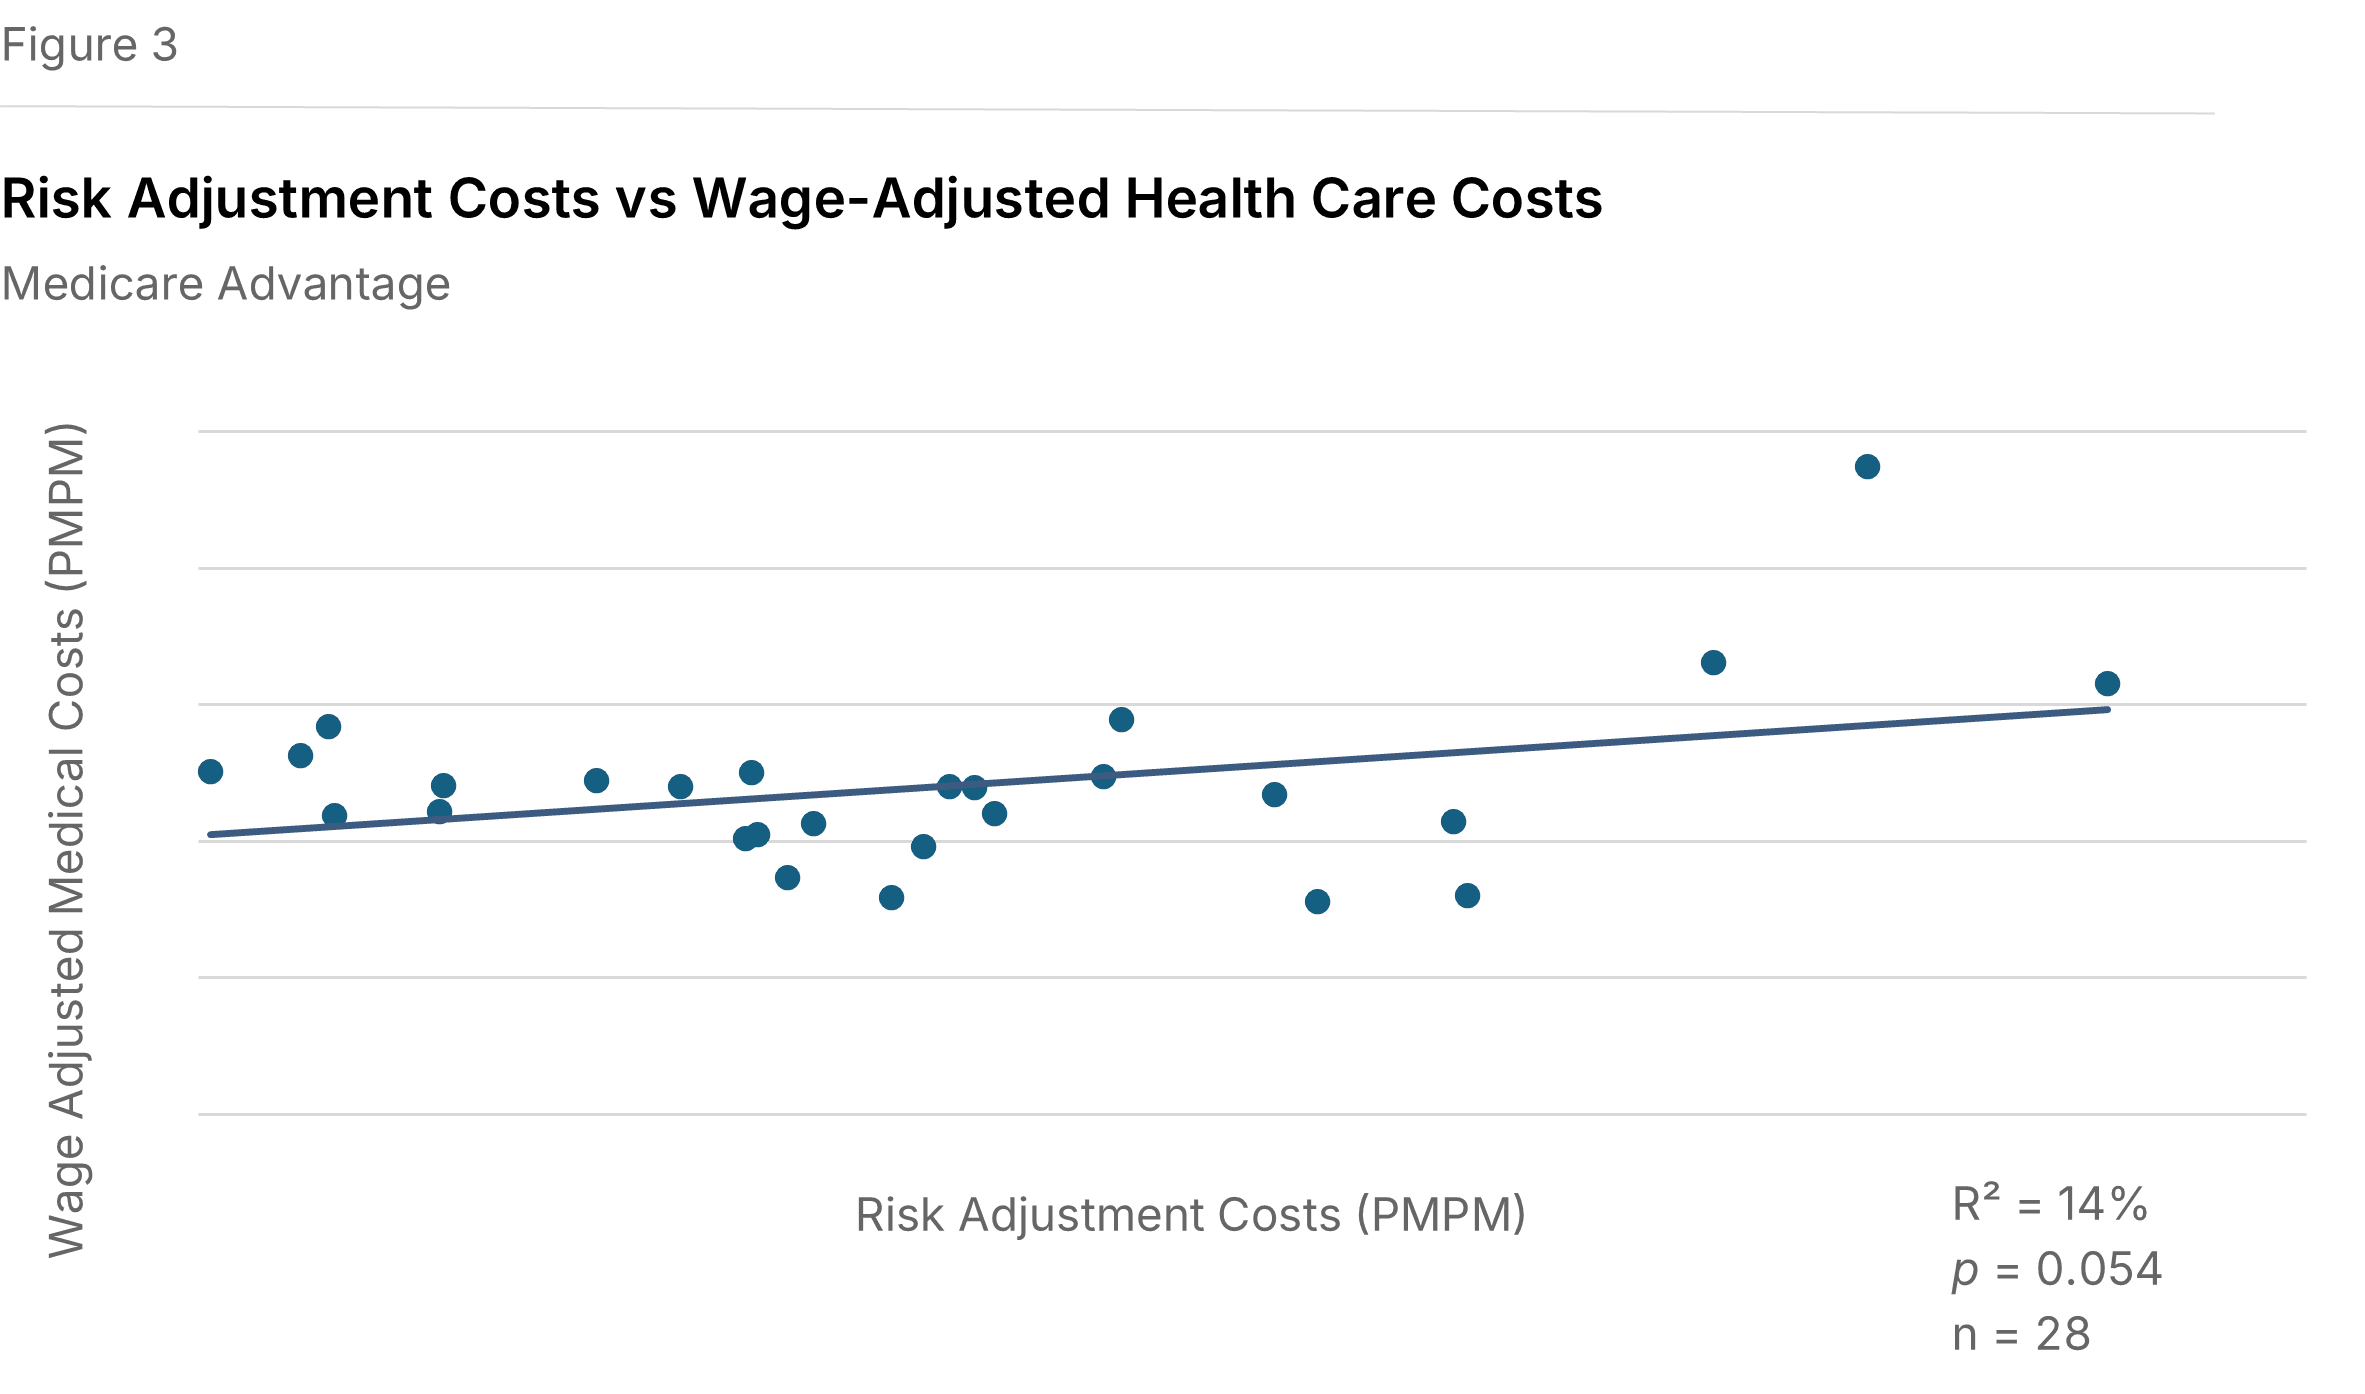
Risk adjustment expenses tend to be higher where Medicare health care costs are higher. Figure 3 displays a positive relationship between Medicare risk adjustment expenses and wage-adjusted Medicare health care costs (P=0.054, R²=14%). This suggests that risk adjustment activity is more intensive in plans with higher medical costs, consistent with the role of risk adjustment in documenting member acuity. A similar relationship appears when Medicare health care costs are examined without wage adjustment (P=0.060, R²=13%).
Medicaid costs don't mirror the Medicare relationship. No statistically significant relationship was found between Medicaid risk adjustment expenses and Medicaid health care costs per member, including after wage-adjusting (P=0.34, R²=5%). This may reflect the structural differences in Medicaid risk adjustment, where state-by-state variation in models, lower per-member dollars, and higher member turnover make it harder for plans to mount the same systematic coding response to rising costs seen in Medicare.
Individual costs do not follow the trend. Similar to premiums, the analysis of relationships between Individual market risk-adjustment expenses and health care costs returned no significant correlations.
Operational Drivers
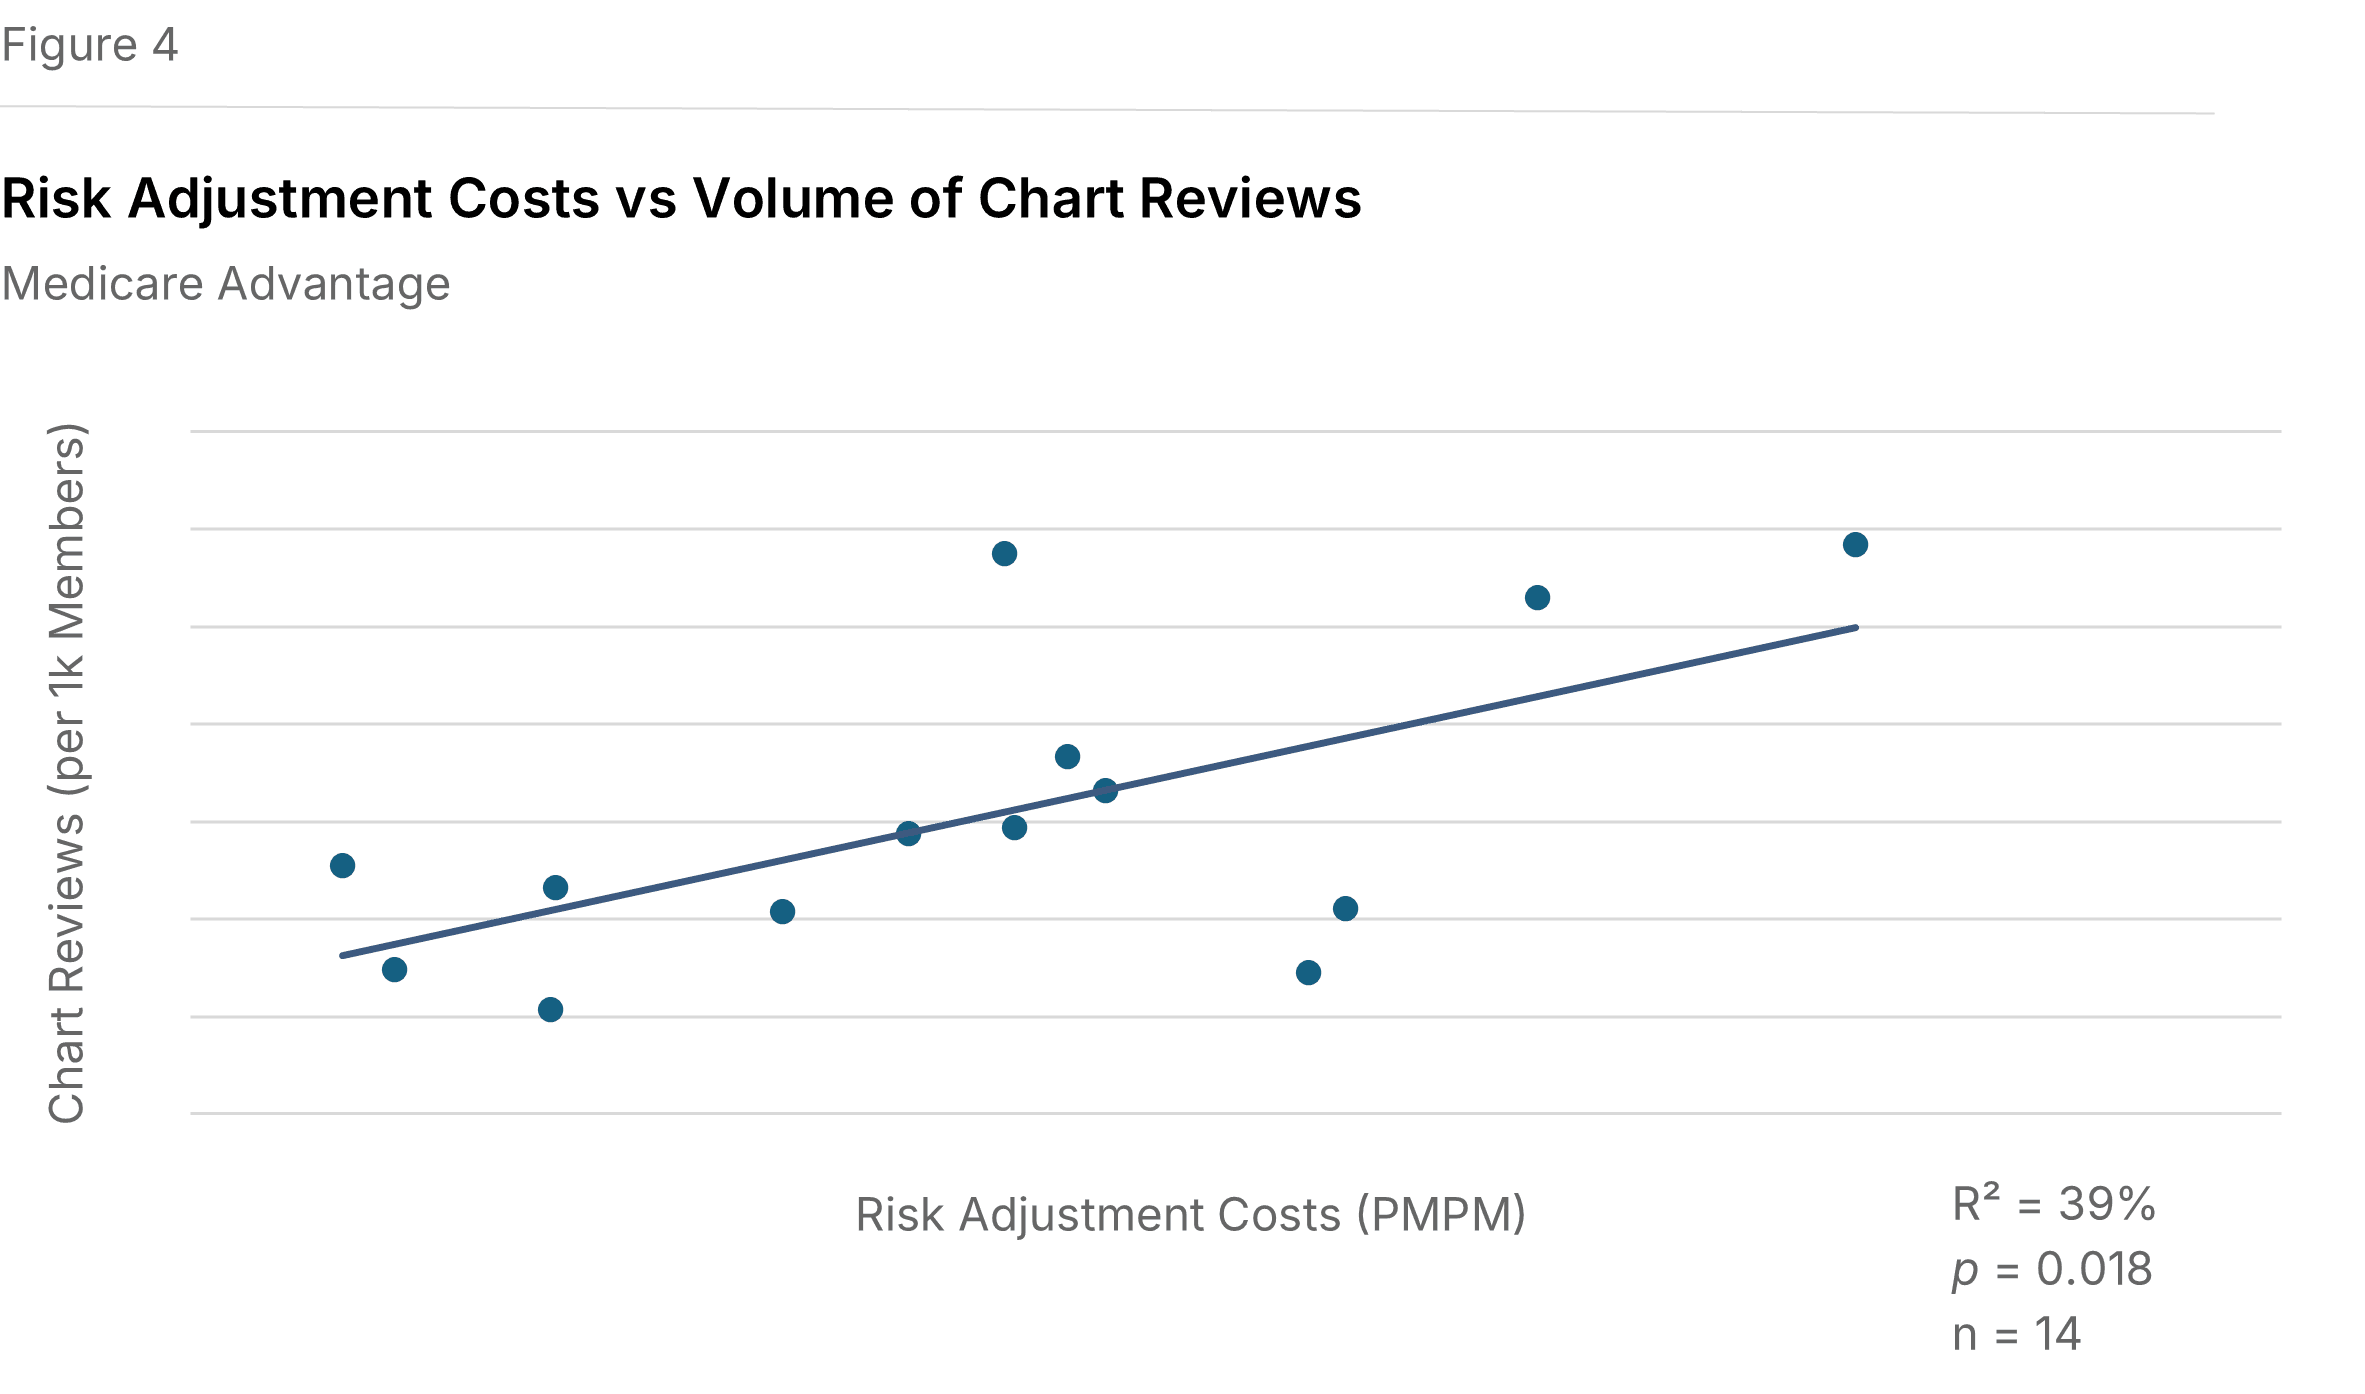
More chart reviews are associated with higher Medicare risk adjustment expenses. Figure 4 shows a positive relationship between Medicare risk adjustment expenses PMPM and the number of chart reviews conducted per 1,000 Medicare members (P=0.018, R²=39%). In this context, a chart review involves auditing provider documentation and clinical notes to support accurate coding for enrollee risk scores. A chart is defined as a medical record for one member, for one provider or location, during one year. A location refers to a common electronic medical record system.
We did not see a similar correlation for Commercial chart reviews. There was also insufficient data to evaluate Medicaid chart reviews.
Implications for Health Plans
Health plans face ongoing requirements to align revenue with the health risk of their enrolled populations. In Medicare, risk adjustment expenditures show measurable relationships with premiums, health care costs, and chart review activity, suggesting that these functions are concentrated where both member complexity and documentation effort are greater. Investments in chart reviews, coding support, and related verification activities remain important tools for helping payments better reflect the risk profile of enrolled members.
Methodology
We utilized data from the 2025 edition of the Sherlock Benchmarks, which reflects health plan results from the year ended 2024. These benchmarks segment administrative costs into nearly 70 functional areas, enabling the specific identification of risk adjustment costs exclusively for Medicare Advantage. Twenty-eight plans provided cost information on these expenses, and 14 of those plans supplied specific volumes of chart reviews.
We consider relationships to be statistically significant using a P-value threshold of 10% or less, which measures the chance that the regression line results from unrepresentative data. We also report the R², or coefficient of determination, to describe the degree to which the regression line explains the differences between various values. It is important to note that an R² value indicates that other factors outside of risk adjustment spending also inherently influence premiums and health care costs. These results should be interpreted as correlational rather than causal, and the reported relationships do not imply that risk adjustment spending alone determines premiums or health care costs.
1"Premiums" here and throughout this analysis refers to total Medicare revenue reported to Sherlock Company. It includes both amounts received from CMS and member contributions. We did not analyze the effect of risk adjustment on the amount members are responsible for paying, but plans with higher CMS payments tend to reduce member contributions.