
Conclusions
- Administrative expense growth in 2025, at 0.3% excluding mix differences, was the lowest since the effects of Covid adaptation in 2021 and is otherwise the lowest since 2015. Growth was 0.5% without excluding the effect of a product mix shift in favor of Medicare Advantage. The 2024 growth rates were 5.6% holding mix constant and 6.6% as reported.
- Growth in costs for the cluster of Account and Membership Administration was the slowest growth since 2016. In 2025, this cluster's costs increased by 1.1%, 1.7% including the effect of the increased MA mix. The prior year's growth rates were 4.2% holding mix constant and 4.7% as reported.
- Cost growth declines between 2025 and 2024 were broadly evident. With the exception of the Corporate Services Cluster, all clusters' growth rates were lower, regardless of whether trends were as reported or excluding the effect of mix differences.
- At 8.1% of premium equivalents, health plan administrative costs are the lowest in the past 20 years.
- Declines in Advertising and Promotion and Corporate Executive and Governance were especially important in overall 2025 growth trends. Other cost declines were Marketing and Sales. Other functions displaying a sharp decline in growth were External Broker Commissions, Medical Management, Enrollment, Claim and Encounter Capture and Adjudication and Information Systems expenses.
- A few functions increased growth rates in 2025: Rating and Underwriting, Finance and Accounting, Actuarial and the Corporate Services Function.
- Factors impacting the change in administrative costs were a slight decline in staffing ratios, an increase in compensation likely affected by a shift towards more expensive employees and a decline in non-labor costs.
Trends are based on the results of 10 continuously participating Plans (of 12 total) in the Sherlock Benchmarks. The source of the data used in this analysis is Sherlock Company surveys of twelve Blue Cross Blue Shield Plans. They collectively serve 41.2 million members with Comprehensive products, approximately 57% of all Blue members not served by public Blue companies. Participating Plans also served 9.5 million people through "Host" relationships with other Plans, plus 8.3 million people through stand-alone dental products.
Long-Term Trends
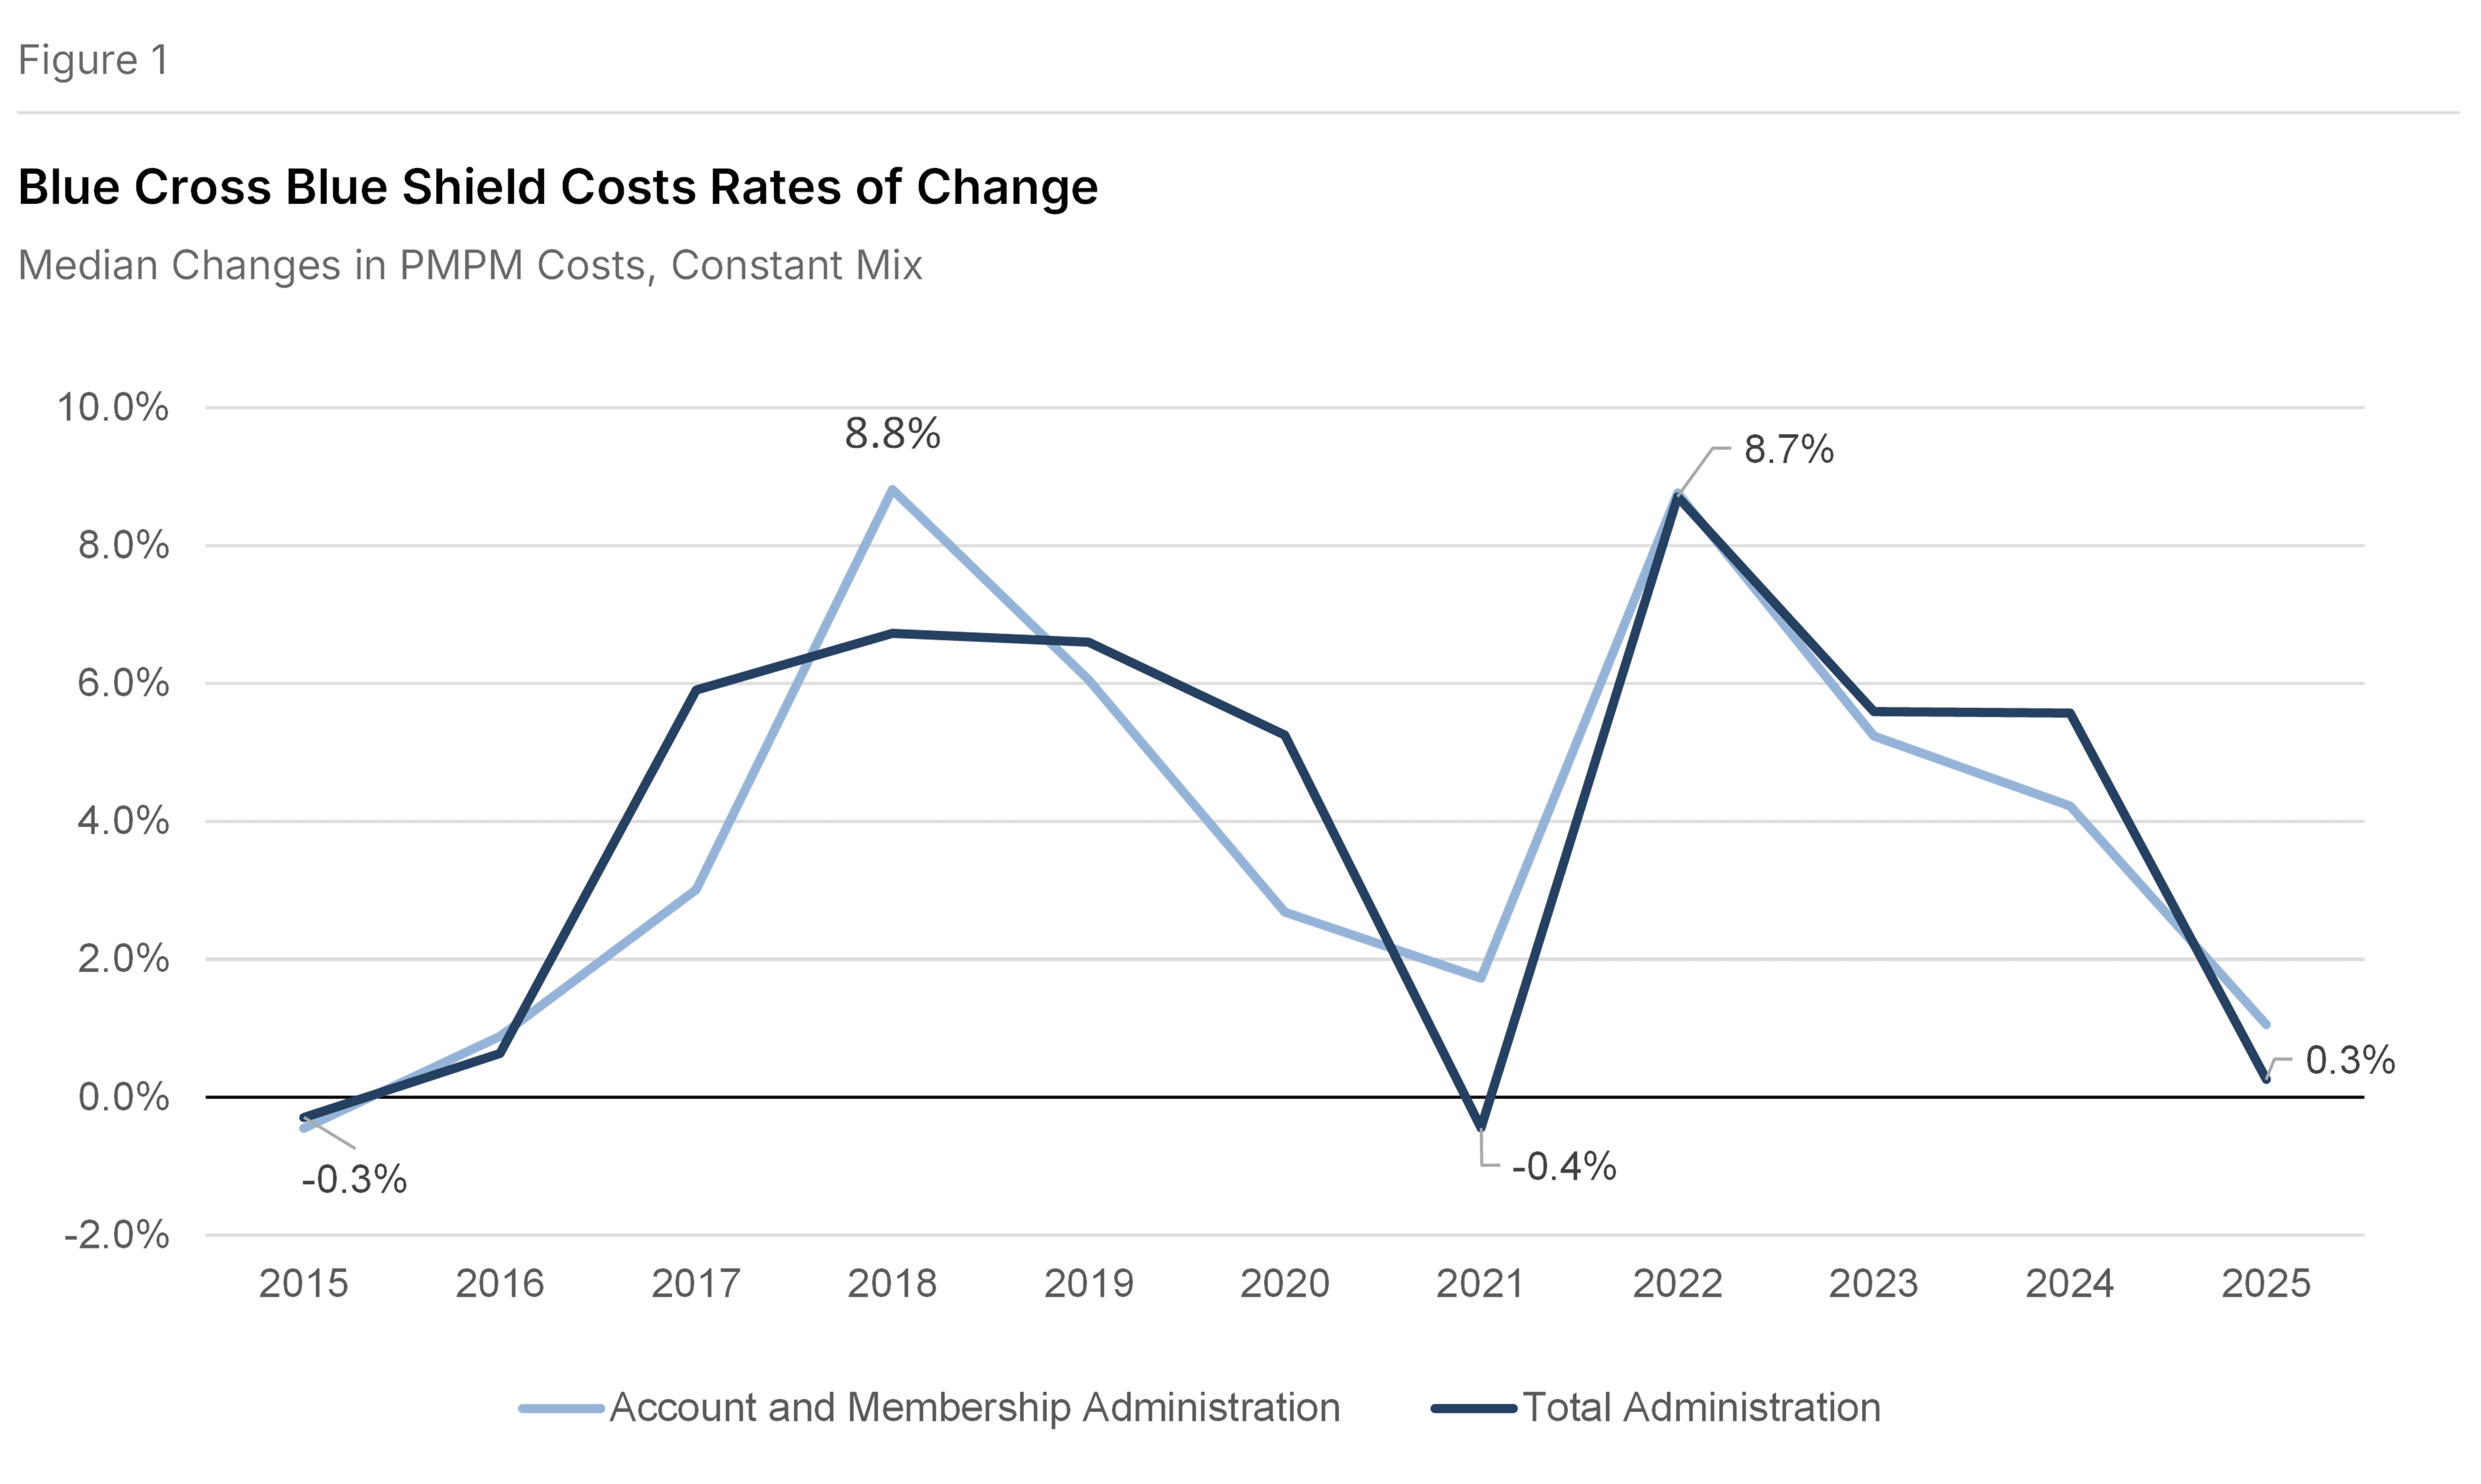
Figure 1 shows the constant mix increase in PMPM costs of 0.3% in 2025 was sharply lower than in 2024, calculated after having eliminated the effects of product mix differences between every two comparison years. It was the slowest rate of growth in the past 10 years with the exception of 2021 (a decline of 0.4%), which was affected by Covid 19 adaptation. Account and Membership Administration PMPM grew by 1.1%, the slowest growth in the past 10 years.
Trends and Product Mix Changes
Figure 2 also shows median year-over-year trends in Total administrative expenses and in each cluster of expense. In all cases, trends are shown solely from continuously participating Plans, and all trends are of costs per member per month. The "as reported" values are trends in PMPM costs. "Constant mix" values are also trends in costs but, in calculating growth, prior year product costs are reweighted to match this year's product mix. We consider constant mix growth to be a more reliable way of looking at expense trends.
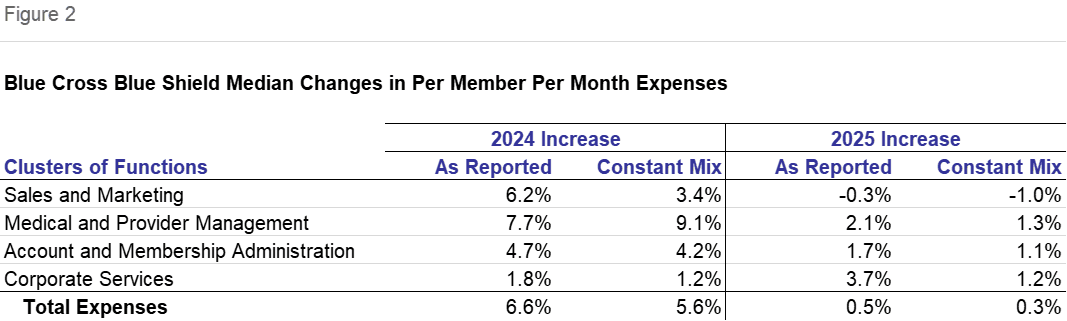
On a constant mix basis, PMPM expenses increased by 0.3% compared with an increase of 5.6% in 2024. Every cluster of expenses declined with the exception of Corporate Services, which had exactly the same PMPM growth of 1.2% in both periods. The greatest percentage point decline was Medical and Provider Management: the increase of 1.3% was 7.8 percentage points lower than 2024. This was followed by a 4.4 percentage point decline in Sales and Marketing to a per member decline of 1.0%. Account and Membership Administration grew by 1.1%, a 3.2 percentage point reduction in growth.
On an as-reported basis, the PMPM expense growth was slightly higher, at 0.5%, though well below 2024. With the exception of the 3.7% increase in Corporate Services, up 1.9 percentage points, all other clusters' growth declined compared with the prior year. Sales and Marketing growth declined by 6.5 percentage points to negative 0.3%. Medical and Provider Management's 2.1% increase was 5.6 percentage points lower than last year. Account and Membership Administration expenses increased by 1.7% from last year, a 3.0 percentage point reduction in growth.
Cost Trends Holding Product Mix Constant
In our view, trends that include the same Plans in both comparison years and exclude mix changes are a more accurate representation of real trends in administrative costs. So the trend discussion in this Navigator is largely based on this approach.
Account and Membership Administration
This cluster comprises 44% of total administrative expenses, and the median rate of increase was 1.1%. All four functions in this area, Enrollment, Customer Services, Claims and Information Systems declined in their rate of growth. Customer Services expenses had the greatest percentage point change in median increases and the median was an actual decline. Its mean change was an increase. Member Services itself increased only modestly but Grievance and Appeals growth was strong and broad-based. Customer Services had a 5.0% decrease in Staffing Ratio and an 8.2% increase in Staffing Costs per FTE. Outsourcing declined 0.5 percentage points.
The most important source of increase on a constant mix basis was Claim and Encounter Capture and Adjudication, though its growth was the second lowest in the past five years. While Payment Integrity, BlueCard Home and Custom Par Fees, and Other Claims increased, COB and Subrogation declined.
Information Systems expenses were the next largest contributor to this cluster's growth. Its growth was slowest since 2021. Operations and Support and Security Administration and Enforcement grew as Application Maintenance and Applications Acquisition and Development declined. Within this subfunction, Pre-Planning Project costs were sharply lower. The staffing ratio decreased by 1.4% as compensation increased by 6.0%. Outsourcing increased by 0.5 percentage points.
Enrollment cost growth matched that of 2021 for this function's lowest rate of increase in the past five years. Its growth was slightly faster than that of Information Systems.
Slightly amplifying this cluster's trend is the change in Pharmacy and Behavioral Health administrative costs. Without the effects of Pharmacy and Behavioral Health administrative costs, expenses would have increased by 1.5%, compared with 1.1% when they are included.
The effect on Total costs was directionally similar, though more muted. Without the effect of the trend in Rx and Behavioral Health administration, growth would have been 0.4% rather than the 0.3% shown in Figure 2.
Medical and Provider Management
This cluster has two functions, Provider Network Management and Services, and Medical Management / Quality Assurance / Wellness. The median PMPM change in this cluster was 1.3% on a constant mix basis.
Both functions increased. The larger Medical Management function was the key source of trend. Overall, it increased less than Provider Network. Subfunctions with notable growth included Case Management and Medical Informatics. By contrast, Nurse Information Line, Health and Wellness and Quality Components declined. Outsourced FTEs increased as a share of the total by 1.4 percentage points. Staffing ratios declined by 4.7%. Compensation in this function increased sharply.
Provider Network Management and Services grew by 0.8% PMPM when mix is held constant. Overall, growth was more rapid than for Medical Management. Provider Relations Services declined as Provider Contracting increased. Compensation increased strongly, as staffing growth was modest.
Corporate Services Cluster
This cluster increased modestly, at the same pace as 2024, 1.2% PMPM. It also contributed least to growth. Finance and Accounting increased at a high-single digit pace. Where Credit Card fee trends were mixed, Other Finance and Accounting costs were higher than the overall trend on higher staffing and compensation. Actuarial enjoyed low double-digit growth for the same reasons.
The Corporate Services function increased faster than its cluster: high growing areas included Legal, with activities of Government Affairs, Outside Litigation and Independent Dispute Resolution Fees especially prominent. OPEB also sharply increased. Risk Management growth was also high. Audit growth was higher than most functions. Facilities and Printing and Mailroom posted per member declines.
While varying between the Plans, Corporate Executive appears to have been the key determinant of cluster changes: the median decline in costs was sharp. Both Strategic Expenses and Other Corporate Executive and Governance grew but variability between the subfunctions of the Plans led to a median decline. Association Dues and License / Filing Fees increased more than most functions. Miscellaneous Business Taxes were more or less unchanged, PMPM.
Sales and Marketing
This cluster declined in its PMPM costs, by 1.0%. This is the first decline in at least five years. The key reason for the decline was the double-digit decline in Advertising and Promotion. While this function's PMPM decline was the fourth decline in the past five years, it was the fastest decline. Rating and Underwriting increased, broker Commissions increased modestly, while Marketing and Sales both decreased.
Staffing ratios increased in Advertising and Promotion and Rating and Underwriting, but declined in the other functions. Compensation increased in all functions, except for Broker Commissions which has no staff.
In considering the components of administrative cost increase, we typically cite only functions that show unambiguous trends, reflecting key measures of central tendencies. Also, we often report median values which has limitations but the virtue of excluding outliers. Finally, it should be noted that each of these Plans operates with a different management approach depending in part on their individual market circumstances. For instance, one Plan may choose to achieve the same efficiencies through Provider Contracting as another achieves using Medical Management so the trends described in measures of central tendency may not capture this nuance.
As Reported Trends
PMPM expenses grew more rapidly on an as-reported basis 0.5% versus 0.3% constant mix. Using this gauge, faster growth was also evident in each cluster. As developed later, this reflected a shift in favor of more expensive Medicare Advantage.
The focus of the following comments concern differences in cost changes between the two sets of calculations that may be explained by the effect of mix changes, in addition to the underlying cost growth.
Corporate Services. This cluster's cost growth was 2.5 percentage points faster on an as reported basis. Both Finance and Accounting and Actuarial increased at a far higher rate, double digits. Corporate Executive decreased at a slower rate.
Account and Membership Administration. The Account and Membership Administration cluster was least affected by the change in mix. Growth was 0.7 percentage points faster in the growth in the Account and Membership Administration cluster. But the effect on individual functions was much greater. While Customer Services declined on a constant mix basis, it grew on an as-reported basis. Enrollment grew on a constant mix basis and declined on an as reported basis. Claims and Information Systems PMPM trends were essentially the same.
Sales and Marketing. Sales and Marketing declined more slowly 0.3% versus 1.0% on a constant mix basis. The effect of this approach on Rating and Underwriting and Sales was especially strong. Rating and Underwriting includes risk-adjustment activities.
Medical and Provider Management. Medical and Provider Management was also 0.7 percentage points higher. Growth was greater in both functions but the effect on Provider Network Management and Services was much greater than on Medical Management.
Growth and Product Mix
The change in mix among the continuously participating Plans meant that the typical member became more expensive to administer, leading to higher growth in administrative expenses on an as reported basis than on a constant mix basis. In particular, the expensive-to-administer Medicare Advantage share increased.
Continuously participating health plans included in this analysis decreased their membership at a median rate of 0.2% and a mean rate of 0.7%. The median decline in Commercial was 0.9% and the mean decline was 2.3%. Within Commercial, Insured decreased by 3.3%, median, and by 2.9% on average. ASO/ASC increased by 1.2% median but declined by 3.0% on average.
Among continuously participating Plans, Commercial insured averaged 32.0% of Comprehensive membership as ASO/ASC averaged 43.4%. Commercial totaled 75.4% of Comprehensive. FEP and Medicare Supplement were 5.4% and 6.8% of the Total, respectively. MA was 5.7% and Medicaid, offered by only 5 of the continuously participating Plans, was 6.7%.
Commercial membership dominates the product portfolio of Blue Cross Blue Shield Plans with a 2025 median mix of 77.9%. Self-insurance was the greatest choice among Blue customers with ASO/ASC at a median of 48.1% of total membership and insured at 28.5%. Indemnity and PPO Insured comprised approximately 21.1% of total membership and Indemnity and PPO ASO/ASC was approximately 44.4% of total membership. ASO/ASC grew faster or declined slower than its insured counterparts.
ASO/ASC products' costs are lower than for comparable insured products largely due to the comparatively modest per member Sales and Marketing expenses required for large groups that are eligible to use these products. An ASO/ASC group necessarily possesses the statistical advantages of larger size in bearing the medical cost variance risk: this also means that group Sales and Marketing costs are spread through greater numbers of members.
Medicare Advantage surged at an 11.6% median rate and an 18.3% mean rate with its more costly-to-administer individual segment increasing by 16.4% and group increasing by 19.6%, median. Medicare Advantage comprises a median of 4.0% of Comprehensive members but, for two of the continuous 10 Plans, it exceeds 10%. All continuous Plans offered this product.
The mainstay Medicare Supplemental product has a median share of all Plans of 6.0% of Comprehensive membership. This low cost to administer product grew at a median rate of 0.3%.
The median decline in Medicaid membership was 2.8%. This is a low cost-to-administer product. Only five of the ten continuous Plans offer the product but, for those Plans, their commitment is substantial, with four in double digits. The average percent of membership in this product was 5.5%. Medicaid declined by 2.8%, median, and 2.0% mean.
The overwhelming proportion of Plans saw a decline in FEP, a low-cost product. Its median membership decline was 1.9%.
Trends in Factors Driving Costs
The operational drivers provide additional insights to cost trends. The drivers discussed in this section are estimated staffing ratios, compensation, non-labor costs and propensity to outsource. We previously noted their impact on some of the functions themselves.
On a Constant Mix Basis, the modest growth stemmed from a 0.2% decline in the staffing ratios to a median of 21.3 FTEs per 10,000 members. This includes the effects of outsourced staffing.1 For Commercial Insured, a mainstay set of products, staffing ratios were 23.5 FTEs per 10,000 members for all Plans.2 This was offset by an increase in cost per FTE of 1.5%, a 4.5% increase in compensation and a 2.8% decline in per FTE non-labor costs, and a 3.0% if the decline in staffing is excluded, to $139,000, median. The median Staffing Costs per FTE were also $139,000, an increase of 4.5%. Compensation growth was especially strong in Risk Adjustment and Actuarial. Outsourcing increased by 3.0 percentage points among continuously reporting Plans.
For analytical purposes, we use inferred staffing ratios for Commercial Insured products because it reflects outsourcing, is among the largest products in Plan portfolios and includes the full spectrum of activities necessary to support health coverage.
Declines in staffing were common and pronounced in the lowest compensated activities of Enrollment/Membership/Billing and Customer Services. Together, these two functions comprised approximately 20% of total staffing. Compensation appeared to have increased sharply among the staff in these areas. Claims, also a lower compensated function, had similar pattern of staffing declines with compensation increases. While higher compensated, Information Systems also declined in staffing while compensation increased. In each case, since the compensation growth was higher than inflation, it is possible that the increase was in part associated with the retention of the more highly compensated employees.
Among Account and Membership Administration functions, outsourcing appeared to have increased in the Claims area.
Staffing declines also occurred in higher compensated areas like Marketing and Medical Management. Compensation growth in these functions was well above inflation. Outsourcing also increased in these functions.
There were several functions that had growth in staffing and compensation. These included Rating and Underwriting, Finance and Accounting and Actuarial. The increase in outsourcing as a percent of total staffing was greater than average for both Rating and Underwriting and Finance and Accounting.
The Corporate Services function had both an increase in staff and a modest increase in compensation. Staffing growth in the Legal area was especially notable. Compliance staffing and compensation increased, as Government Affairs doubled, with a decline in median Compensation. Outside Litigation increased at double-digit rates.
Corporate Executive staffing increased at a double-digit rate, as compensation declined. Its subfunction of Strategic Expenses increased at a far higher pace than Other Corporate Executive & Governance.
Non-labor costs declined by 2.8% per FTE, and 3.0% PMPM without the effect of increased staff. The sharpest increases in Non-Labor, excluding the effect of changes in FTEs, was in Corporate Executive and Governance, Corporate Services and Finance and Accounting. The sharpest declines were in Advertising and Promotion, Marketing and Enrollment.
Outsourcing increased by 3.0 percentage points to 15.2%. Among the most prominent increases in outsourcing was Rating and Underwriting, Claims and Corporate Executive. For the set of all Plans, subfunctions that are more than 20% outsourced included Rating and Underwriting, Medical Management, Enrollment and Claims.
Costs of Blue Cross Blue Shield Plans, by Cluster, PMPM
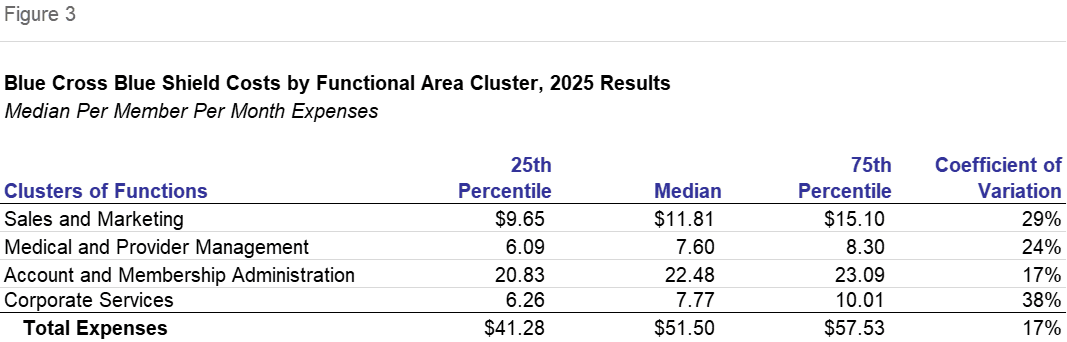
Figure 3 shows the cost values from the set of all 12 participating Blue Plans, rather than just the continuously participating. This universe of Blue Cross Blue Shield Plans differs from that of last year in product mix and in Plans. In this section we will touch on comparisons with the results reported last year, notwithstanding this limitation. The changes shown in Figure 2 are a better measure of trend.
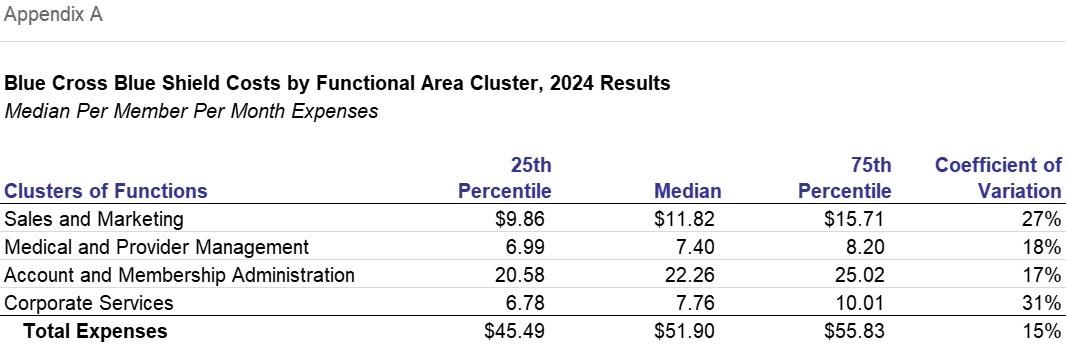
The effect of expense increases, a change in product mix favoring more expensive products and a slight change in the universe gave rise to median Blue Cross Blue Shield administrative costs that were $51.50, down by 0.8% from last year's $51.90. Percent differences are for the median values for Total and each cluster value. The prior year values are shown in Appendix A. There is a loose correspondence with the Figure 2 changes with the continuously participating plans.
Sales and Marketing decreased by 0.1% to $11.81. This cluster decreased by 1.0% on a constant mix basis and 0.3% on an as reported basis. This function includes Rating and Underwriting, Sales, Marketing, Broker Commissions and Advertising.
Account and Membership Administration had costs that were 1.0% higher than last year at $22.48 PMPM. On both a constant-mix basis and as-reported, this was the third fastest growing function. On a constant-mix basis, it increased by 1.1%. At 44% of Total expenses, this is by far the largest cluster and it has an outsized effect on cost trends. This cluster includes the central activities of Information Systems, Enrollment, Claims and Customer Services.
Medical and Provider Management was the cluster with the greatest increase, by 2.8% to $7.60. This group of functions includes Provider Network Management and Services and Medical Management / Quality Assurance / Wellness. Its constant-mix increase of 1.3% was also fastest.
The 0.1% increase in Corporate Services to $7.77 PMPM was the second slowest increase, while the 1.2% constant mix growth and 3.7% as reported growth were among the fastest. Activities in this cluster include Corporate Executive, Actuarial, Finance and Accounting, and the Corporate Services function, which includes subfunctions like Facilities, Human Resources and Legal.
Dispersions of results nevertheless increased. The coefficient of variance for total expense was 17% overall compared with 15% in the prior year. With the exception of Account and Membership Administration, all Coefficients of Variation increased, with Corporate Services increasing most sharply to 38% from 31% last year. Medical and Provider Management also increased by 6.5 percentage points.
Dispersion increased as measured by the differences between the 75th and 25th percentile values, by $5.92 for the Total. Account and Membership Administration and Sales and Marketing dispersion declined while Medical and Provider Management and Corporate Services became more dispersed.
Costs of Blue Cross Blue Shield Plans, PMPM by Product
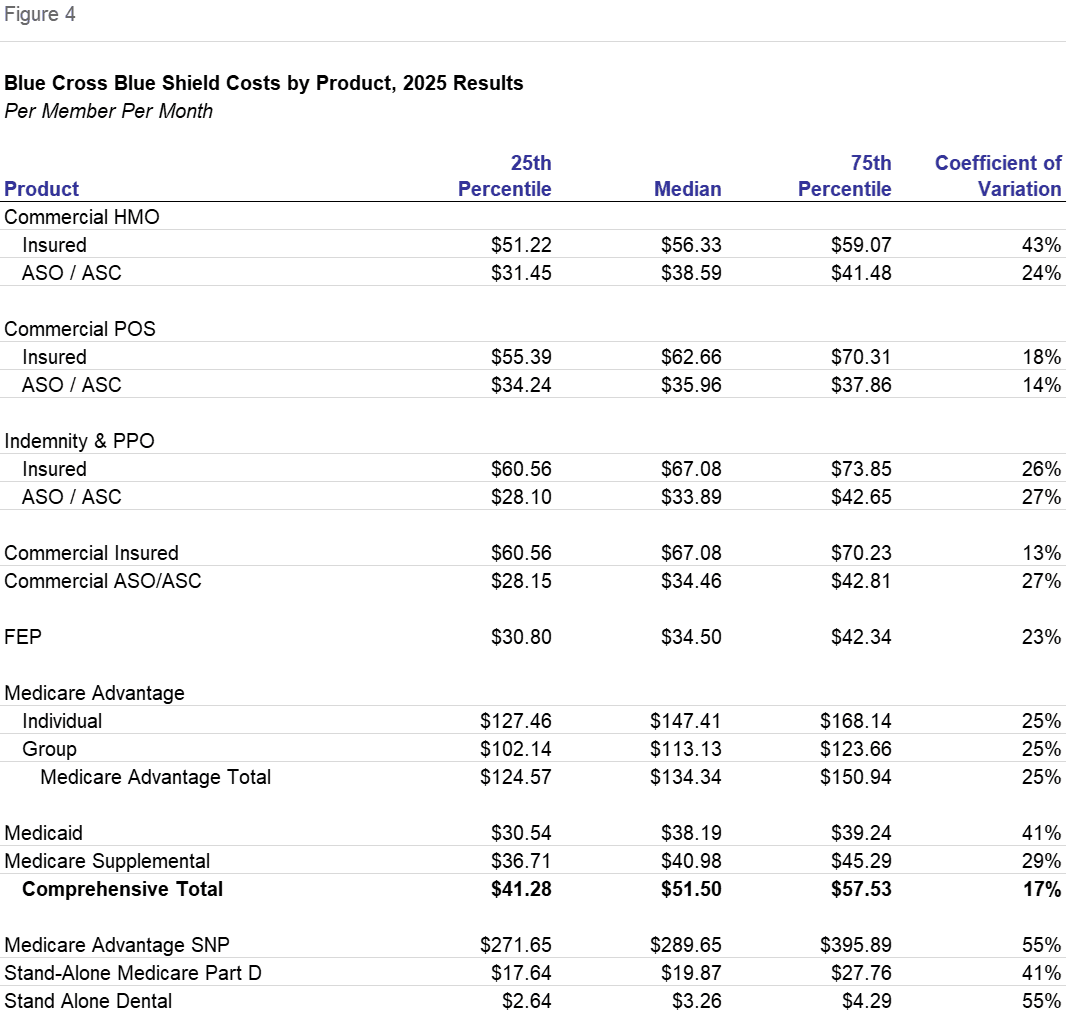
Product Expenses shown in Figure 4 differ greatly, reflecting the varying effects of distribution systems, population health needs and the scope of benefits.
Commercial Insured, at $67.08 PMPM is nearly twice its ASO/ASC counterpart at $34.46 PMPM, illustrating the effects of the distribution system. While the product differences vary, this is a consistent pattern across HMO, POS and Indemnity and PPO products. The lower costs in the ASO/ASC product reflect the lower costs to distribute to large groups compared with the higher per member costs for individuals and small groups. For instance, it is commonly the case that Broker Commissions are not expenses of health plans for these groups. ASO (Administrative Services Only) relationships required that the employer be self-insured; the group size required to make self-insurance feasible has the effect of lowering the per member costs.
Commercial products are the most important to Blue Cross Blue Shield Plans. ASO/ASC is the lion's share of that. By far the most important ASO/ASC product is Indemnity and PPO which costs a median of $33.89 PMPM. HMO costs $38.59 PMPM while POS costs $35.96.
The single most important commercial insured product is Indemnity and PPO at a median of $67.08 PMPM. HMO costs $56.33 while POS costs $62.66. Individual, including Exchange, members are included as commercial insured.
The effect of the underlying population costs are shown in the difference between Commercial Insured products and Medicare Advantage. Individual MA had a median cost of $147.41 versus Commercial Insured products of $67.08. The former are Medicare-eligible and greater than 65 years of age, whereas Commercial Insured members are younger working age people. Higher health care costs often result in greater claims volume, member services inquiries and so forth, making administrative activities more expensive.
Group Medicare Advantage was $113.13 and the Total Medicare Advantage was $134.34. The difference between the Group and Individual stems largely from relative Sales and Marketing costs. Recall that Medicare Advantage products were typically the fastest growing. Because of their relative costs an increase of this product in Plan portfolios would result in an apparent total increase even if each product cost had no increase.
The approximately $30 difference between the two Commercial HMO products and the two Medicare products also shows the distribution system differences.
FEP is a low cost product at $34.50. The Federal Employee Program is considered an insured product. It serves Federal Employees and dependents below retirement age but, since Blue Cross Blue Shield Association is the prime contractor and directly assumes certain distribution and enrollment costs, the Plans incur the low Sales and Marketing cost characteristic of ASO/ASC commercial products.
Medicaid costs, at $38.19 PMPM, reflect the low health costs of that population, mainly mothers and children, plus their low distribution system costs. Its costs are 57% of Commercial Insured.
Medicare Supplemental, at $40.98, is a below-average cost product. This product is for Medicare eligibles and is a secondary payor to Fee-for-Service Medicare. Based on relative growth, it appears that it may be succeeded by Medicare Advantage either through migration of members between the products or the preferences of newly eligible seniors. Medicare Advantage and Medicare Supplemental products are both sold to seniors but Med Sup is one-third the cost to administer. This illustrates the effect of the scope of benefits. Med Sup's responsibilities are more limited stemming from being a secondary payor to the Medicare Fee for Service program. Per member health benefits for Medicare Supplemental are one-fourth that of MA.
The highest and lowest cost products offered by Blue Plans are not included as Comprehensive. Medicare SNP had costs of $289.65 PMPM, double that of Medicare Advantage. Health care costs are similarly about double that of MA.
Stand-Alone Dental had costs of $3.26 PMPM. Stand-Alone Part D's PMPM costs were $19.87. Their administrative costs reflect their modest benefit scope.
In summary, and by way of example, ASO administrative costs are lower than MA and SNP because of the populations they serve, and they are lower than comparable insured products because of a lower per-member cost to distribute the product. They are higher than Part D and Dental because of their much greater scope of benefits.
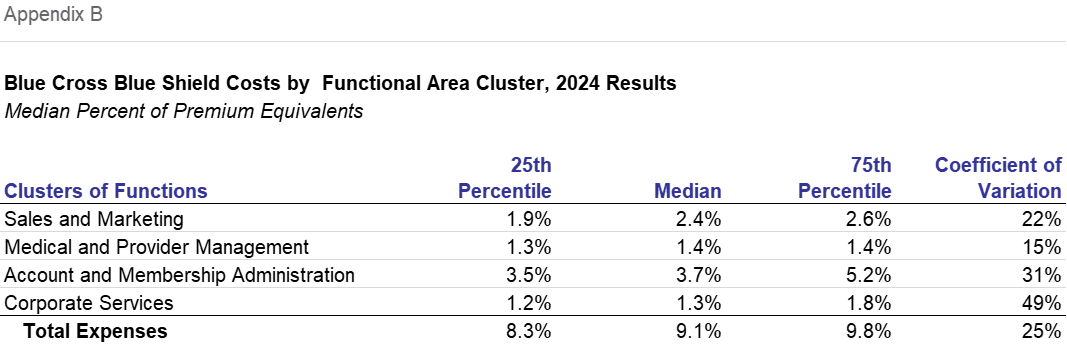
Costs of Blue Cross Blue Shield Plans, Percent of Premiums by Product
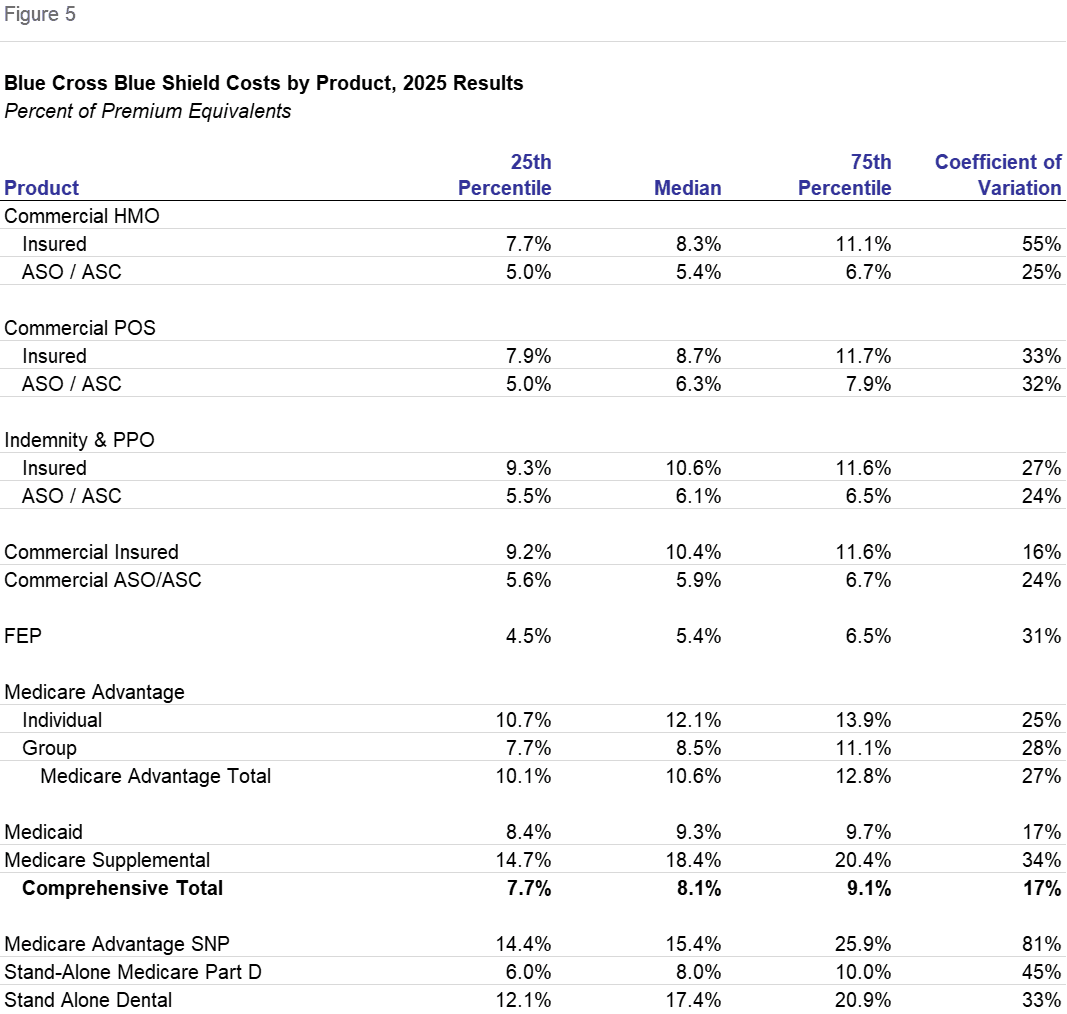
Sometimes analysts evaluate administrative expenses standardized as percents of premium. While this is straightforward for fully-insured products, in the ratios displayed in Figure 5 and in Figure 6 which follow, "premiums" are expressed as premium equivalents in self-insured products. We calculate premium equivalents as the sum of fees to self-insured groups plus the health benefits associated with those groups.
This increased clustering of the percent ratios relative to the PMPM ratios is because of two factors. First, the premium or equivalent denominator is comprised mainly of health benefits, that is, a health benefit ratio of normally 80-90%. By contrast, no weighting of differing health benefits is incorporated into a PMPM calculation. Second, there is a numerator effect in that many administrative expenses are linked to the health needs of the population served. These include claims, customer services, medical management and the information systems necessary to support them.
There do remain some differences. They stem partly from distribution systems' expenses. The ostensible difference between insured and ASO/ASC is merely the means of financing the health benefits. But ASO/ASC requires the self-insured group to be of sufficient size to absorb health benefit cost variances. The byproduct of this requirement is that self-insured groups are larger organizations which require lower Sales and Marketing expenses per member.
The effect of health needs, distribution system and scope, is reflected in the differences in ranking the products when expressed as a percent, as compared with on a PMPM basis.
While Medicare Advantage products had double or triple the administrative costs of Commercial Insured HMO, at 12.1%, on a percent basis it was only 46% higher. Group Medicare Advantage was 8.5%. This highlights the importance of health care needs in administrative expense; as health care needs increase with the population served, administrative expenses increase as well.
On a percent basis, the factor of distribution system costs persisted. The Commercial ASO/ASC products had administrative costs of 5.9% that were sharply lower than the Commercial Insured products at 10.4%. Within Commercial Insured, HMO was 8.3%, POS was 8.7%, and Indemnity & PPO was 10.6%. ASO/ASC administrative costs were less: HMO at 5.4%, Indemnity & PPO at 6.1% and POS at 6.3%. The lower Sales and Marketing expenses associated with groups is also evident in the Medicare Advantage products with Individual far higher than Group.
The expense of FEP resembles ASO/ASC because the Sales and Marketing activities are largely conducted by the Blue Cross Blue Shield Association. FEP was only 5.4%.
Medicaid was 9.3%, above comprehensive total of 8.1%, rather than being a low cost product on a PMPM basis. While health care costs are less, Medical Management costs are notably high for the population served by Medicaid products.
Medicare Supplement, Stand-Alone Medicare Part D and Stand Alone Dental are higher percent of premium products because the scope of benefits is more narrow. Medicare Supplemental is a secondary payor to Medicare, and the other products are limited to pharmacy and dental benefits respectively.
Recall that Medicare Supplemental, Stand-Alone Medicare Part D and Stand Alone Dental were low costs measured PMPM. At 18.4%, 8.0% and 17.4%, respectively, they are high or average cost.
Plans offering this product assume many of the responsibilities of other comprehensive products without the necessity to incur the full health care costs of the insured membership. Therefore the premium denominator is smaller.
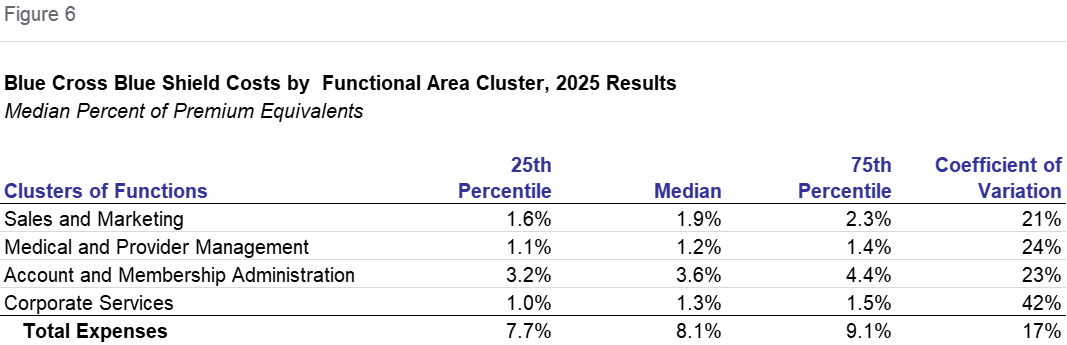
Costs of Blue Cross Blue Shield Plans, Expense Clusters as Percent of Premium
Expressed as a percent of premium equivalents, median expense ratios also declined. In total, they fell from 9.1% in 2024 to 8.1% in 2025. Except for Corporate Services, which was unchanged, each cluster declined as a percent of premium equivalents, with Sales and Marketing declining by 0.4 percentage points to 1.9%. Both Medical and Provider Management and Account and Membership Administration declined by 0.1 percentage points to 1.2% and 3.6%, respectively. This year's universe differs from last year's in participants and product mix so that Figure 2 will be a more useful measurement of trends.
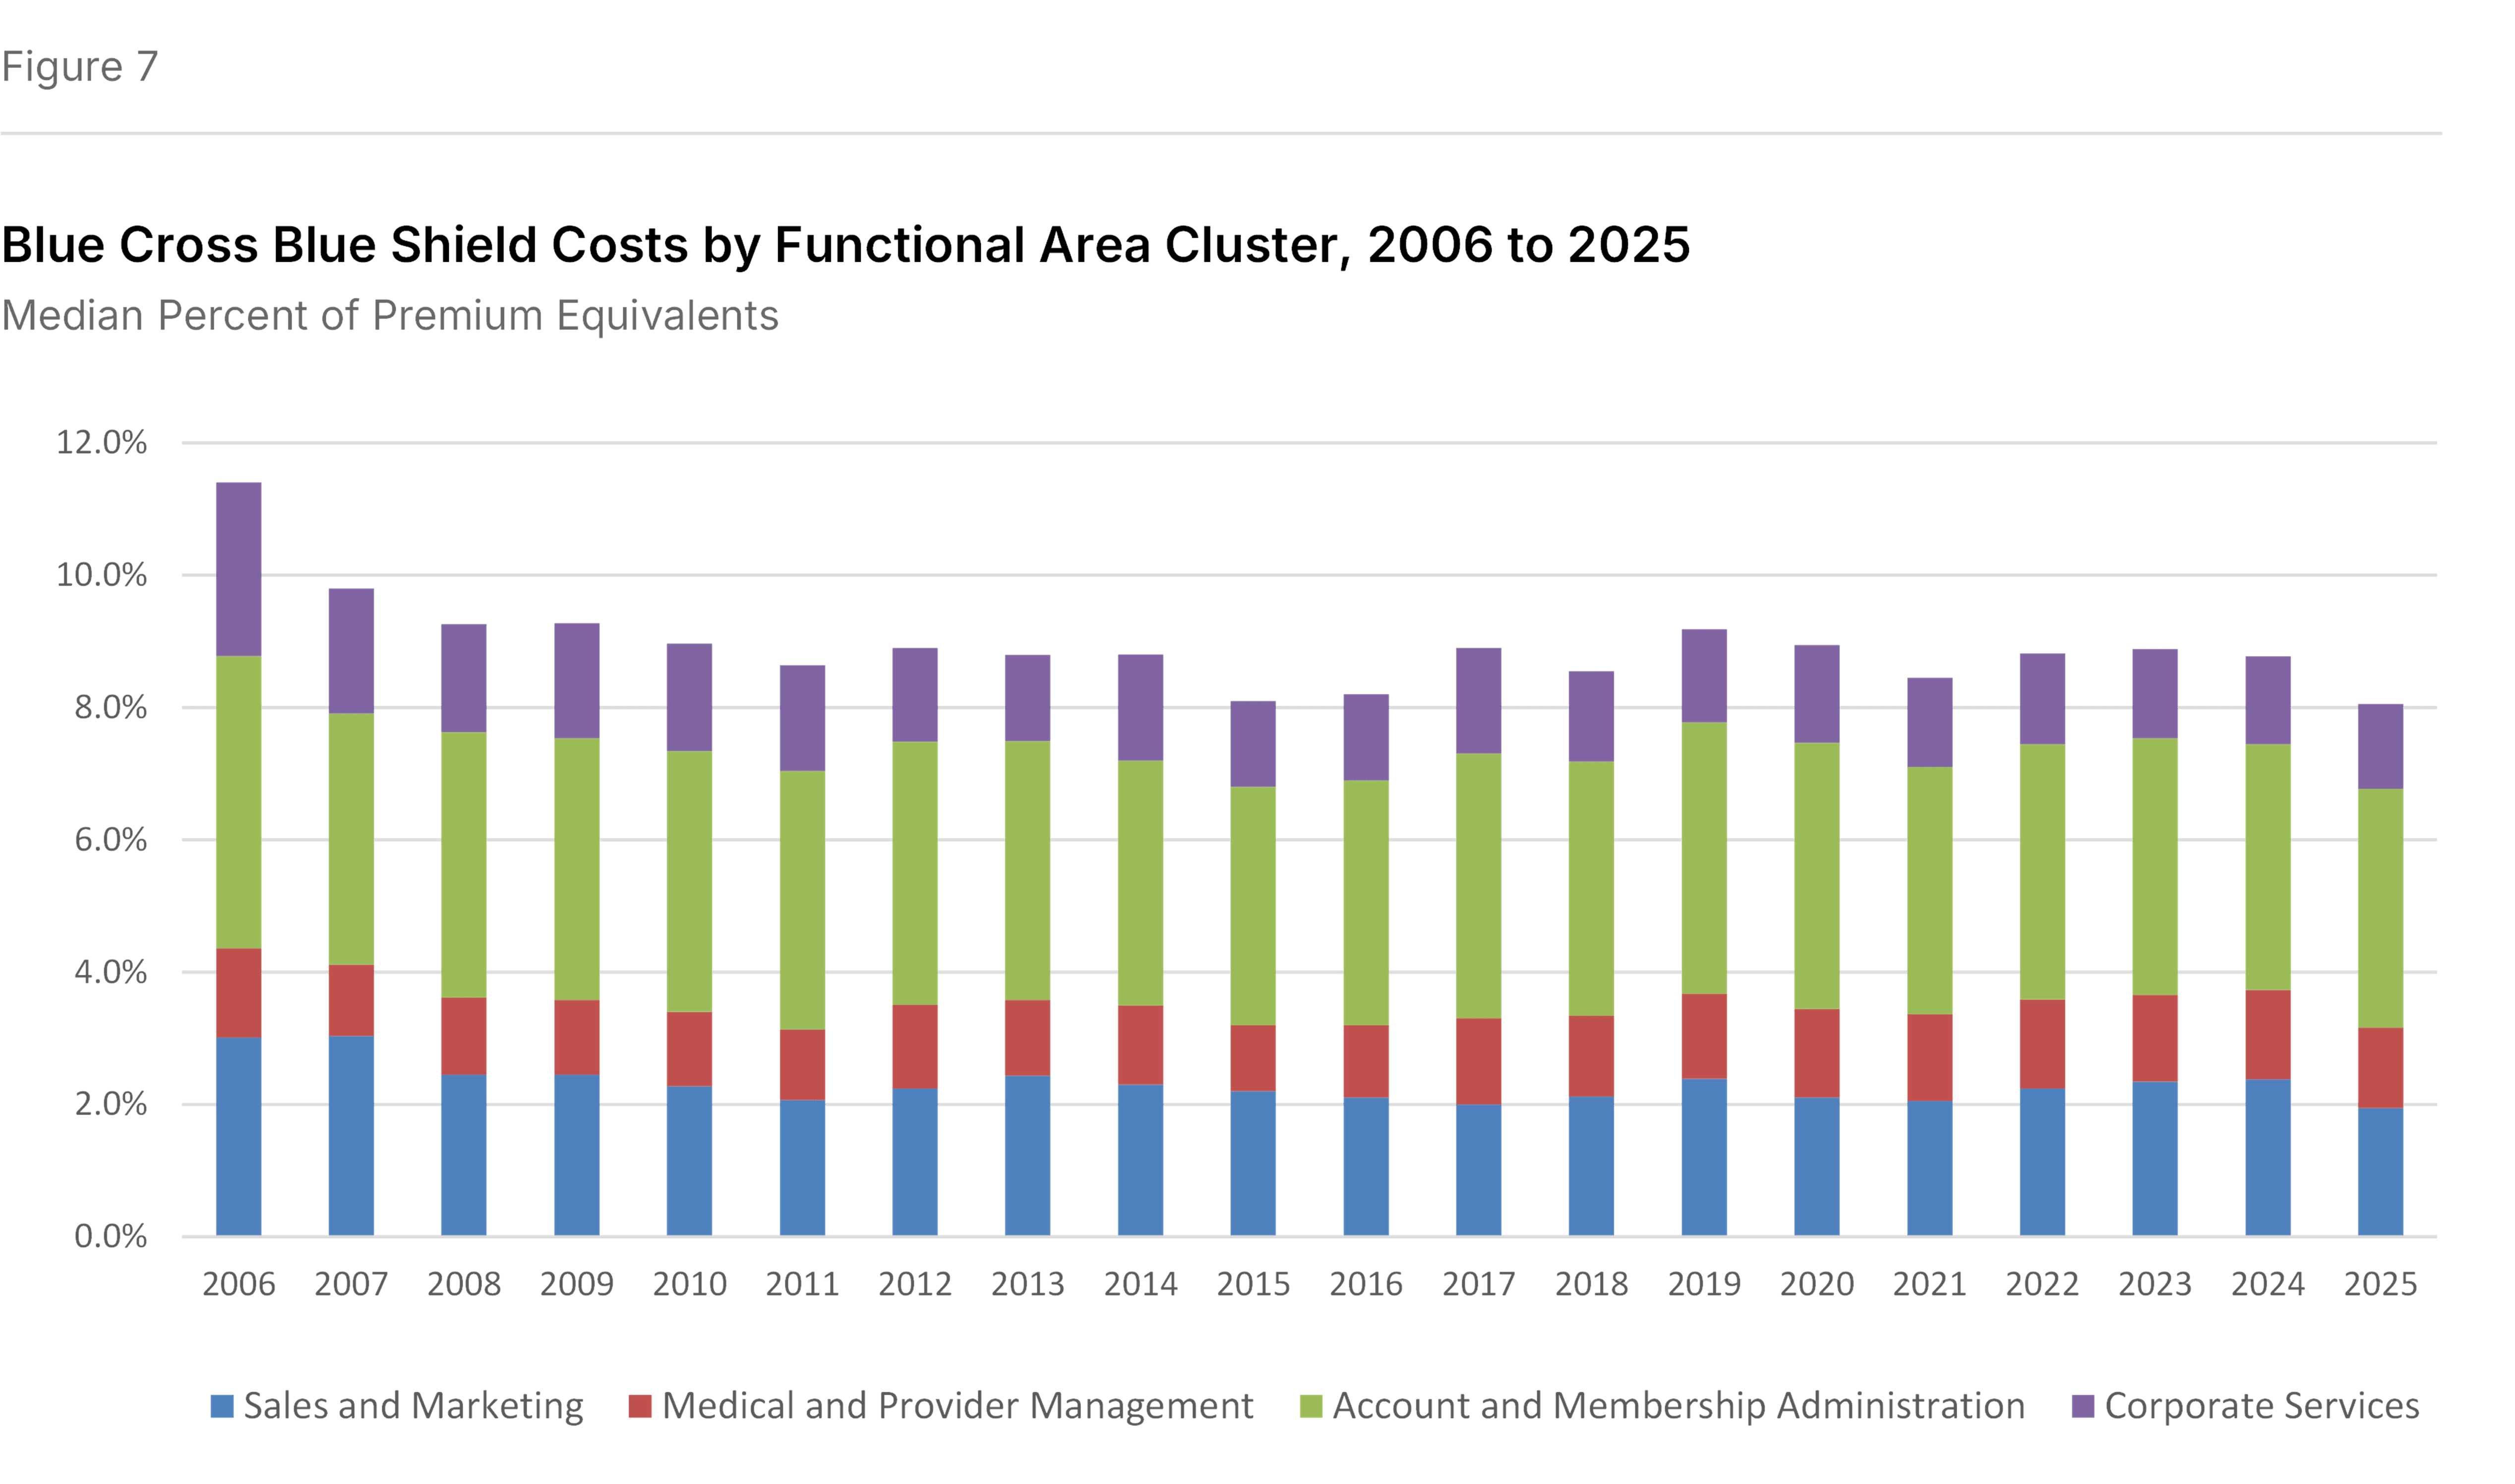
Expense Clusters as Percent of Premium over Time
The administrative expense ratio in 2025 was the lowest in the past twenty years. While there are year-to-year fluctuations, the underlying trend among Blue Cross Blue Shield participants in the Sherlock Benchmarks is for declines, as shown in Figure 7. The 2025 percent of premium of 8.1% compares with the 11.9% in 2006.
Based on the average expense ratios in the beginning and ending five years in the series, declines in Corporate Services and Sales and Marketing were central. Account and Membership Administration also declined. However, Medical and Provider Management expenses increased slightly relative to premiums.
The decline has been achieved notwithstanding the cost for Blue Cross Blue Shield Plans to adapt to changes in customer needs, a more challenging environment vis-a-vis providers, government initiatives and actions of competitors.
How We Performed This Analysis
Characteristics of the Blue Cross Blue Shield Universe
This analysis is based on the twenty-ninth annual edition of our performance benchmarks for health plans. The Sherlock Benchmarks represents the cumulative experience of more than 1,000 health benefit organization years.
Each peer group in the Sherlock Benchmarks is established to be relatively uniform. So, within that constraint, participation is open to Blue Cross Blue Shield Plans possessing the ability to compile high-quality, segmented financial and operational data. We surveyed the participants to populate the Sherlock Benchmarks and this summary.
This 28th analysis of Blue Plans is based on a peer group of twelve Blue Cross Blue Shield Plans who collectively serve 41.2 million members, not including Host, specialty, and other products. This universe is quite robust. Participants in this year's study serve about 37% of all Blue Cross Blue Shield comprehensive members. Excluding those served by publicly-traded Blue Plans, the participants in this year's study serve 57% of all Blue comprehensive membership.
Collectively, in 2025 the health plan operations of these Plans earned annual premiums plus fees of $170.1 billion and $302.7 billion in premium equivalents in their Comprehensive products. The total revenues for the set was $175.7 billion in 2025. The median Plan participating in the Sherlock Benchmarks this year served 2.0 million people with Comprehensive products. The Plans were geographically disbursed, serving 18 states. Eleven of this year's twelve participants also participated last year. The average participation experience in the Blue Cross Blue Shield universe of the Sherlock Benchmarks is 18.5 years.
In addition to the Comprehensive members, these Plans also served 54,000 Medicare SNP members, 653,000 members of stand-alone Medicare Part D products and 8.3 million members of Stand-Alone Dental. In addition to these members, the Plans served 9.5 million Blue Cross Blue Shield members through "Host" relationships with other Blue Plans.
Collectively, within the comprehensive products, 79.5% was Commercial. Of the Commercial members approximately 65.1% were served through self-insurance arrangements.
Medicare Advantage, with 1.8 million members, was offered by 11 Plans. It was 4.3% of the combined Comprehensive membership and 15.2% of revenues for Comprehensive products. Members in groups represented 37% of Medicare Advantage membership. With SNP and Stand-Alone Part D, these products represent 16.4% of total revenues.
Medicare Supplement, with 2.3 million members, was offered by all twelve Plans, was 5.5% of Comprehensive members and 3.6% of revenues for Blue Cross Blue Shield Comprehensive products. In total, 20.0% of combined Plan revenues arises from products sold to seniors.
Medicaid HMO, offered by 5 Plans, comprised 6.1% of combined Comprehensive membership and 3.6% of Comprehensive revenues. FEP served 1.9 million members or 4.6% of the combined total and 9.4% of combined Comprehensive revenues.
Reporting Conventions
We employ some conventions to make the metrics most beneficial for the audience of Plan Management Navigator.
- The trends reported in this analysis are median changes and, when we refer to PMPM or percent of premium ratios, these too are medians. This measure of central tendency reduces the effect of outlying values on overall trends and values. Since each median value is calculated independently, the components cannot be summed.
- References to growth rates hold the universe constant in the comparison years unless otherwise noted. Rates of change called "as reported" are of health plans participating during both comparison years. When we refer to "constant mix" we are calculating rates of change for that same constant set of Plans after reweighting each Plan's product costs to eliminate the effect of product mix differences between their comparison years.
- Percent of premium ratios are calculated on a premium-equivalent basis. That is, in the case of ASO/ASC arrangements, we synthesize premium rates by adding to fees the health benefits incurred by the self-insured group. In this way, premium equivalents sum to all of the expenses of health insurance, including profits earned by the health plan, analogous to actual premiums on insured products. While not in accordance with GAAP, this approach has two advantages: comparability of ASO/ASC ratios with those of insured products offered by these Plans, and an intuitive appeal to general readers.
- Expenses and revenues exclude capital costs and investment income. We specifically exclude interest and similar debt capital costs, profits and capital formation costs (debt or equity) such as transaction costs, and interest payments to providers under "prompt pay" laws.
- Participants in and licensees of the Sherlock Benchmarks will note that the values for Account and Membership Administration and Total Administrative costs reported here will differ from those reported in the Benchmarks. The values reflected in Navigator include administrative expenses associated with pharmacy and behavioral health while the Sherlock Benchmarks do not. Because of variation in contracting by employers for these benefits and that the administration of these health services is sometimes outsourced by Plans who accept these management responsibilities, the Benchmark reports carve them out. Pages 22 - 24 in Tab 2 of Volume I of the 2026 Sherlock Benchmarks reconciles these two presentations.
- Expense trends, along with the PMPM and percent of premium ratios, are calculated before the effect of Miscellaneous Business Taxes. These expenses are a special case among administrative expenses since, short of major reorganization, they are impractical to manage. These taxes are primarily related to the Affordable Care Act, and they may vary based on public policy. For Commercial Insured products, the median PMPM value of such taxes is $6.74 for 2025, compared with $10.47 for 2024, $8.84 for 2023 and $10.19 for 2022. The 2025 value was approximately 9.6% of total administrative costs for this set of products.
Appendices

Notes
- Outsourced FTEs are often estimated from invoice amounts of BPOs and other similar vendors based on the compensation and non-labor costs of Plans that do not themselves outsource.
- The staffing ratio for the commercial insured products is estimated based on Plan reports for their comprehensive products. Also, since the Plans report all PMPM costs for each function by product, we can estimate product staffing costs for any given product using only the assumption that the mix of labor and non-labor costs is the same across all offered products. By focusing on one product we are able to illustrate trends without the distortion of product mix changes.
Note on the Sherlock Benchmarks
The Sherlock Benchmarks are the health plan industry's metrics informing the management of administrative activities. They are based on validated surveys of approximately 30 health plans serving over 52 million Americans and provide costs and their drivers on key administrative activities. The Benchmarks are reported in multiple universes of health plans: Larger Plans, Blue Cross Blue Shield, Independent / Provider-Sponsored, Medicare and Medicaid.
The Sherlock Benchmarks are the "gold standard" of health plan administrative cost benchmarks. Health plans use them to determine whether their administrative costs are competitive, to prioritize for improvement among numerous specific activities and to identify cost drivers such as staffing ratios that, overall and within functions, can help implement those improvements.
These Plan Management Navigator results are excerpted from the Blue Cross Blue Shield edition of the 2026 Sherlock Benchmarks. We will be reporting on the results of the other universes in the months that follow. Detailed health plan costs and operational drivers are available by licensing the Sherlock Benchmarks.
If you are interested in licensing these materials, if we can answer any further questions about them, or if you have questions about this Plan Management Navigator, we hope you will not hesitate to contact us. In addition, the Sherlock Company website has an application that allows you to try out the Benchmarks free of charge. Tables of Contents, report formats, citations, quality assurance and other information can be found here.