Independent / Provider-Sponsored
Plans' Administrative Expense
in 2025
Slower expense growth for a second consecutive year, as mix changes generally
accelerated reported costs.
This Navigator contains an addendum revising the original figures.
15 min read

Conclusions
- Administrative expense growth in 2025, at a median of 5.3% excluding mix differences, decelerated for the second consecutive year from the 2023 peak of 8.7%, though it remained slightly above the 10-year average of 5.0%. Growth was 4.0% without excluding the effect of product mix differences. The 2024 growth rates were 6.2% holding mix constant and 9.5% as reported.
- In a reversal of recent years, as reported growth was below constant mix growth: changes in product mix modestly reduced apparent growth rather than raising it, even as Medicare Advantage increased. Average growth was consistent with customary trends: Medicare Advantage amplifies cost increases.
- Growth in costs for the cluster of Account and Membership Administration, approximately 37% of all expenses, decelerated to 6.4% on both bases, from 7.6% holding mix constant and 10.0% as reported in 2024. It remained above its 10-year average growth of 5.9%.
- Sales and Marketing costs declined outright, by 3.5% holding mix constant, the cluster's slowest result in at least five years. Advertising and Promotion and Marketing declined by near double digits and Rating and Underwriting by mid single digits. External Broker Commissions, up 1.2%, was the only function in the cluster to increase.
- Corporate Services exceeded Account and Membership Administration as the fastest-growing cluster, accelerating to 7.1%, led by Finance and Accounting and Actuarial, up by double digits. Medical and Provider Management decelerated sharply to 0.6%, as Provider Network Management and Services outgrew Medical Management.
- Claim and Encounter Capture and Adjudication increased at the fastest rate of any function in at least five years, on a significant increase in outsourcing; Payment Integrity was an especially fast-growing subfunction.
- At 9.8% of premium equivalents, administrative costs were 0.5 percentage points above last year's 9.3%.
- Factors impacting the change in administrative costs were a 5.4% decline in staffing ratios and a 10.2% increase in compensation, to a median of approximately $124,000 including benefits; excluding the effect of lower staffing ratios, non-labor costs declined. The propensity to outsource increased by 0.9 percentage points to 14.5% of combined FTEs.
Trends are based on the results of 9 continuously participating plans in the Sherlock Benchmarks. The source of the data used in this analysis is Sherlock Company surveys of thirteen Independent / Provider-Sponsored health plans. The 13 participating plans collectively serve 9.0 million people with Comprehensive products.
Long-Term Trends
Figure 1 shows the constant mix increase in PMPM costs of 5.3% in 2025 was lower than the 6.2% of 2024, calculated after having eliminated the effects of product mix differences between every two comparison years. 2025 marks the second consecutive year of deceleration from the 2023 peak of 8.7% for Total administration and 11.0% for Account and Membership Administration. The 2021 through 2023 acceleration followed the declines of 2020, which we attribute to the adaptation to Covid policies. Total growth of 5.3% was slightly above the 10-year average of 5.0%, and Account and Membership Administration growth of 6.4% was above its 10-year average of 5.9%. Growth in both series was nevertheless the lowest since 2021.
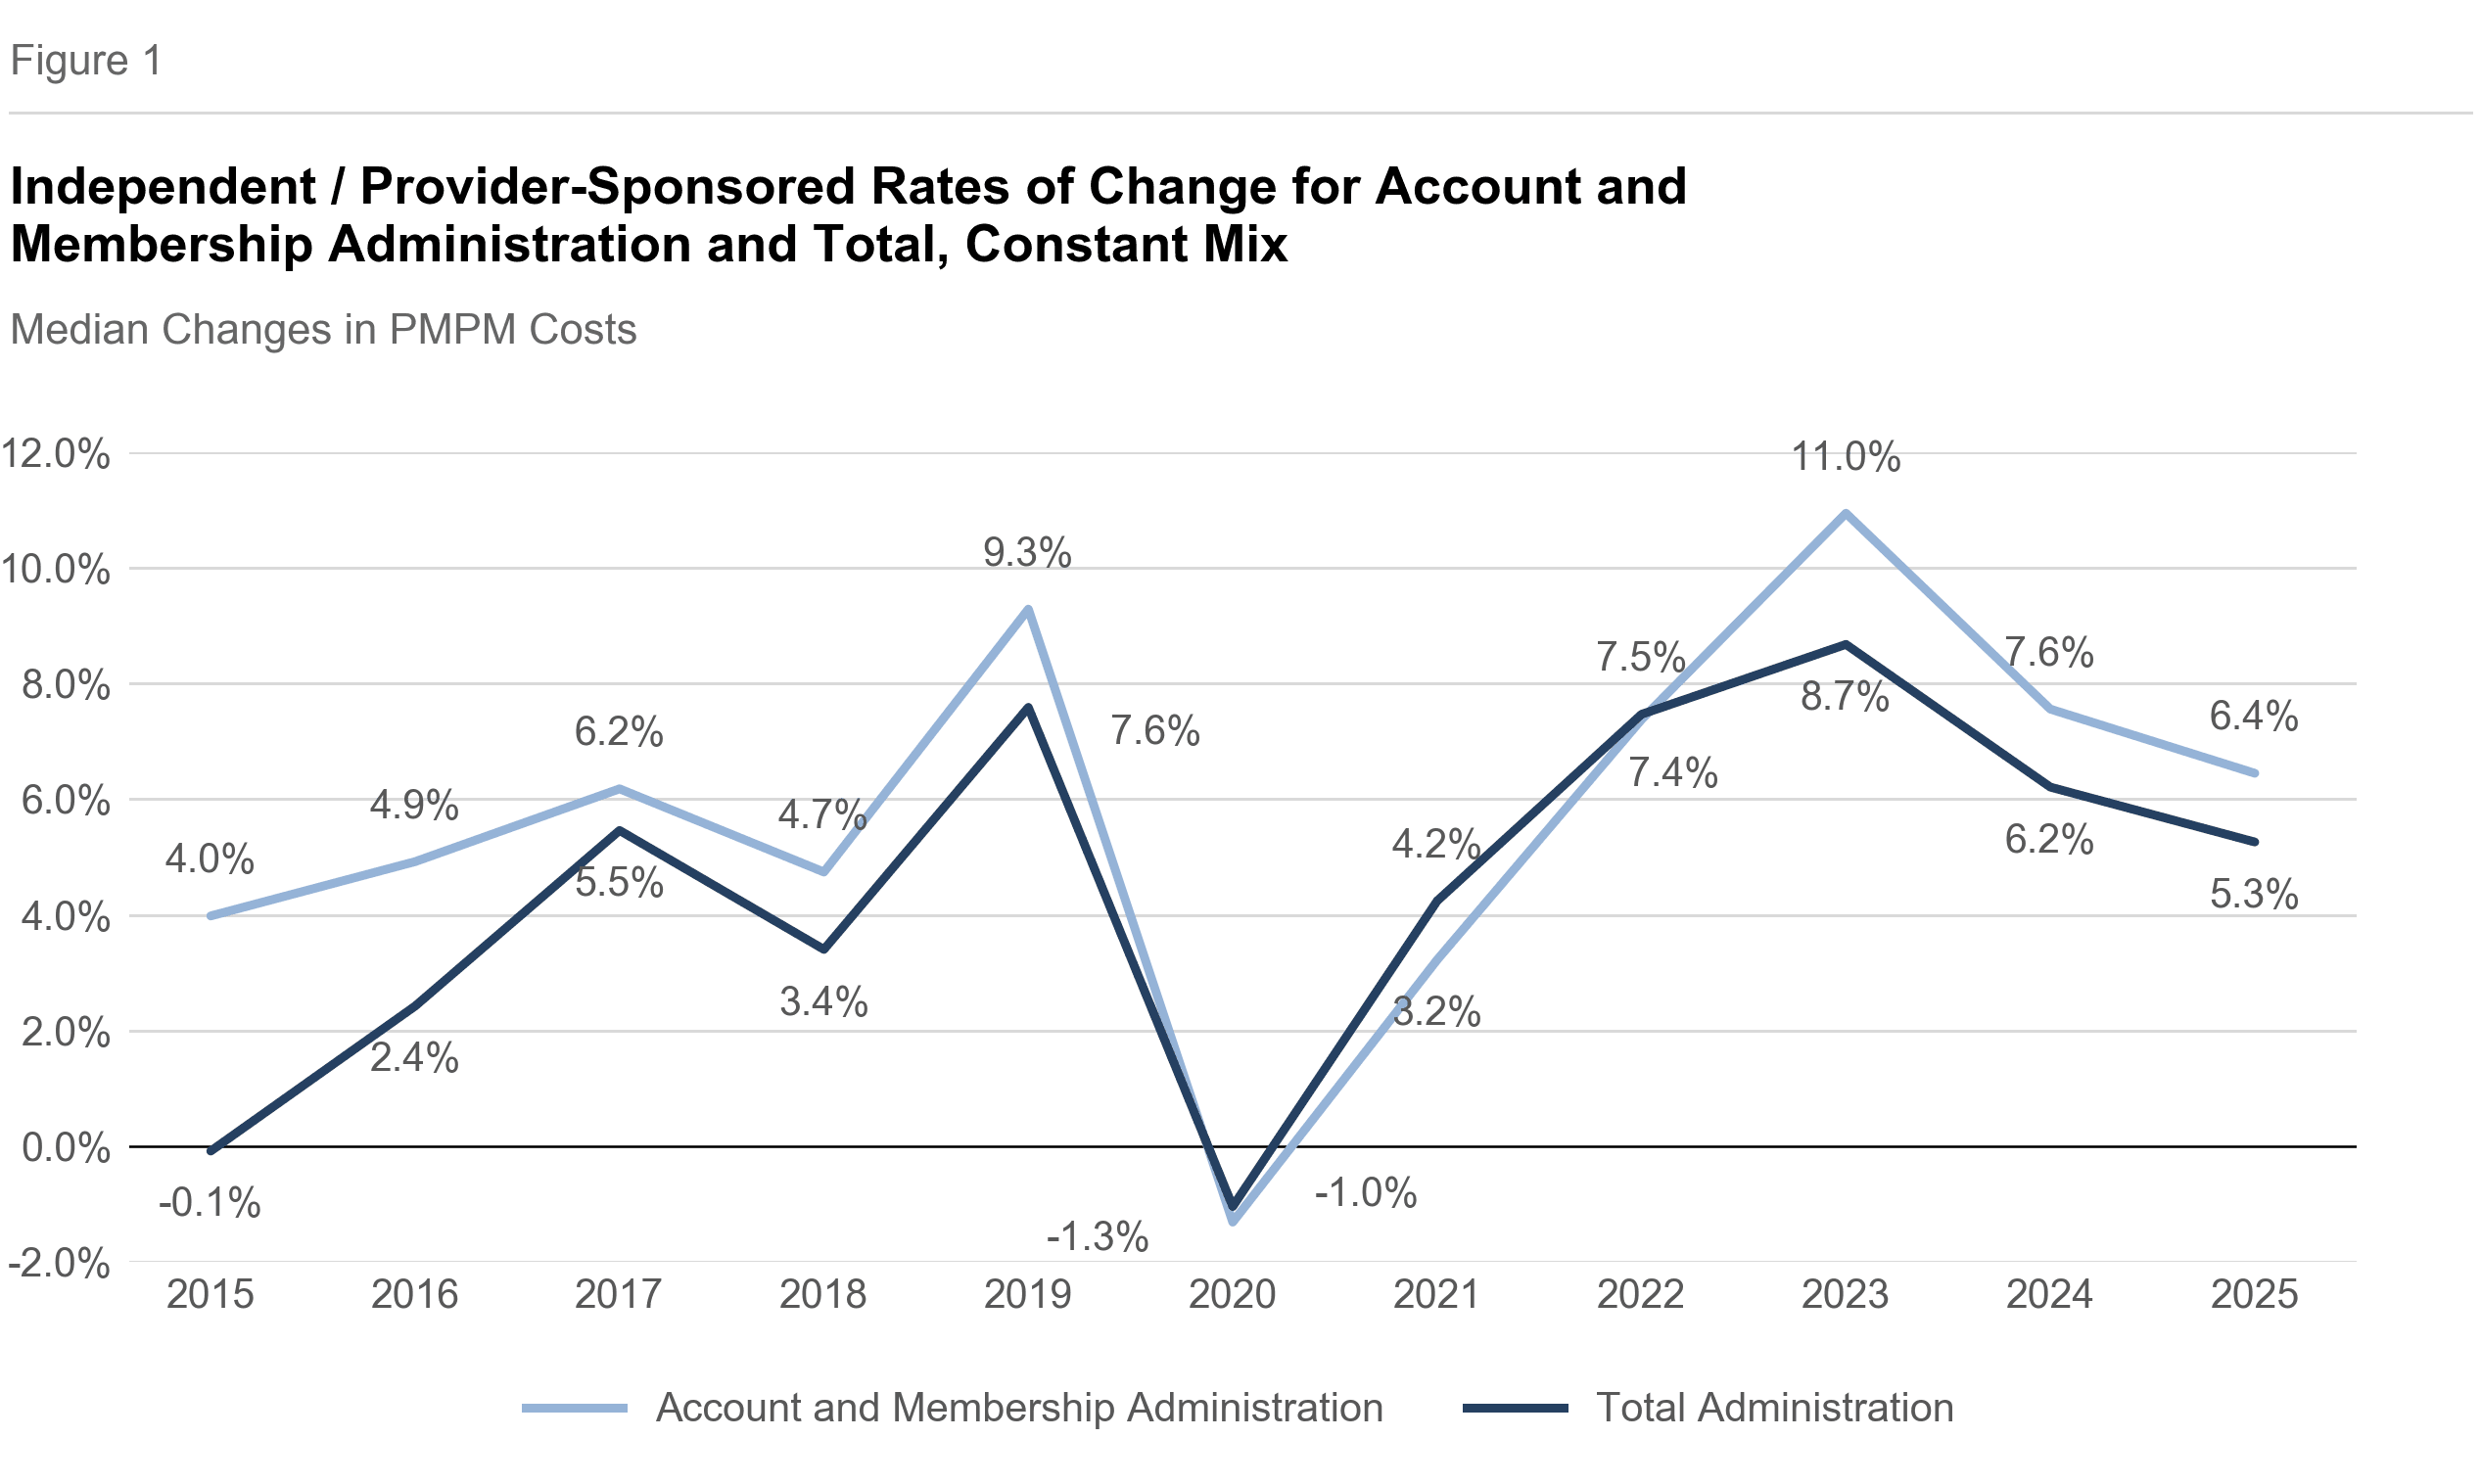
In 2025, the deceleration in Total expenses was shared by the IPS plans' sister universe of Blue Cross Blue Shield Plans, whose constant mix growth slowed to 0.3%.
Trends and Product Mix Changes
Figure 2 shows median year-over-year trends in total administrative expenses and in each cluster of expense. In all cases, trends are shown solely from continuously participating plans, and all trends are costs per member per month. The "as reported" values are trends in PMPM costs. "Constant mix" values are also trends in costs but, in calculating growth, prior year product costs are reweighted to match this year's product mix. We consider constant mix growth to be a more reliable way of looking at expense trends.
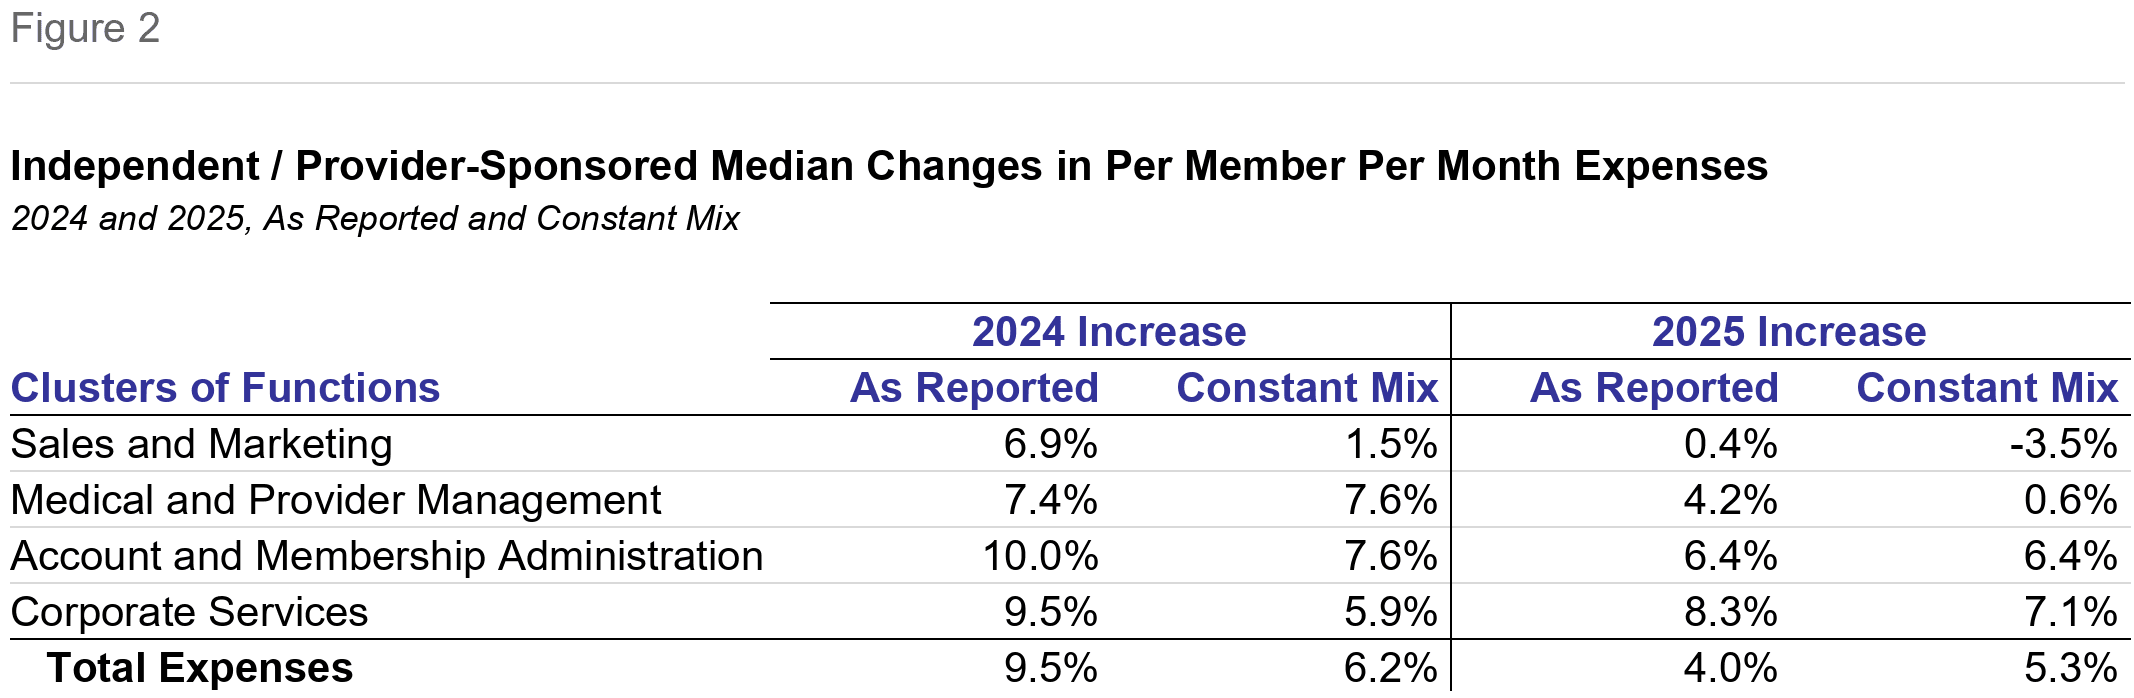
Both as reported and constant mix expense growth declined in 2025. Excluding the effect of changes in mix, total expense growth among continuously participating plans declined from 6.2% to 5.3%, 0.9 percentage points. Growth rates declined in every cluster except Corporate Services, which accelerated to become the fastest-growing cluster. The steepest declines were in Medical and Provider Management, followed by Sales and Marketing; Account and Membership Administration also had reduced growth.
Without adjusting for changes in product mix, the decline in growth was much sharper: 5.5 percentage points, to 4.0% from 9.5%. Compared with 2024, as reported growth was lower in every cluster, with Sales and Marketing diminishing most, followed by Account and Membership Administration and Medical and Provider Management. As reported median growth in Total expenses was below constant mix growth. For the individual clusters other than Account and Membership Administration, however, median as reported growth exceeded constant mix growth, consistent with the continued shift toward Medicare Advantage.
The 1.3 percentage point lower rate of growth in Total expenses on an as reported basis compared with a constant mix basis contrasts with recent years, when mix changes in favor of Medicare Advantage raised apparent growth. But, measured by the average rather than the median, the Total increase was 3.8% on a constant mix basis versus 5.4% as reported, a pattern more typical of a shift towards more expensive products.
Cost Trends Holding Product Mix Constant
In our view, trends that have the same plans in both comparison years and exclude mix changes are a more accurate representation of real trends in administrative costs. So the trend discussion in this Navigator emphasizes this approach.
Total expenses increased at a median rate of 5.3% compared with 6.2% last year. The effect of Pharmacy and Behavioral Health, included in the Figure 2 presentation, was to increase the rate of growth by 1.1% on a Constant Mix basis and reduce it by 0.1% on an as reported basis.
Key functions that contributed to expense growth were Claim and Encounter Capture and Adjudication, Finance and Accounting, Actuarial, Provider Network Management and Services and Enrollment / Membership / Billing. The declines in Marketing, Advertising and Promotion and Rating and Underwriting were the greatest offsets to growth.
Account and Membership Administration
Among clusters, the most important source of expense growth was again Account and Membership Administration, the largest cluster. Costs increased in this cluster by 6.4%, decelerating from 7.6% in 2024. The effect of Pharmacy and Behavioral Health, included in Figure 2, was to reduce the rate of growth by 0.2% on a Constant Mix basis and by 2.2% on an as reported basis.
The most striking change within this cluster — and among all functions — was Claim and Encounter Capture and Adjudication, which increased at a median rate of 26.9%, the fastest of any function in at least five years. Its staffing ratio was little changed, while compensation per FTE increased at a high single-digit rate, non-labor costs per FTE increased sharply and outsourcing increased by 5.8 percentage points of FTEs, the largest such increase of any function. Payment Integrity was an especially fast-growing subfunction.
Enrollment / Membership / Billing increased by 7.2%. Its staffing ratio was sharply lower while compensation was much higher, and outsourcing also increased sharply on average in this function (the median plan was little changed); excluding the effect of fewer FTEs, non-labor costs declined. Information Systems expenses, the largest function, grew by 3.8%, in line with its trend and below the total; because of its size it nevertheless remained an important contributor to growth. Compensation in Information Systems increased at a moderate rate, outsourcing declined slightly and, excluding the effect of lower staffing, non-labor costs also declined. Customer Services, the fastest-growing function a year ago, slowed to 1.3%; its staffing ratio increased by 5.0% while outsourcing declined, especially in Grievances and Appeals. Non-labor costs were higher in Printed Materials and in Grievances and Appeals.
Medical and Provider Management
The Medical and Provider Management cluster decelerated sharply, to 0.6% from 7.6% in 2024. Staffing ratios declined modestly and compensation growth exceeded inflation, while outsourcing was little changed.
The deceleration masks divergent trends between the cluster's two functions. Provider Network Management and Services accelerated to near double digits, while the far larger Medical Management / Quality Assurance / Wellness function grew in line with total trends. Within Medical Management, Medical Informatics grew especially rapidly, and Health and Wellness did so on average, while several plans reported declines in Case Management and Quality Components.
Corporate Services Cluster
The Corporate Services cluster is the smallest cluster, but it accelerated to 7.1% from 5.9% growth in 2024, making it the fastest-growing cluster. Compensation per FTE in this cluster increased faster than for any other cluster, at a double-digit pace, while the cluster staffing ratio increased slightly and outsourcing was up 0.7 percentage points.
Finance and Accounting was the fastest-growing function in the cluster, growing by double digits, and had a declining staffing ratio; non-labor costs per FTE increased at a double-digit pace. Actuarial grew by double digits: its staffing ratio increased at a double-digit rate, unique among the major functions, while compensation grew moderately. Corporate Executive and Governance also grew at a double-digit pace on a constant mix basis, led by Strategic Expenses; its staffing ratio also increased at a double-digit rate and compensation growth was especially strong, while non-labor costs, excluding the effect of staffing changes, declined. By contrast, the Corporate Services function itself (Human Resources, Legal, Facilities and similar activities) declined at a median rate of 1.0%, with staffing ratios down almost 10%, notably in Human Resources and Legal; a minority of plans had significant growth, however, so that the average plan posted PMPM growth. The Legal subfunction increased, especially Outside Litigation and All Other Legal, and the Audit, Purchasing, Risk Management and Other Corporate Services subfunctions also increased rapidly. Facilities expenses declined while results were mixed for Human Resources and Printing and Mailroom. Compensation tended to increase in this function, and outsourcing decreased in nearly every subfunction.
Sales and Marketing
The Sales and Marketing cluster of functions declined by 3.5% on a constant mix basis, compared with an increase of 1.5% in 2024. This is the slowest growth for this cluster in at least five years. Uniquely among clusters, staffing ratios, compensation growth restraint and outsourcing all worked in the same direction: outsourcing declined by 1.9 percentage points, the staffing ratio declined and compensation grew below the Total pace.
Advertising and Promotion declined by near double digits, its second consecutive decline. Marketing declined at a similar pace and Rating and Underwriting — which plans had emphasized a year ago — declined by mid single digits, with Risk Adjustment subfunction costs down at most plans. The Sales function was essentially flat. External Broker Commissions, up 1.2%, was the only function in the cluster to increase.
It should be noted that each of these plans operates with a different management approach depending in part on their individual market circumstances. For instance, one plan may choose to achieve the same efficiencies through Provider Contracting as another achieves using Medical Management so the trends described in measures of central tendency may not capture this nuance.
As Reported Trends
The following comments focus on differences in cost changes between the two sets of calculations that may be explained by the effect of mix changes, in addition to the underlying cost growth. As with constant mix changes, the increase was lower than last year, 4.0% versus 9.5%. Unusually, the as reported total growth was 1.3 percentage points below the constant mix growth of 5.3%, though average Total growth is greater. All clusters except Account and Membership Administration grew faster on an as reported basis than on a constant mix basis.
Sales and Marketing. As reported Sales and Marketing expense growth was the greatest difference from constant mix, at 3.9 percentage points greater, to +0.4%. An increase in Medicare Advantage is a possible explanation. External Broker Commissions grew 5.9% as reported versus 1.2% on a constant mix basis, becoming the cluster's most important increase on this basis.
Medical and Provider Management. This cluster grew 4.2% as reported versus 0.6% on a constant mix basis, a 3.6 percentage point difference, the second greatest among clusters.
Corporate Services. The Corporate Services cluster of functions grew faster on an as reported basis, 8.3% versus 7.1%. Actuarial, at 17.3% as reported, again exceeded its constant mix pace.
Account and Membership Administration. Uniquely, Account and Membership Administration grew at essentially the same rate on both bases, 6.4%. Excluding Pharmacy and Behavioral Health, however, its as reported growth of 8.6% exceeded the constant mix 6.6%, most notably in Enrollment / Membership / Billing; enrollment expenses are much higher for Medicare than Medicaid.
Growth and Product Mix
Among plans reporting in both years, the median growth in Medicare Advantage membership was 7.7% and Commercial HMO grew 8.7%, as Commercial Insured in total increased by 3.7% and ASO grew more slowly, at 1.6%. Medicaid HMO membership declined by 2.2% and POS declined by 12.0%. SNP decreased by 2.3% as CHIP increased by 5.3%. Medicare Supplement increased by 1.7%. Overall Comprehensive membership increased at a median rate of 1.0%.
Commercial membership dominates the product portfolio of Independent / Provider-Sponsored plans with a 2025 mean mix of 65.3%. Fully-insured was the greatest choice among IPS commercial customers with a mean of 44.7% of total membership; Self Insured or ASO was 20.6%. ASO products' costs are lower than for comparable insured products largely due to the comparatively modest per member Sales and Marketing expenses required for large groups that are eligible to use these products. An ASO group necessarily possesses the statistical advantages of larger size in bearing the medical cost variance risk: this also means that group Sales and Marketing costs are spread through greater numbers of members.
HMO was the dominant commercial insured product at a mean of 33.6% of membership, with Indemnity and PPO at 7.1% and POS at 4.0%. Medicare Advantage, including SNP, comprises a mean of 10.5% of Comprehensive members: 10.0% conventional Medicare Advantage and 0.5% SNP. The Medicare Supplemental product has a mean share of 3.1% of Comprehensive membership. The mean proportion of Medicaid members was 21.1%; Medicaid is offered by 9 of the plans.
Trends in Factors Driving Costs
The operational drivers provide additional insights to cost trends. The drivers discussed in this section are estimated staffing ratios, compensation, non-labor costs and propensity to outsource excluding Behavioral Health and Pharmacy. We previously touched on their impact on some of the functions themselves.
The average change in staffing ratios among continuous plans was a decline of 5.4%. Among all 13 plans, the median staffing ratio was 28.3 Combined FTEs per 10,000 members (this includes the effects of outsourced staffing1) and 27.8 for Commercial Insured Members2, both excluding Behavioral Health and Pharmacy. Mean compensation was up by 10.2% among continuous plans; among all plans, the median was $124,000 including benefits. The mean outsourced share of FTEs increased by 0.9 percentage points among continuous plans; among all plans outsourced FTEs have a median of 14.5% of combined FTEs. Non-labor costs per FTE were little changed on average: excluding the effect of lower staffing ratios, non-labor costs declined by 5.9%.
On a constant universe basis, staffing increased in Actuarial, Corporate Executive and Governance, Customer Services and Claim and Encounter Capture and Adjudication, and declined in Rating and Underwriting, Advertising and Promotion, the Corporate Services function, Medical Management, Enrollment and Finance and Accounting. Compensation growth was strong in Sales, the Corporate Services function, Finance and Accounting, Rating and Underwriting, Claim and Encounter Capture and Adjudication and Medical Management.
Costs of Independent / Provider-Sponsored Plans, by Cluster, PMPM
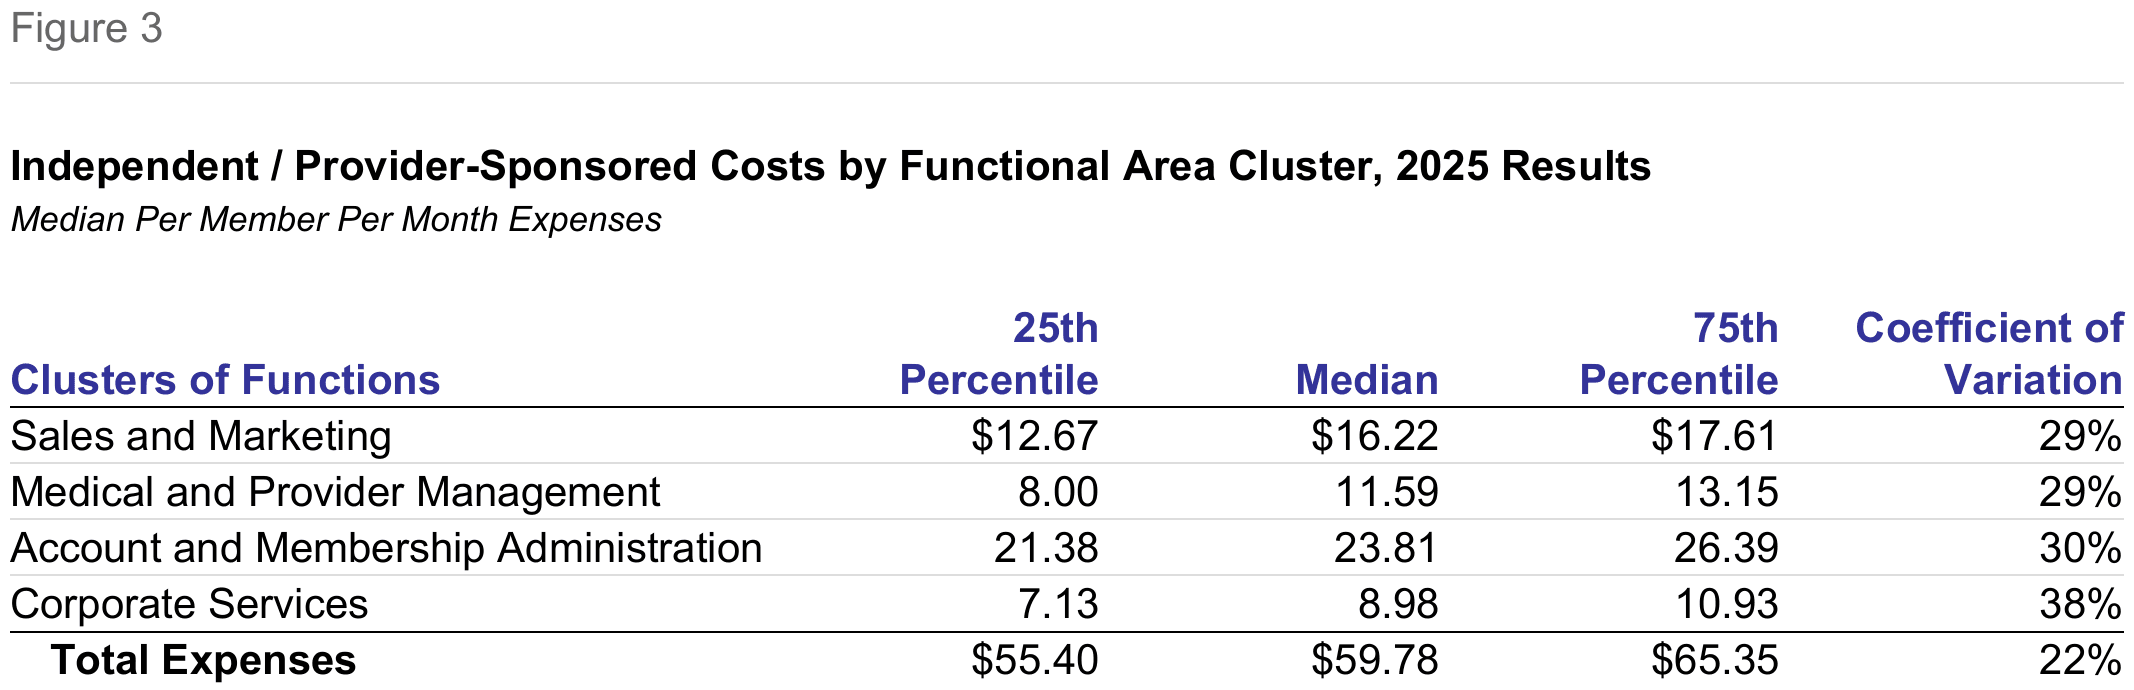
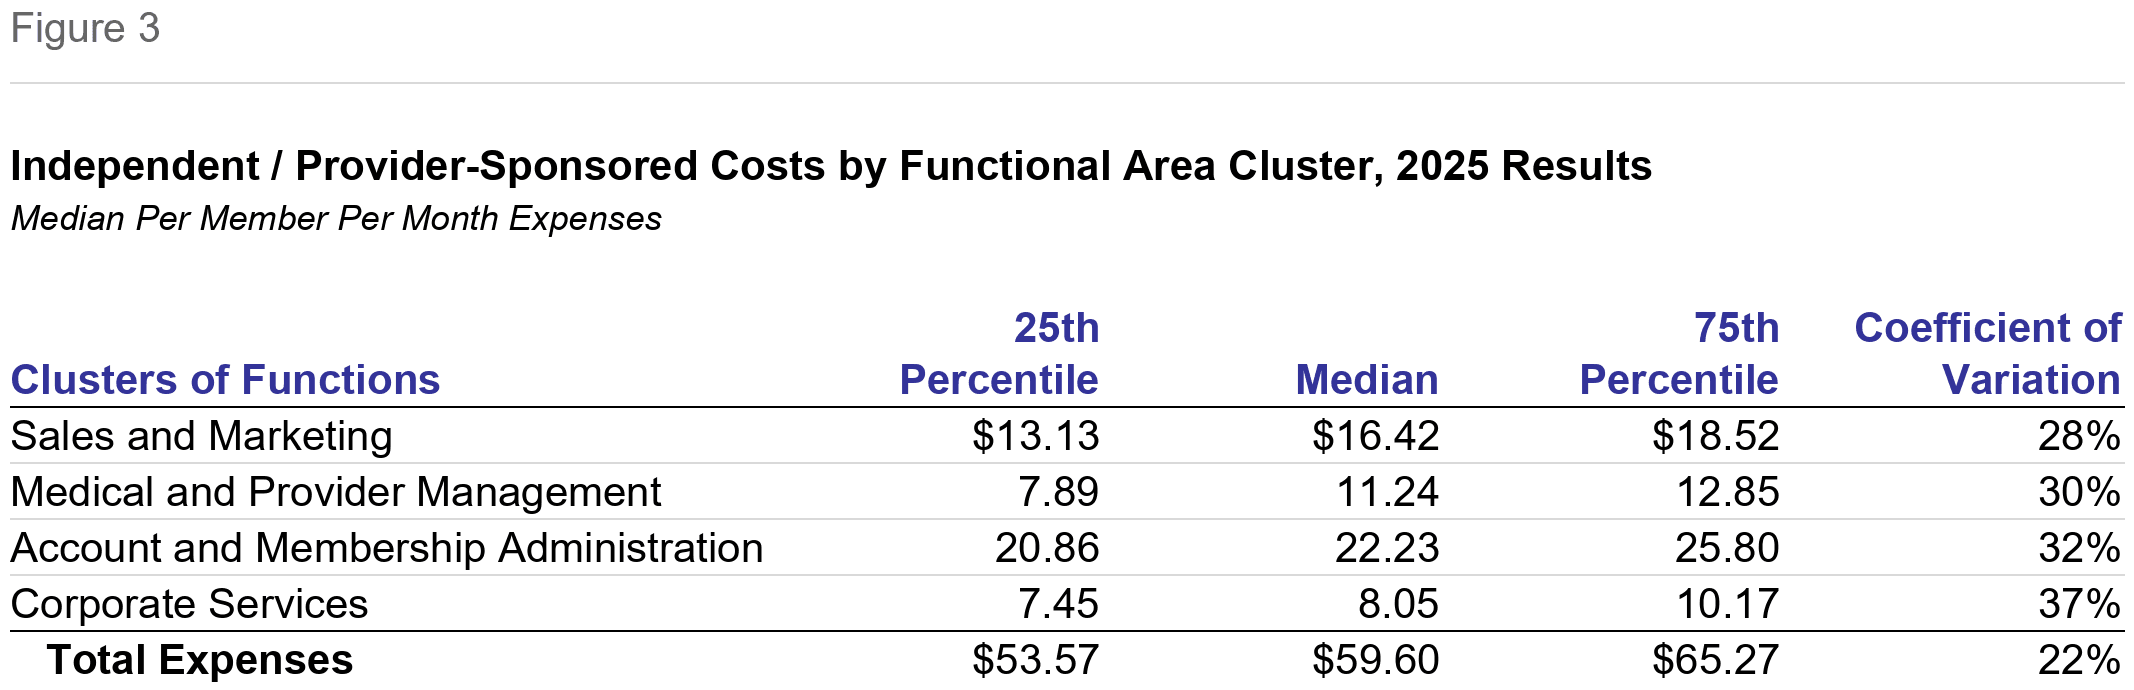
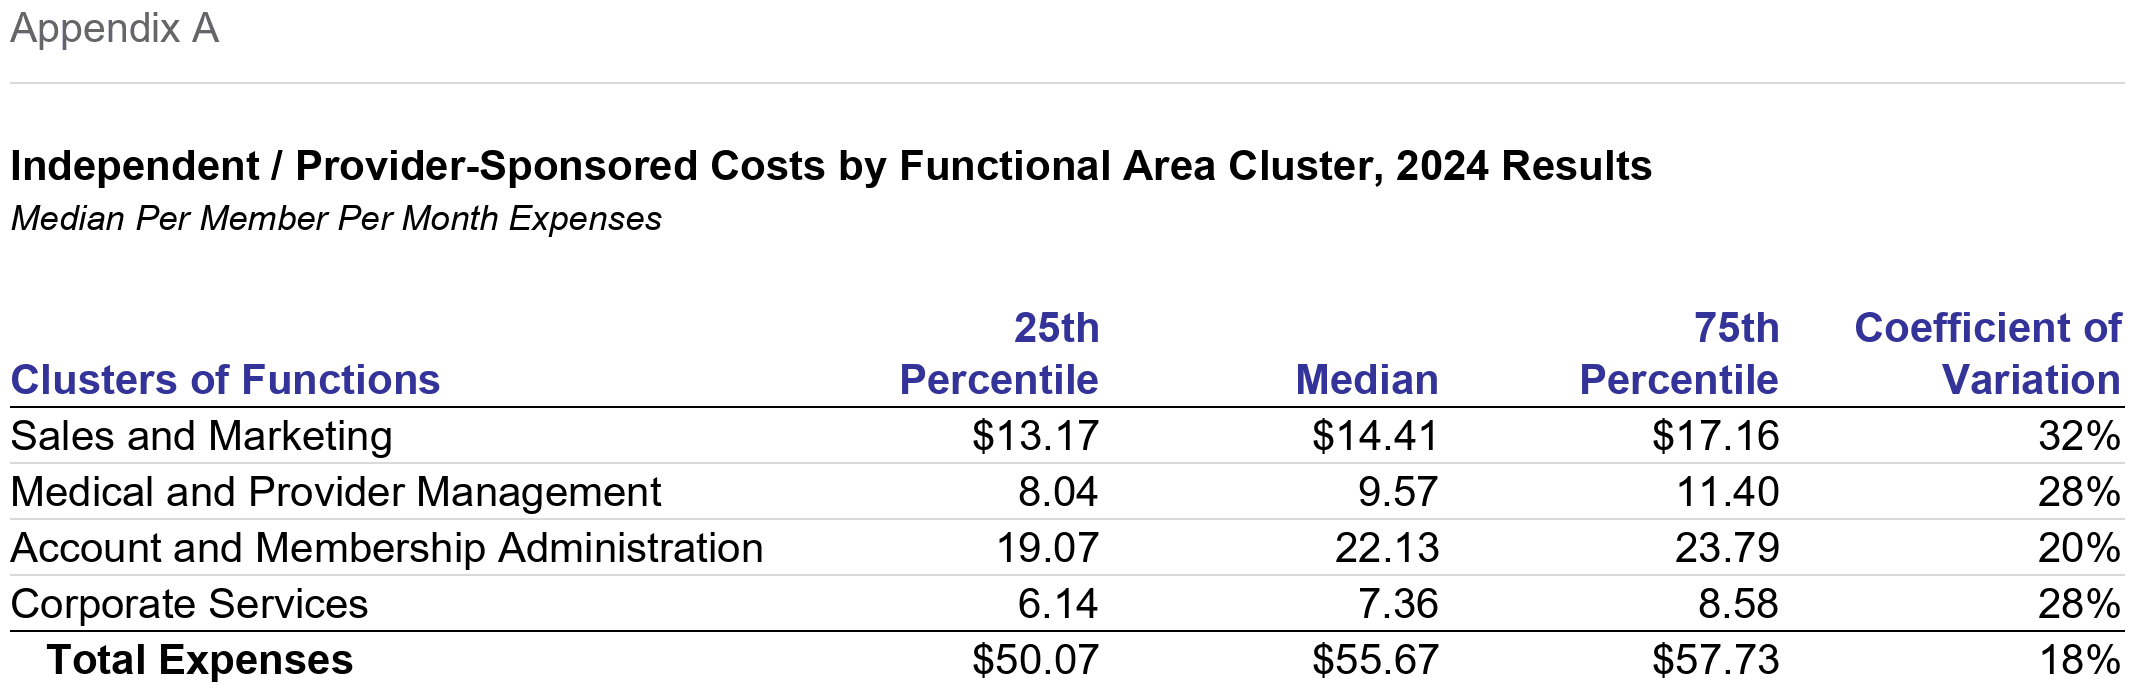
Figure 3 shows the median Independent / Provider-Sponsored Plan had total administrative expenses of $59.60 for all plans, 7.1% greater than the $55.67 reported last year. This was the result of expense growth in identical plans, holding products constant, of 5.3%, less a 1.3% difference due to mix changes bringing as reported growth to 4.0%, plus the effect of the addition of four plans and the deletion of three plans, each with their own product mixes. The prior year values are shown in Appendix A. The changes shown in Figure 2 are a better measure of trend.
Sales and Marketing had the highest increase over last year's median, of 13.9% to $16.42 PMPM — even though it declined at the median continuous plan — illustrating the limited relationship between panel medians and constant plan growth. Medical and Provider Management was higher by 17.5% to $11.24 PMPM. Account and Membership Administration was little changed at $22.23 PMPM. Corporate Services increased 9.4% to $8.05 PMPM.
The coefficient of variation for Total expenses increased to 22% from 18%, and the difference between 25th and 75th percentiles widened by $4.04 PMPM, reflecting the more diverse panel.
Costs of Independent / Provider-Sponsored Plans, PMPM by Product
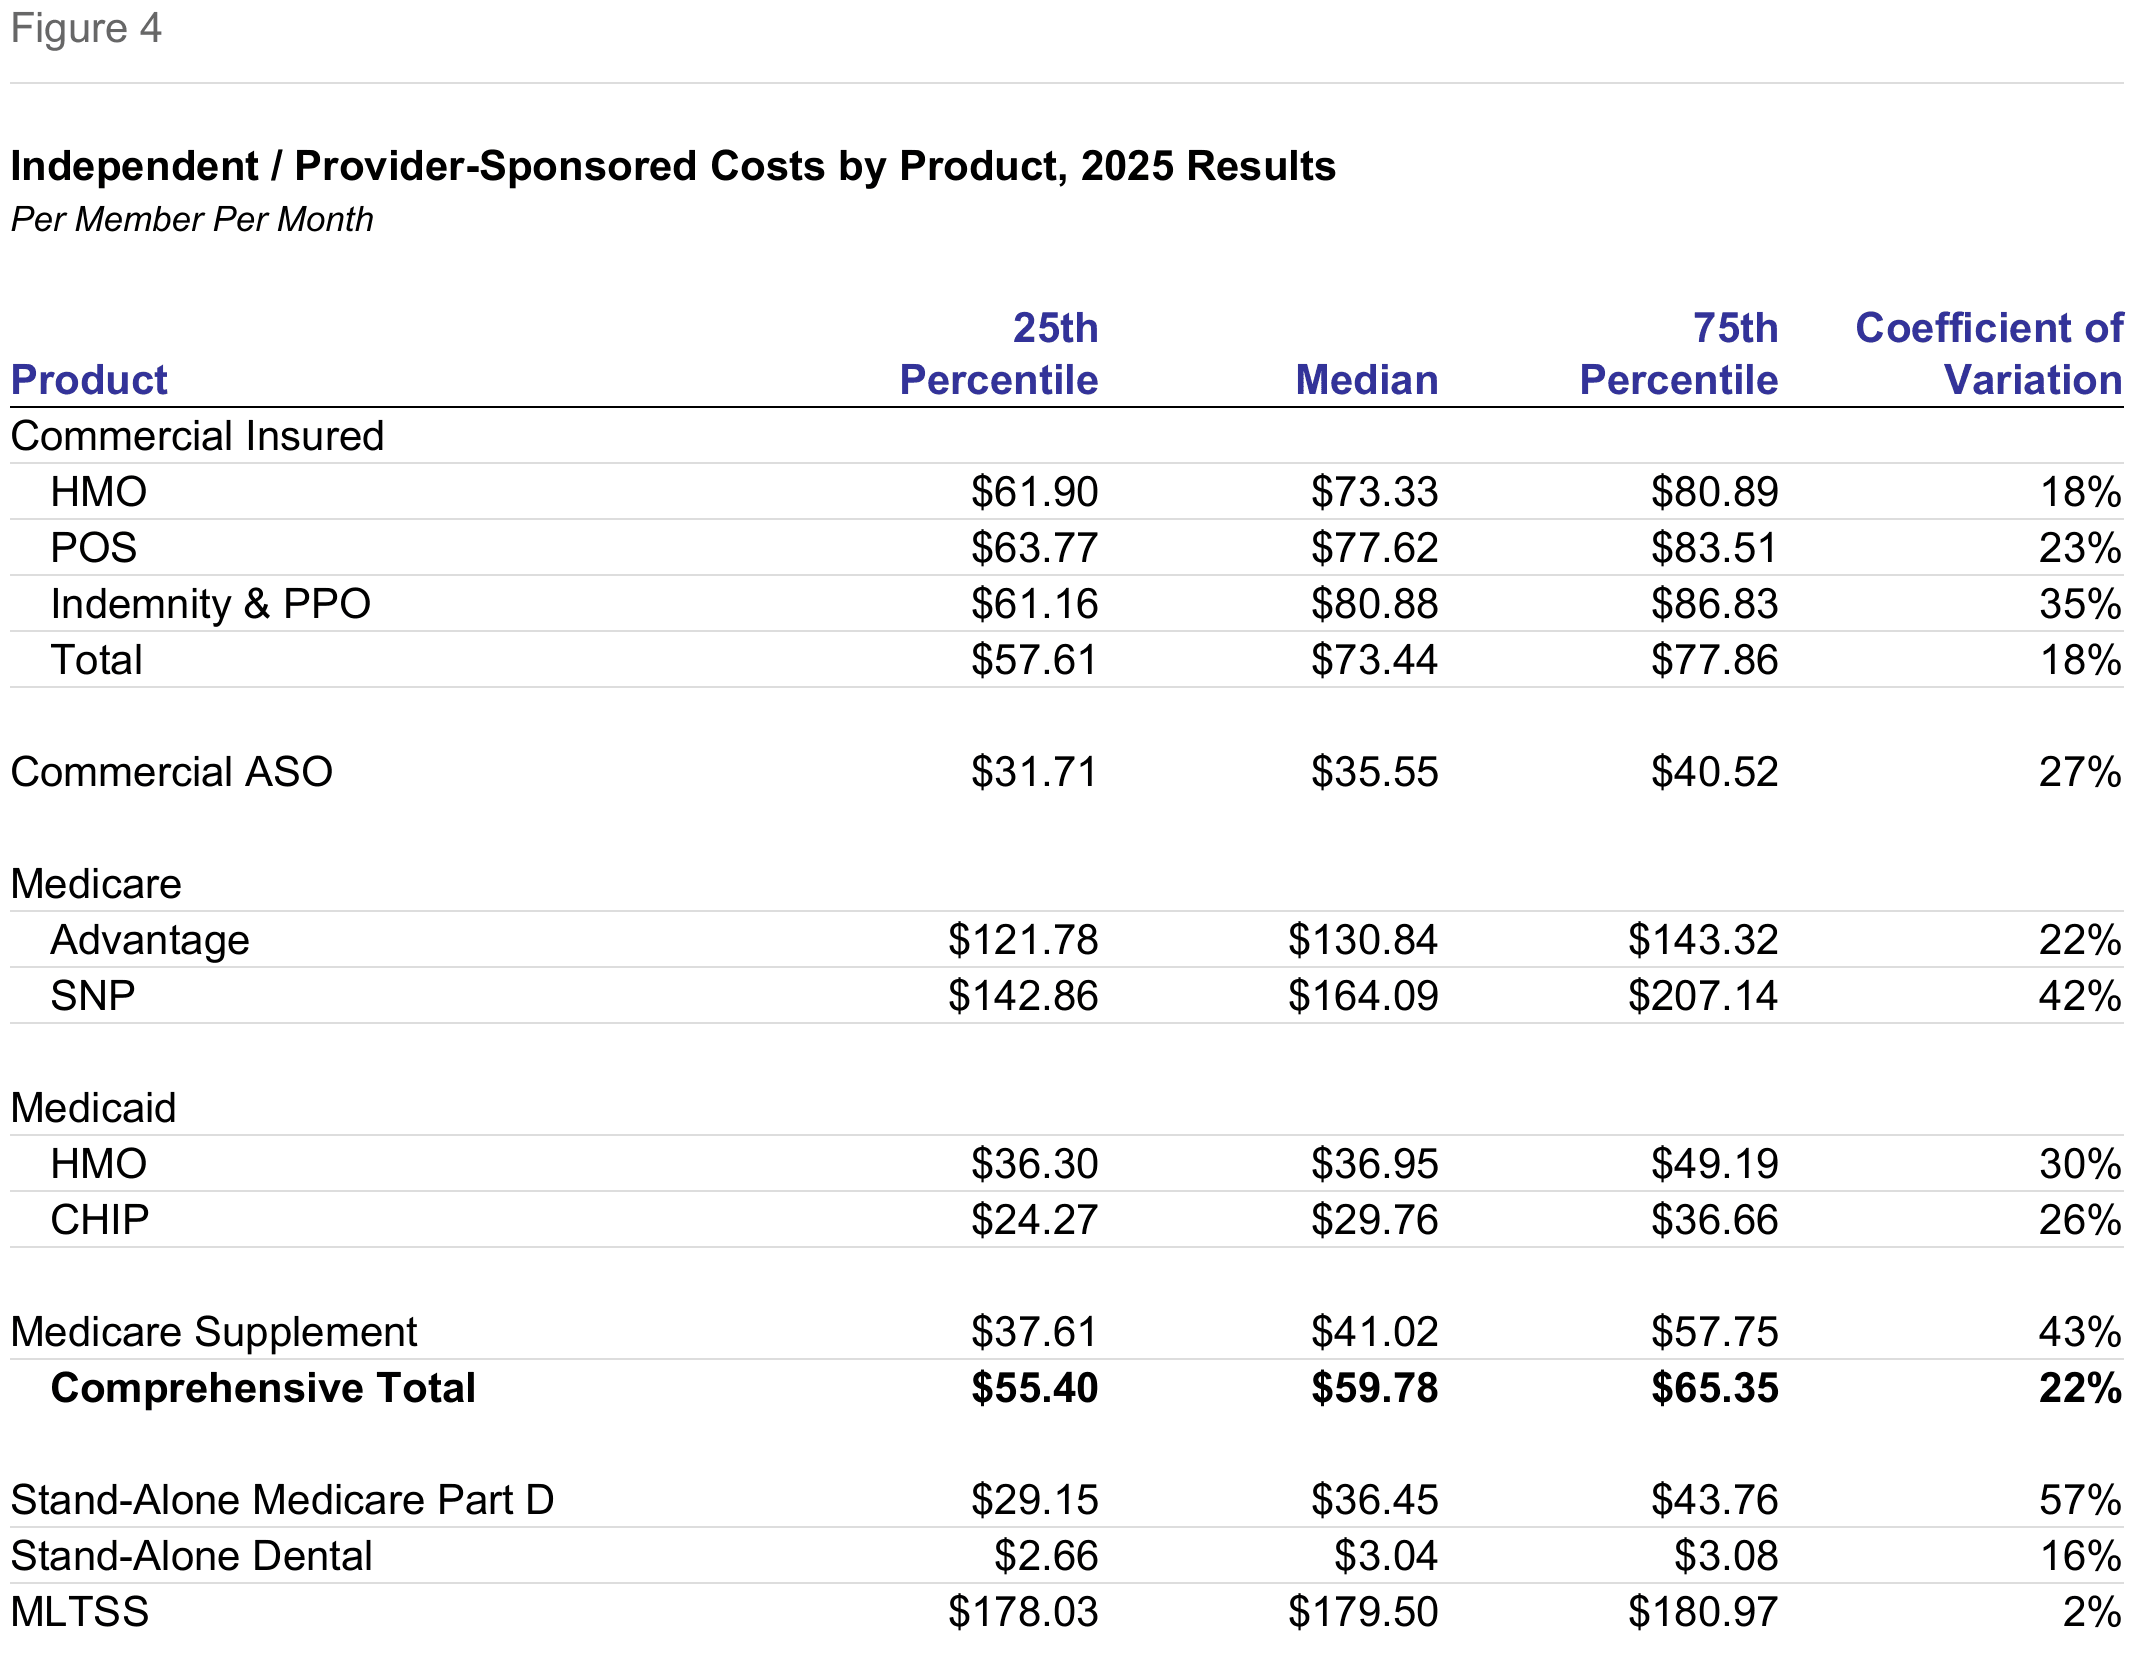
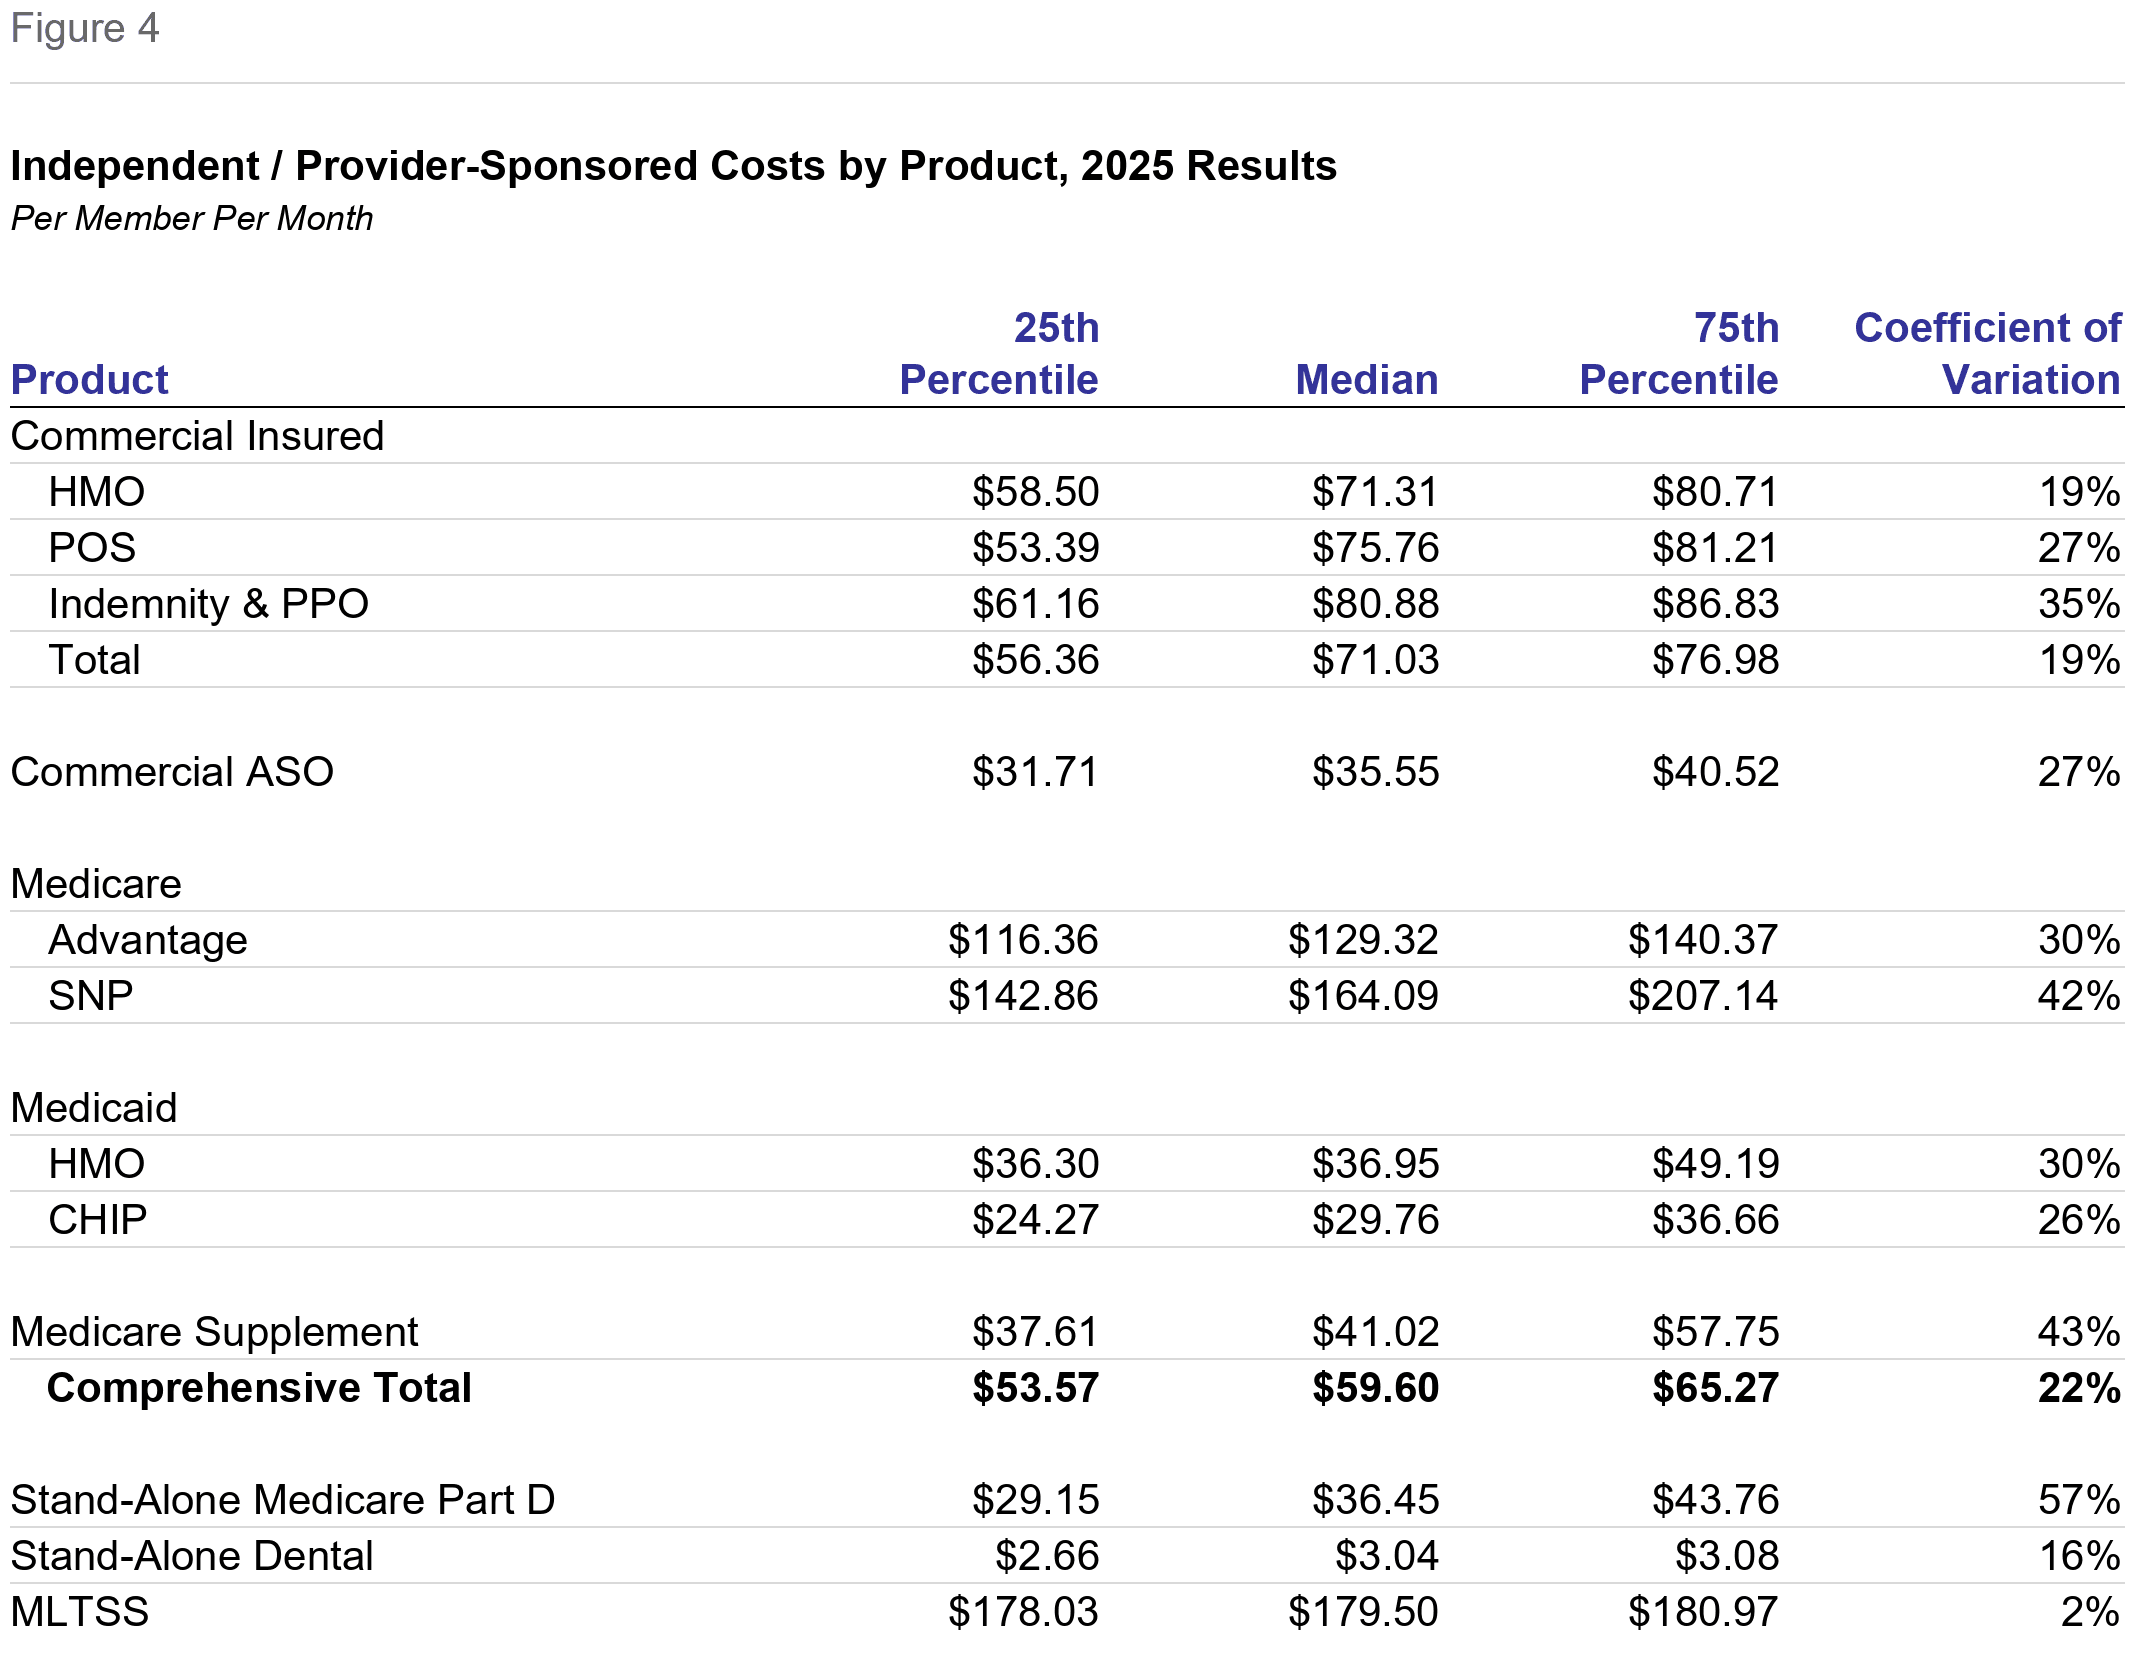
We have emphasized consideration of the product mix when considering the cost trends: we have given primacy to trends derived by reweighting prior year total costs by eliminating the effect of mix differences between any two comparison years. Figure 4 shows that, while PMPM expenses are $59.60 PMPM, the product costs are different, ranging from Medicaid CHIP at $29.76 to Medicare SNP at $164.09. We think these differences arise from factors of population requirements, characteristics of the benefit plan sponsor and the scope of benefits.
Population Requirements
Commercial Insured products range in median costs from $71.31 for HMO to $80.88 for Indemnity and PPO, with POS at $75.76; the median for all Commercial Insured products was $71.03.
Insured products have substantial marketing expenses, as does Medicare Advantage, and individuals represent significant portions of such members. The most important difference between the Commercial Insured products and Medicare Advantage is that Medicare members are older, and so have higher health care costs. MA's closest comparable Commercial Insured product is HMO, at $71.31, and MA is $129.32 or 1.8 times HMO. Recall that Medicare Advantage products were typically among the fastest growing.
SNP products reflect a similar premium due to health care needs. SNP members face greater expected health needs than the MA population. At $164.09 PMPM, their administrative expenses are 1.3 times that of Medicare Advantage.
By the same token Medicaid HMO and Medicaid CHIP are relatively low cost products. At $36.95 and $29.76 respectively, they serve populations disproportionally of mothers and babies, and children. Medicaid HMO was 4% higher than Commercial ASO, which like ASO has more modest Sales and Marketing costs.
Benefit Plan Sponsor Requirements
The administrative costs of health plan products also reflect the buyer of insurance. Commercial ASO products, with administrative expenses of $35.55 PMPM, are purchased by groups that are large enough to self-insure: the same size advantages that permit group assumption of risk also allow Sales and Marketing and other costs to be spread over more members. Commercial Insured products' administrative costs are 2.0 times that of ASO.
Scope of Benefits
Products with limited scope of benefits can have lower administrative costs. Medicare Supplement offers to Medicare members coverage for health care costs that Fee-for-Service Medicare does not cover. In providing this coverage, Medicare Supplement products execute some but not all tasks of being the primary carrier, Medicare. For instance, Medicare Supplement pays claims but some aspects of claims processing have been already executed by the Medicare program. Medicare Supplement, at $41.02, is 32% of the administrative cost of Medicare Advantage even though the population served is similar.
Costs of Independent / Provider-Sponsored Plans, Percent of Premiums by Product
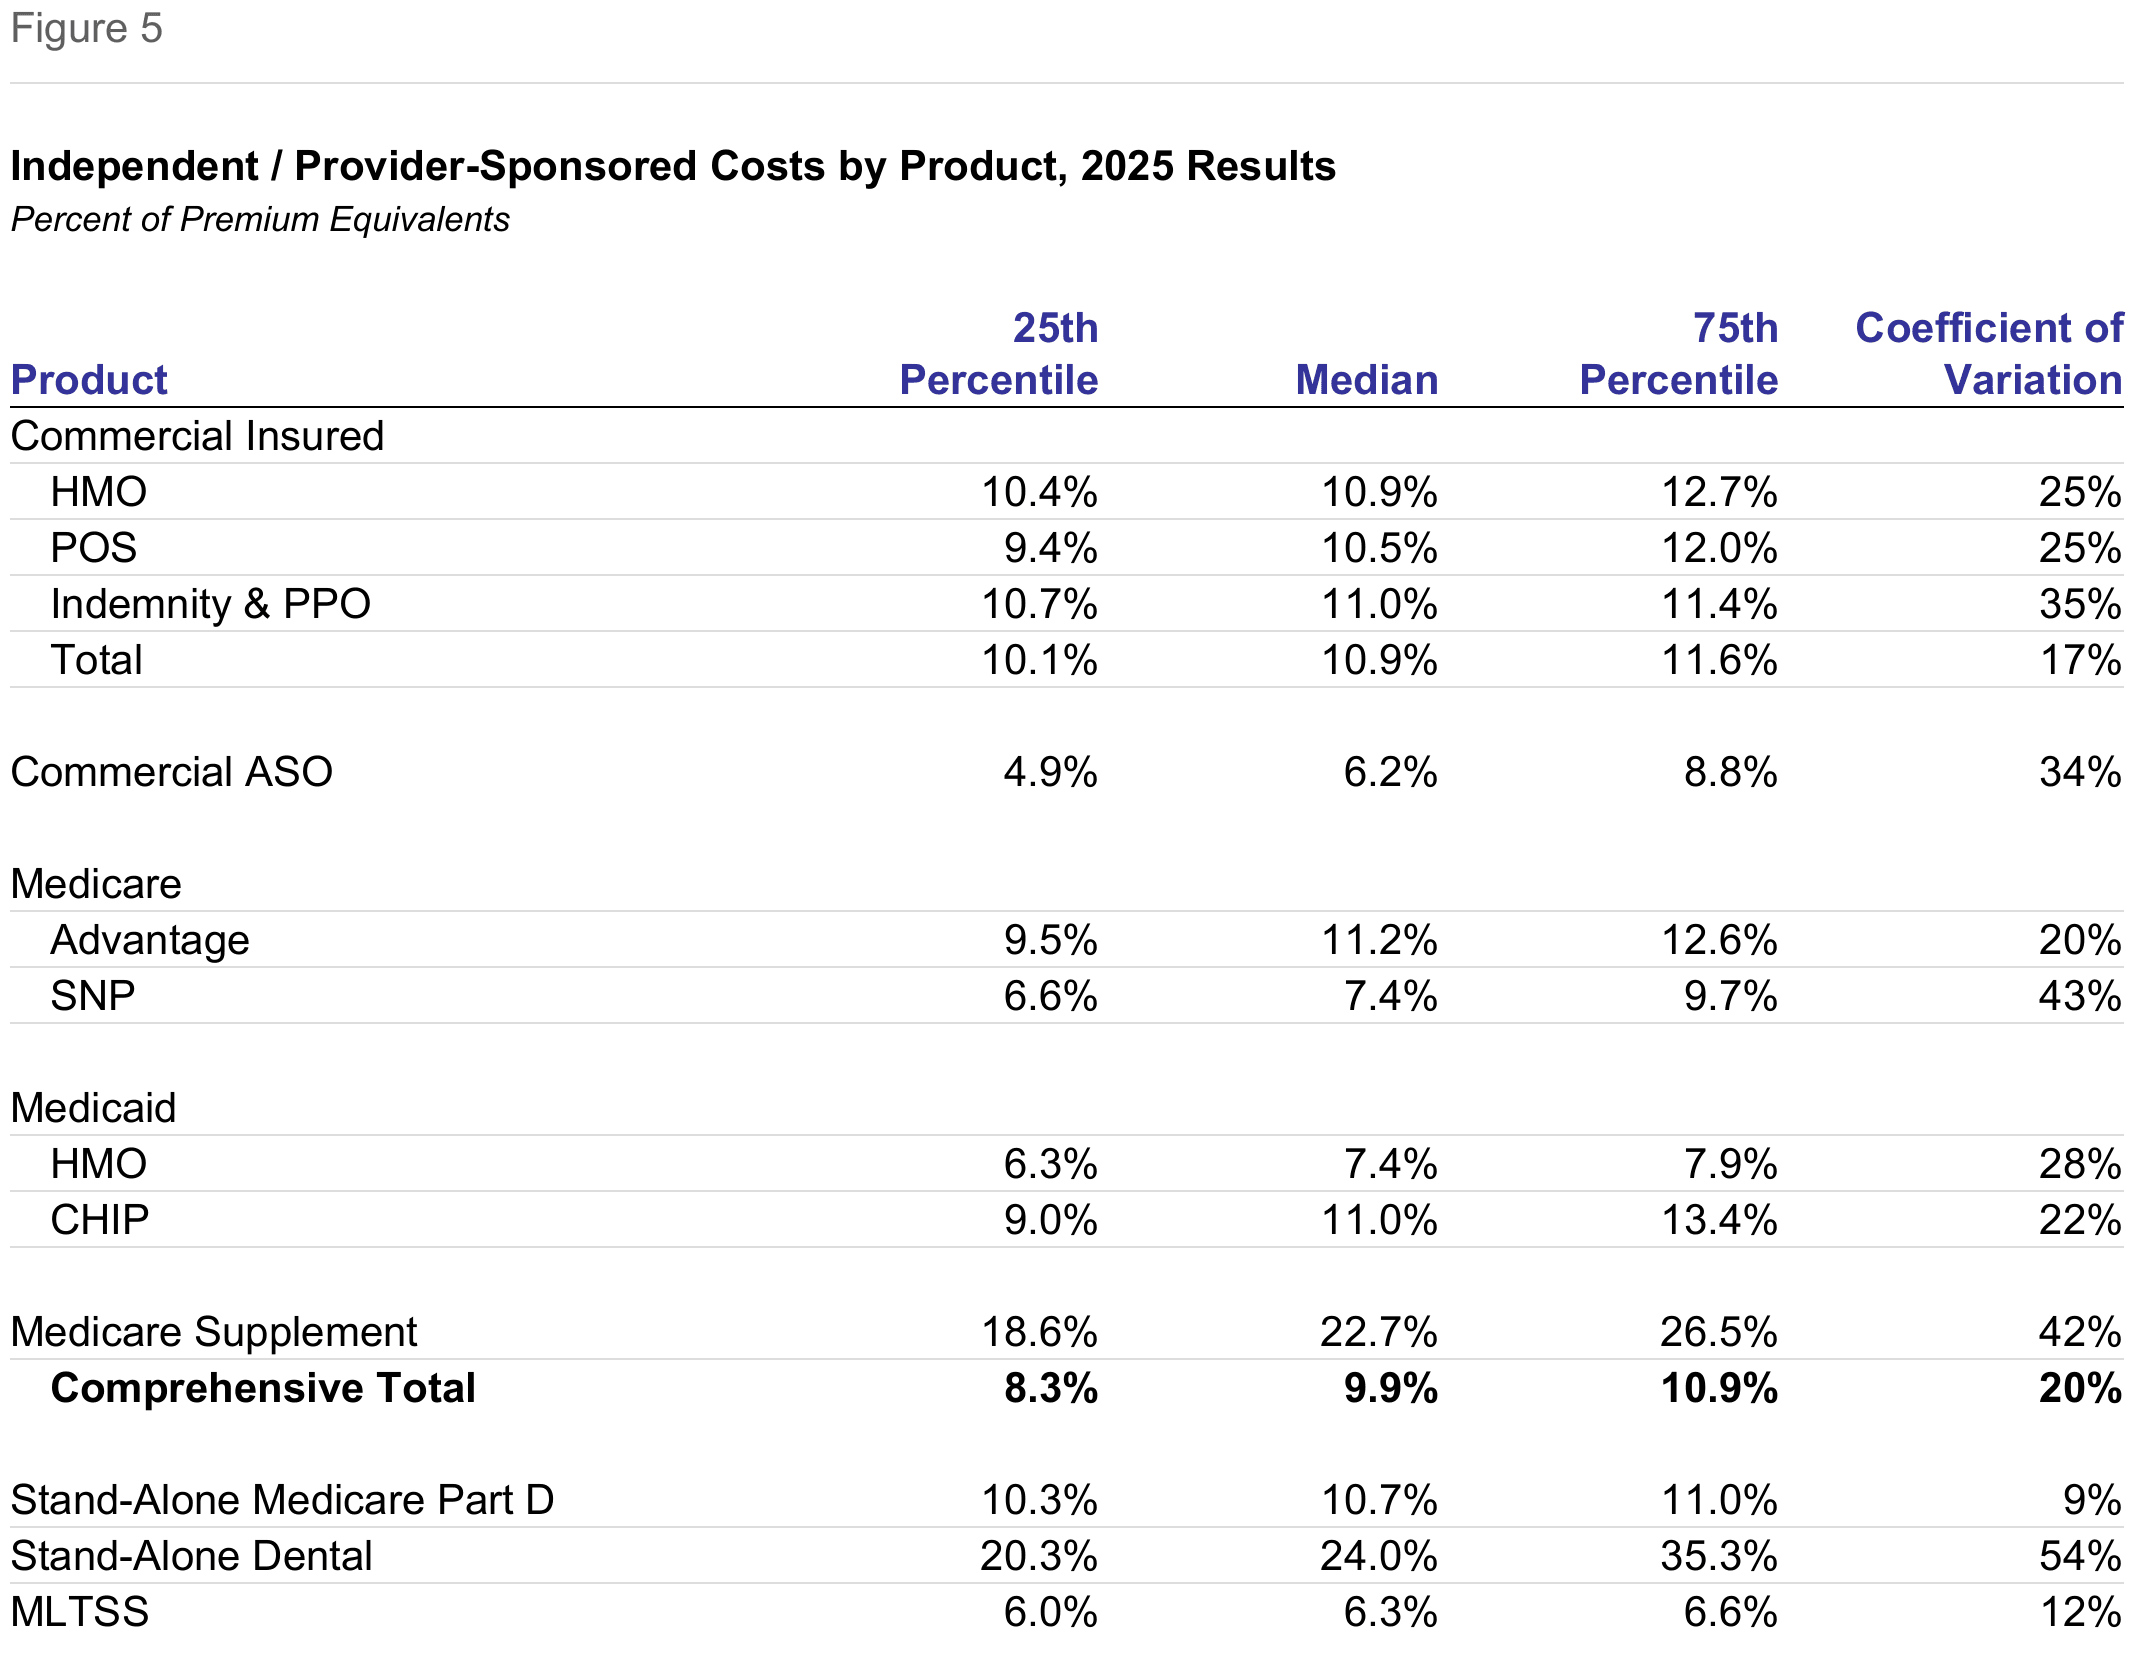
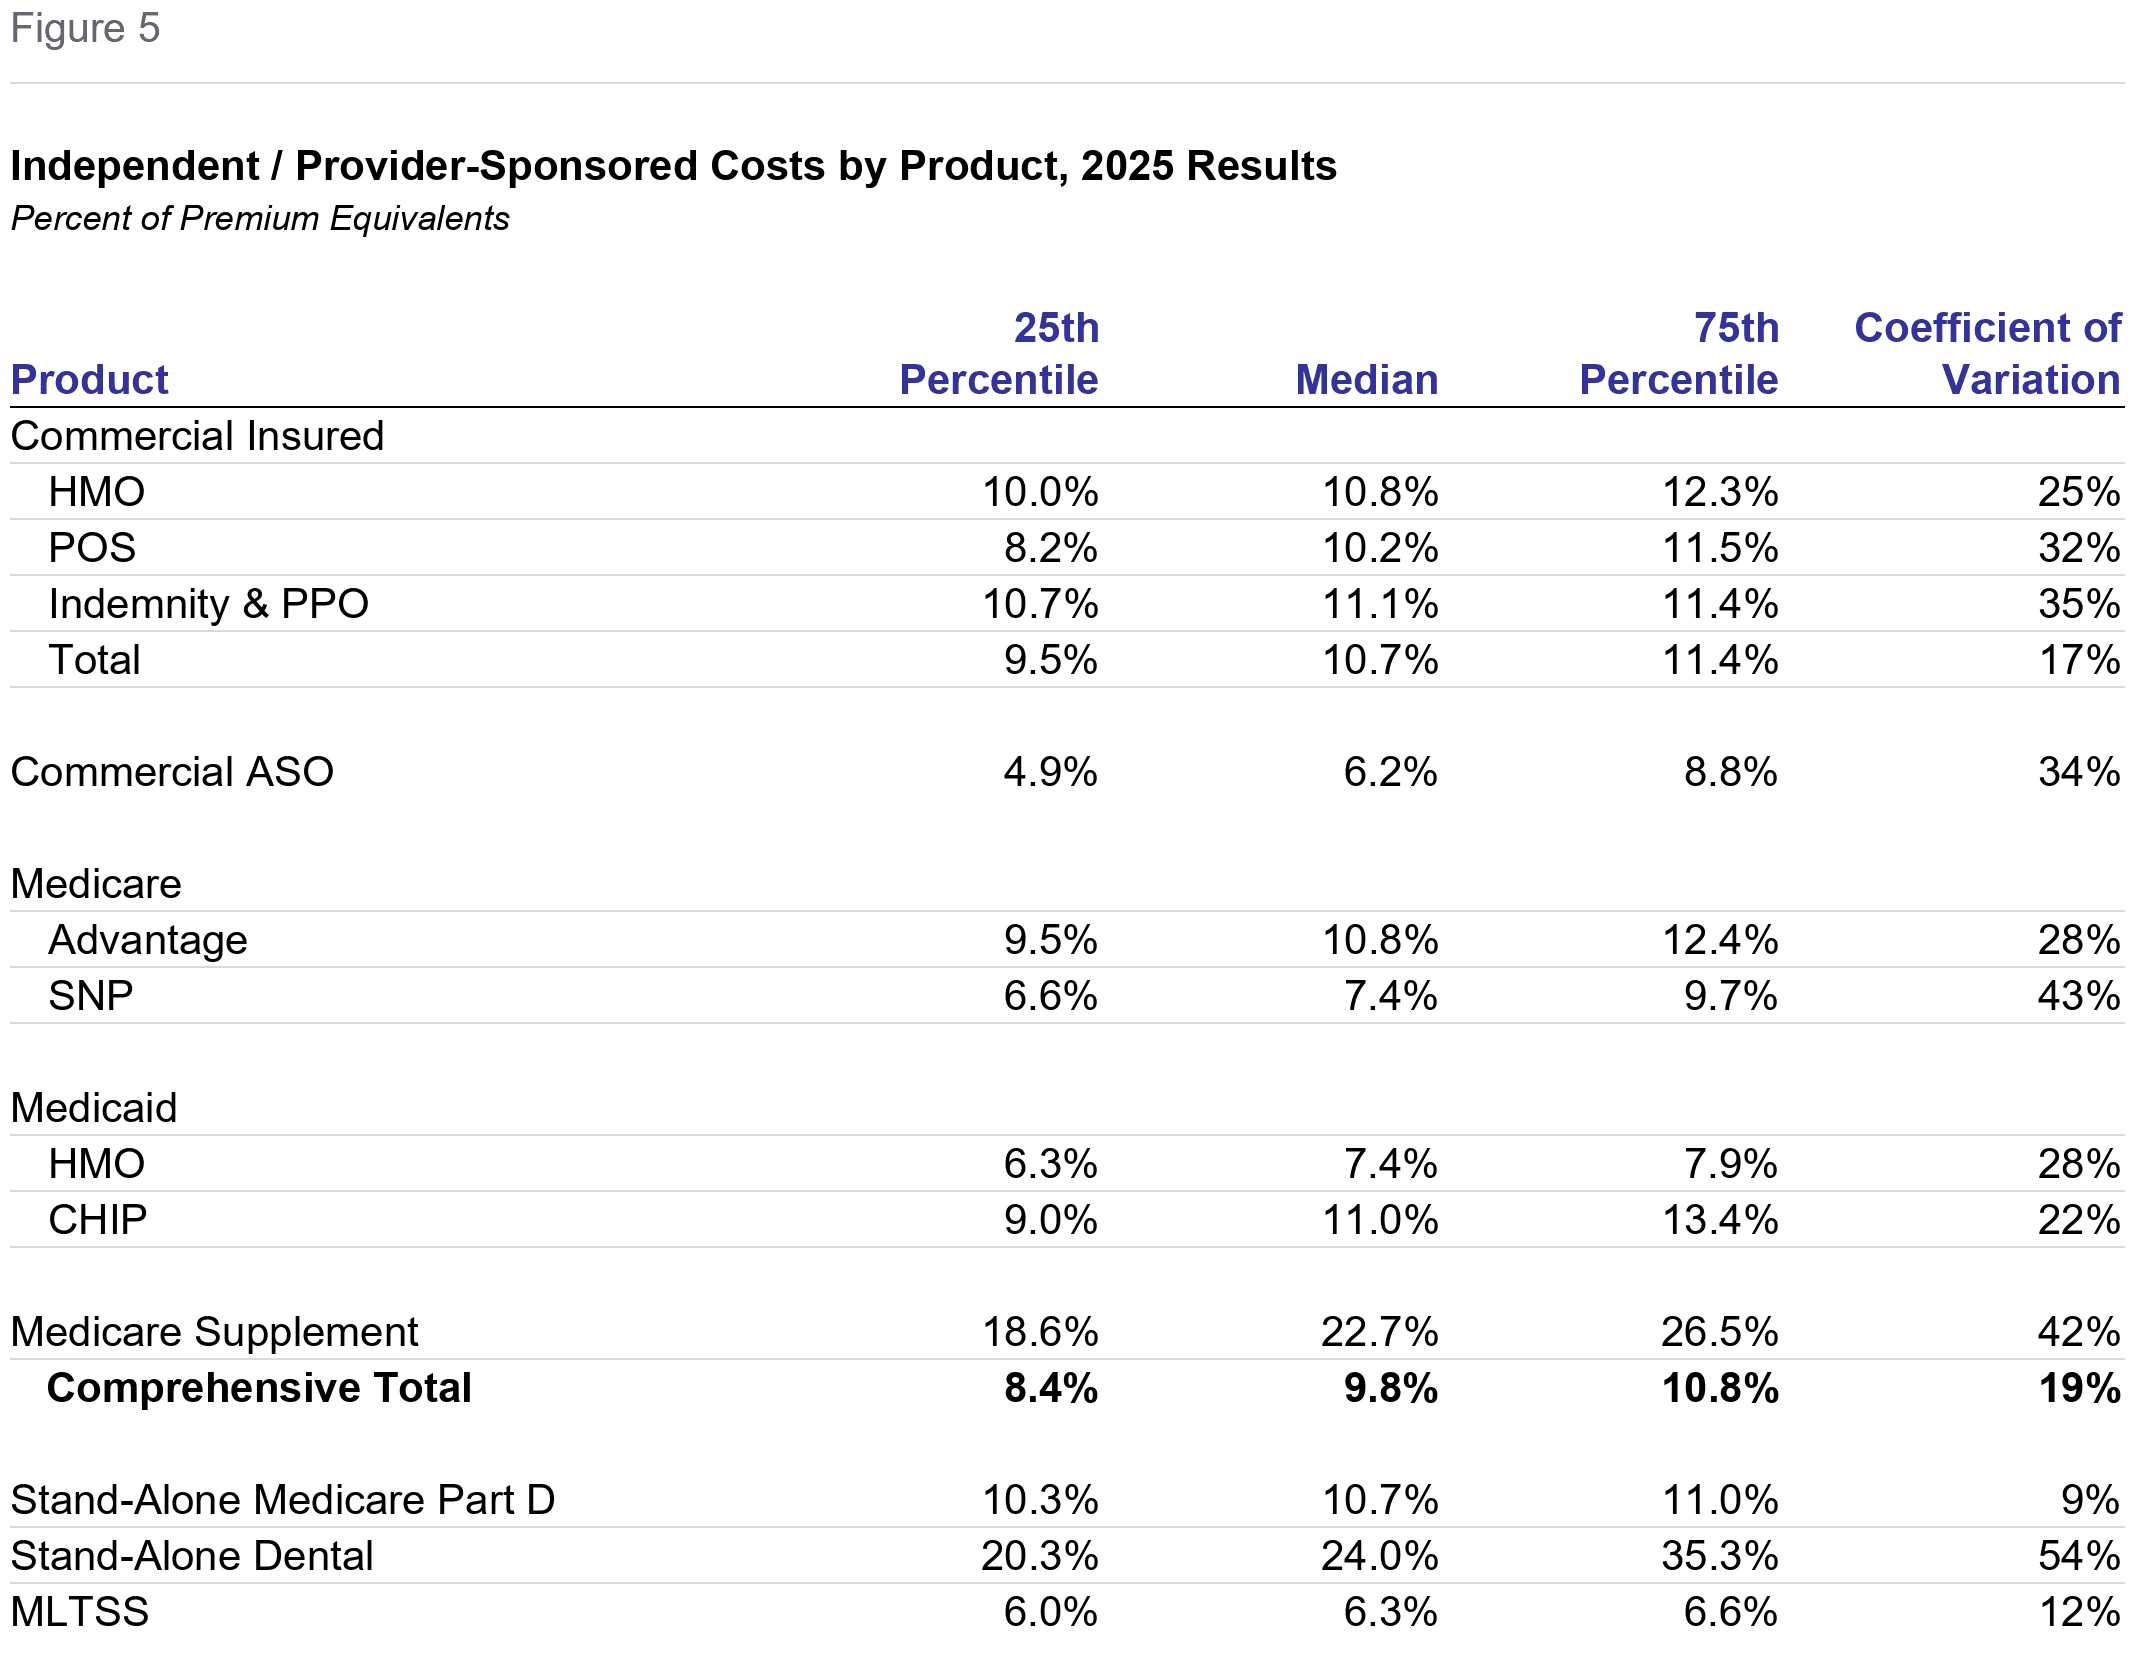
The effects of population requirements, characteristics of the benefit plan sponsor and the scope of benefits change when expenses are considered relative to premiums. In the ratios displayed in Figure 5 and in Figure 6 which follows, "premiums" are expressed as premium equivalents in self-insured products. We calculate premium equivalents as the sum of fees paid by self-insured groups plus the health benefits associated with those groups. That is, we add health benefits to ASO fees for that product's denominator. While this is not GAAP, it is more intelligible for the limited purpose of understanding administrative expenses across products.
Population Requirements
Commercial Insured products' costs ranged from 10.2% for POS products to 11.1% for Indemnity and PPO. HMO was 10.8%. Using the percent of premium approach, the difference between Medicare Advantage at 10.8% and Commercial HMO at 10.8% disappears entirely, compared with the 81% difference on a PMPM basis.
This increased clustering is because of two factors. First, the premium or equivalent denominator is comprised mainly of health benefits, that is, a health benefit ratio of normally 80-90%. Second, many administrative expenses are linked to the health needs of the population served. These include claims, customer services, medical management and the information systems necessary to support them. The remaining differences stem largely from distribution systems' expenses and, for Medicare Supplement, the scope of benefits.
SNP, at 7.4% of premium equivalents, was below Medicare Advantage, also illustrating the relationship between health and administrative expenses. Medicaid HMO was 7.4% of premium equivalents, a 19% premium to ASO, higher than the 4% difference on a PMPM basis. CHIP was 11.0% of premiums.
Benefit Plan Sponsor Requirements
The relationships between ASO and commercial insured on a percent basis were more similar on a percent of premium than PMPM basis. At 6.2%, ASO administrative costs were 50% of Commercial Insured on a PMPM basis; for percent of premium, they were 58%.
Scope of Benefits
Medicare Supplement shows that the limited scope of benefits shifts its ranking from low cost on a PMPM basis, to high cost on a percent of premium basis. Its costs were 22.7% of premium equivalents, vastly greater than any other product. Stand-Alone Dental, the lowest cost product PMPM, was the highest cost measured as a percent.
Costs of Independent / Provider-Sponsored Plans, Expense Clusters as a Percent of Premium
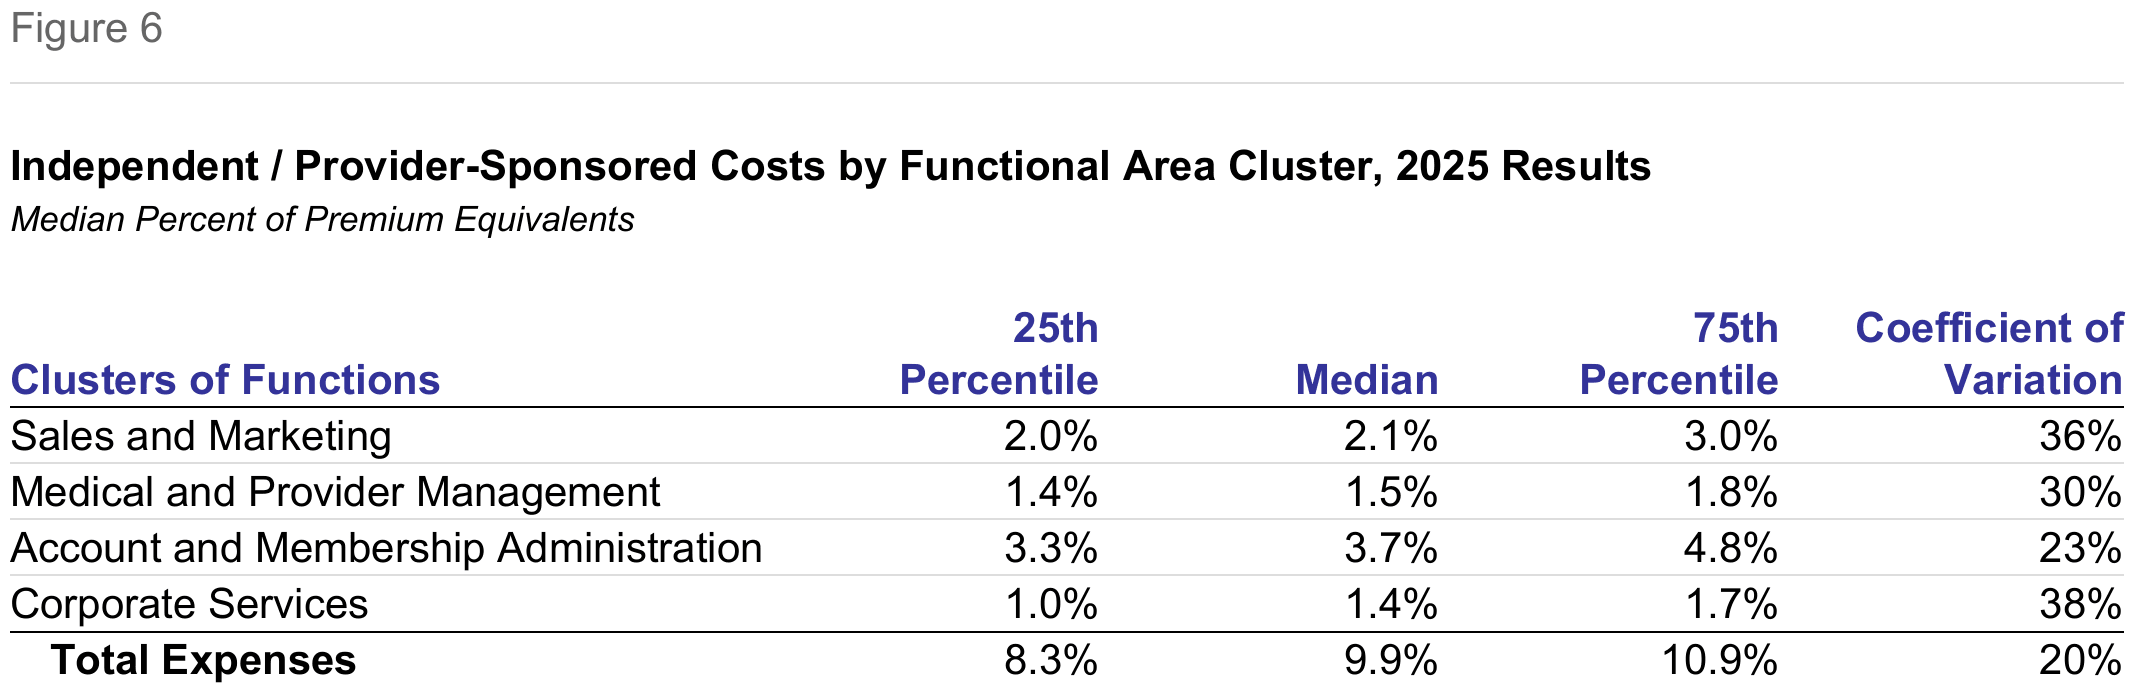
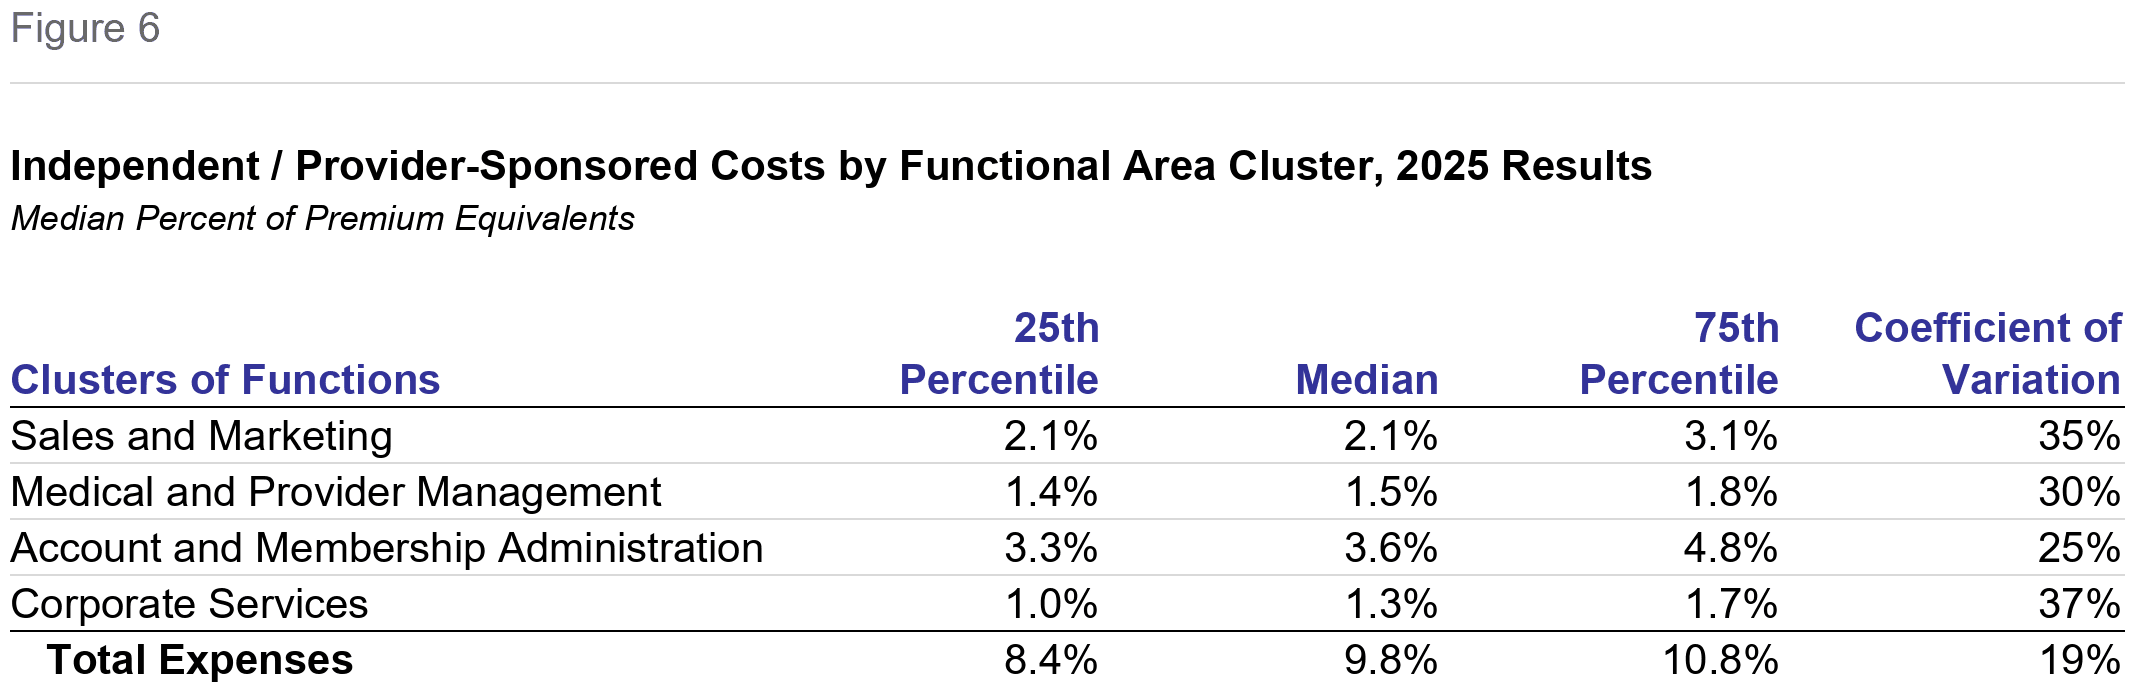
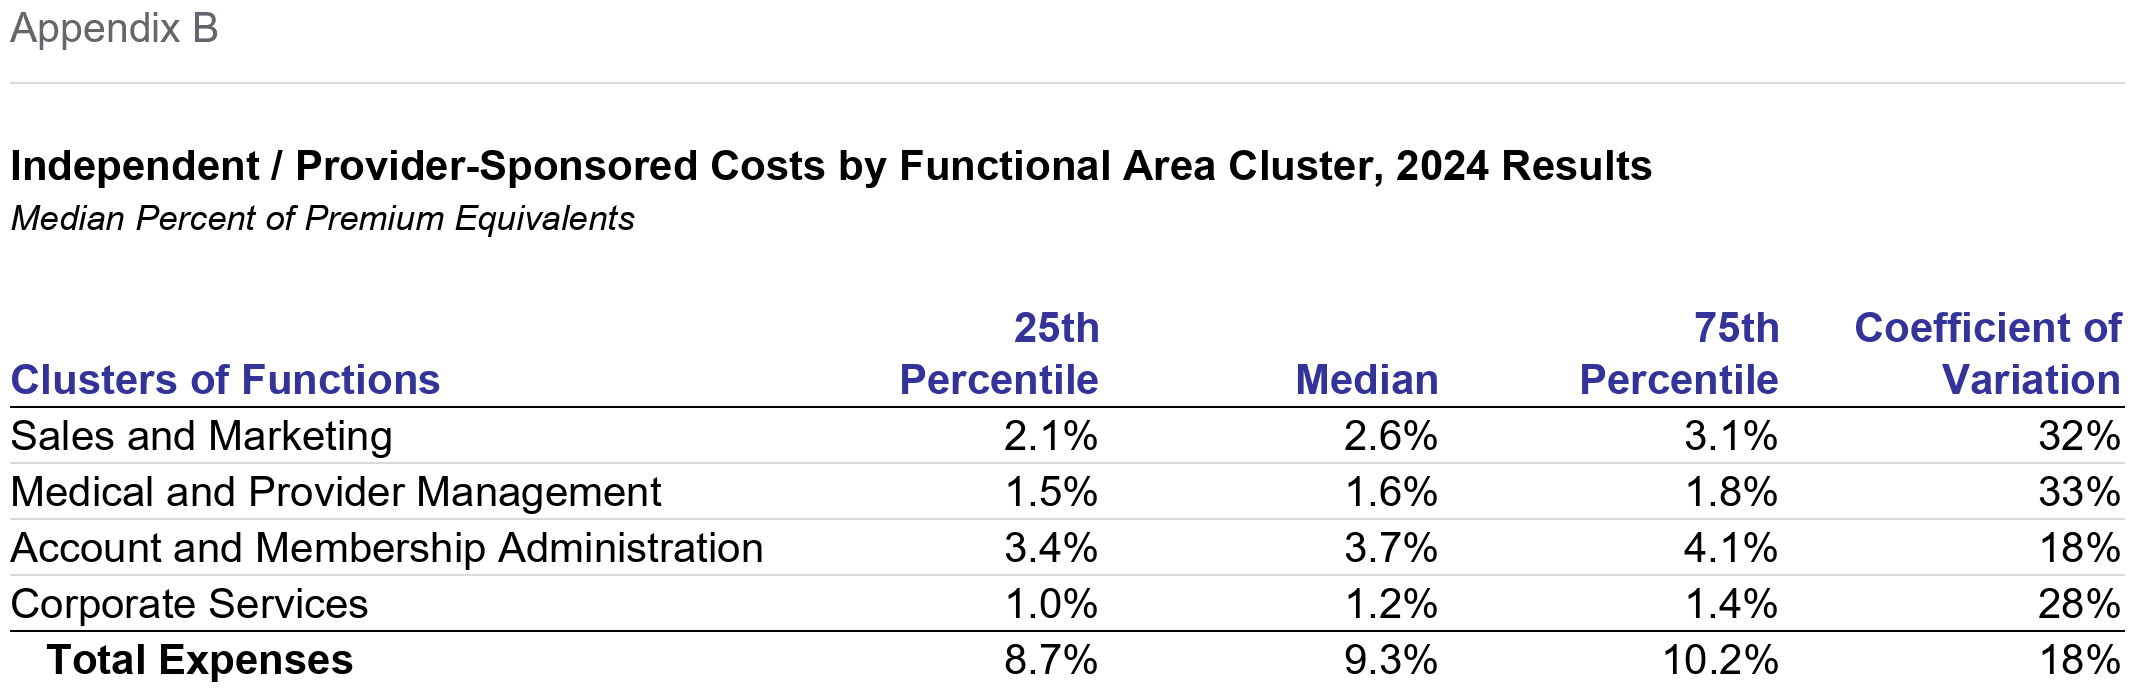
The administrative expenses were 9.8% of premiums, as shown in Figure 6, 0.5 percentage points greater than for the prior year. Account and Membership Administration was 3.6%, a 0.1 point decrease from last year. The median Sales and Marketing expenses as a percent of premiums was 2.1%, 0.4 percentage points below last year. Medical and Provider Management was, at 1.5%, 0.1 point lower than last year. Corporate Services, at 1.3%, was 0.1 point higher than the prior year. There is no discernable relationship of these ratios to cost growth, unsurprising since both universes and product mixes changed.
The coefficient of variation for Total expenses increased slightly, to 19% from 18%, and the difference between 25th and 75th percentiles increased by 0.9 percentage points.
How We Performed This Analysis
Characteristics of the Independent / Provider-Sponsored Plans Universe
This analysis is based on the twenty-ninth annual edition of our performance benchmarks for health plans. The Sherlock Benchmarks (Sherlock Expense Evaluation Report or SEER) represents the cumulative experience of more than 1,000 health plan years.
Each peer group in the Sherlock Benchmarks is established to be relatively uniform. So, within that constraint, participation is open to all Independent / Provider-Sponsored plans possessing the ability to compile high-quality, segmented financial and operational data. We surveyed the participants to populate the Sherlock Benchmarks and this summary.
This 24th analysis of IPS plans is based on a peer group of thirteen plans who collectively serve approximately 9.0 million members. Nine of this year's thirteen participants also participated last year.
Collectively in 2025, the Comprehensive health plan operations of these plans, in total, earned annual premiums plus fees of $57 billion, and $71 billion in premium equivalents. The total revenues for the group were $64 billion in 2025 with the additional revenues from MLTSS. The median plan participating in the Sherlock Benchmarks this year served 536,000 people with Comprehensive products. The plans were geographically disbursed, serving 23 states.
Collectively, within the comprehensive products, 60.7% of membership was commercial. Of the commercial members approximately 39.5% were served through self-insurance arrangements. Of the commercial insured products 63.2% were HMO.
Medicare Advantage, with 1,010,000 members, was offered by 10 plans. It was 11.2% of the combined comprehensive membership and 25.4% of revenues for comprehensive products. With SNP, Medicare represents 28.3% of comprehensive revenues.
Medicare Supplement, with 292,000 members, was offered by 6 plans and was 3.2% of comprehensive members and 1.3% of revenues for IPS comprehensive products. In total, 29.6% of combined Plan revenues arises from products sold to seniors (Medicare Advantage, SNP, Medicare Supplement and stand-alone Part D).
Medicaid HMO, offered by 9 Plans, comprised 22.9% of combined comprehensive membership and 25.9% of comprehensive revenues. CHIP served an additional 1.3% of members and 0.7% of Comprehensive revenues.
Reporting Conventions
We employ some conventions to make the metrics most beneficial for the audience of Plan Management Navigator.
- The trends reported in this analysis are median changes and, when we refer to PMPM or percent of premium ratios, these too are medians. This measure of central tendency reduces the effect of outlying values on overall trends and values. Since each median value is calculated independently, the components cannot be summed.
- References to growth rates hold the universe constant in the comparison years unless otherwise noted. Rates of change called "as reported" are of health plans participating during both comparison years. When we refer to "constant mix" we are calculating rates of change for that same constant set of Plans after reweighting each Plan's product costs to eliminate the effect of product mix differences between their comparison years.
- Percent of premium ratios are calculated on a premium-equivalent basis. That is, in the case of ASO/ASC arrangements, we synthesize premium rates by adding to fees the health benefits incurred by the self-insured group. In this way, premium equivalents sum to all of the expenses of health insurance, including profits earned by the health plan, analogous to actual premiums on insured products. While not in accordance with GAAP, this approach has two advantages: comparability of ASO/ASC ratios with those of insured products offered by these Plans, and an intuitive appeal to general readers.
- Expenses and revenues exclude capital costs and investment income. We specifically exclude interest and similar debt capital costs, profits and capital formation costs (debt or equity) such as transaction costs, and interest payments to providers under "prompt pay" laws.
- Participants in and licensees of the Sherlock Benchmarks will note that the values for Account and Membership Administration and Total Administrative costs reported here will differ from those reported in the Benchmarks. The values reflected in Navigator include administrative expenses associated with pharmacy and behavioral health while the Sherlock Benchmarks do not. Because of variation in contracting by employers for these benefits and that the administration of these health services is sometimes outsourced by Plans who accept these management responsibilities, the Benchmark reports carve them out. Pages 22 - 24 in Tab 2 of Volume I of the 2026 Sherlock Benchmarks reconcile these two presentations.
- Expense trends, along with the PMPM and percent of premium ratios, are calculated before the effect of Miscellaneous Business Taxes. These expenses are a special case among administrative expenses since, short of major reorganization, they are impractical to manage. These taxes are primarily related to the Affordable Care Act, and they may vary based on public policy. For Commercial Insured products, the median PMPM value of such taxes is $6.25 for 2025, compared with $7.04 for 2024, and $7.08 in 2023. The 2025 value was approximately 9% of total administrative costs for this set of products.
Appendices
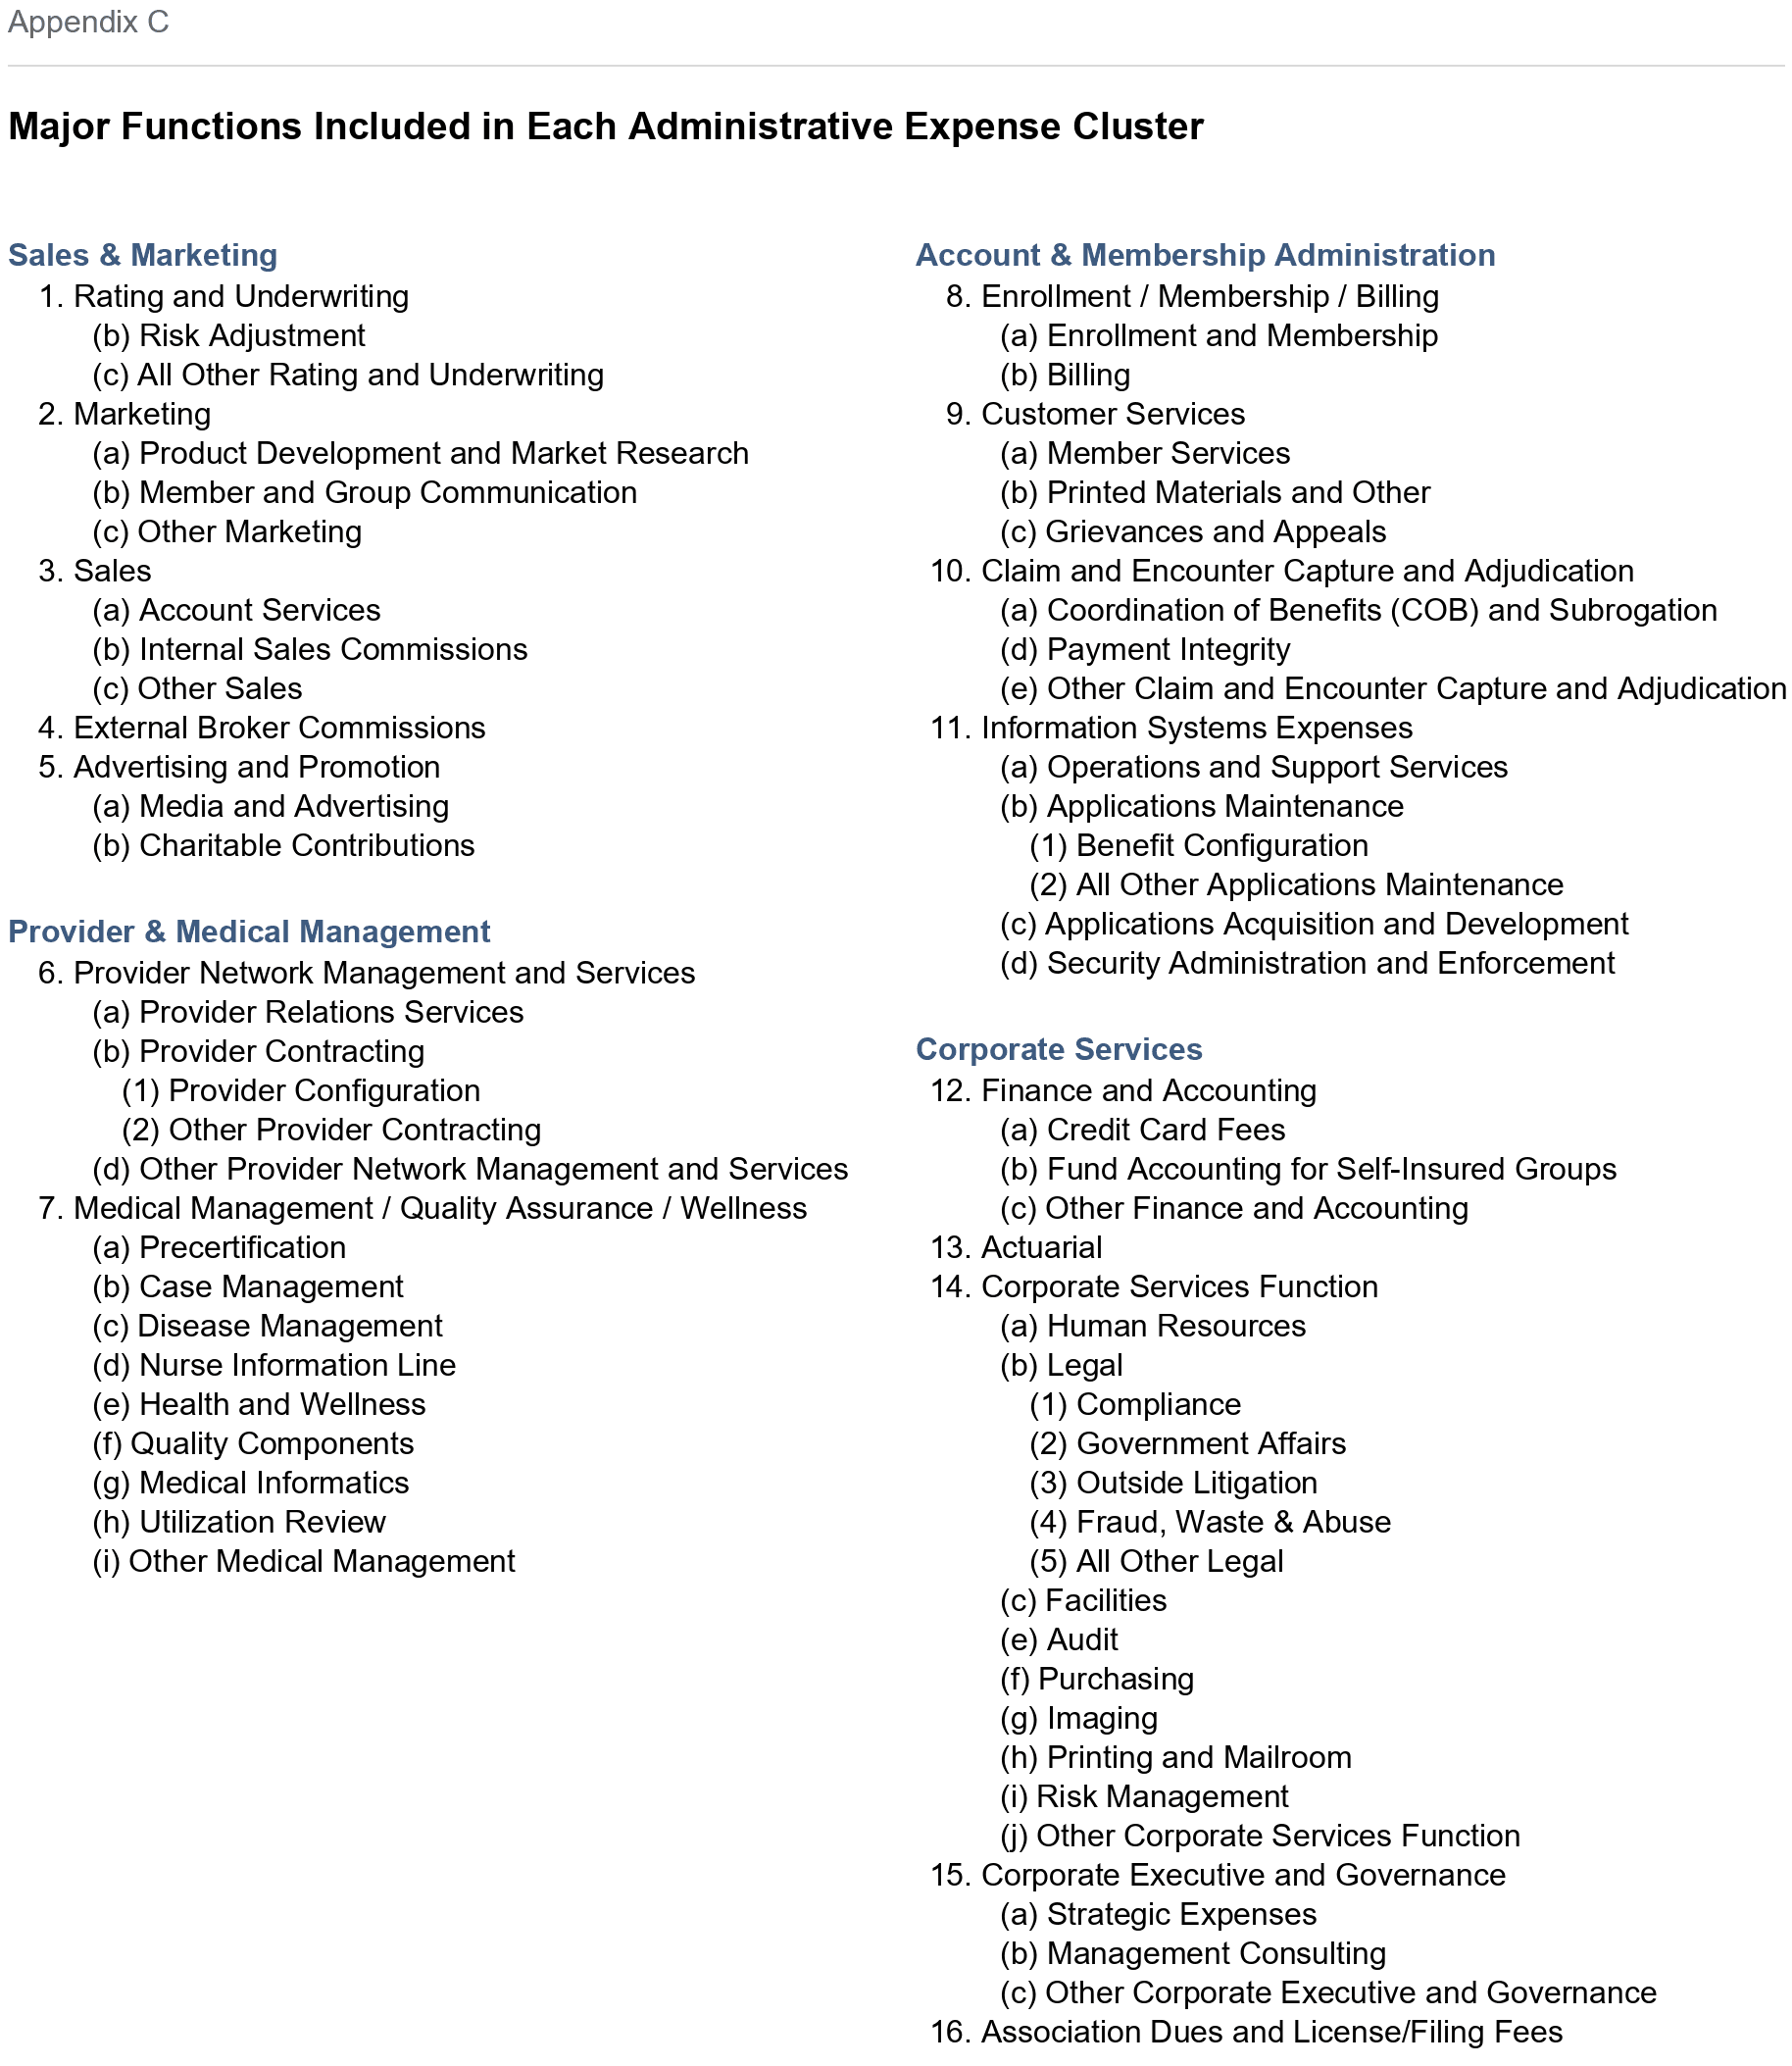
Notes
- Outsourced FTEs are often estimated from invoice amounts of BPOs and other similar vendors based on the compensation and non-labor costs of Plans that do not themselves outsource.
- The staffing ratio for the commercial products is estimated based on plan reports for their comprehensive products. Also, since the plans report all PMPM costs for each function by product, we can estimate product staffing costs for any given product using only the assumption that the mix of labor and non-labor costs is the same across all offered products. By focusing on one product we are able to illustrate trends without the distortion of product mix changes.
Note on the Sherlock Benchmarks
The Sherlock Benchmarks are the health plan industry's metrics informing the management of administrative activities. They are based on validated surveys of approximately 30 health plans serving over 52 million Americans and provide costs and their drivers on key administrative activities. The Benchmarks are reported in multiple universes of health plans: Larger Plans, Blue Cross Blue Shield, Independent / Provider-Sponsored, Medicare and Medicaid.
The Sherlock Benchmarks are the "gold standard" of health plan administrative cost benchmarks. Health plans use them to determine whether their administrative costs are competitive, to prioritize for improvement among numerous specific activities and to identify cost drivers such as staffing ratios that, overall and within functions, can help implement those improvements.
These Plan Management Navigator results are excerpted from the Independent / Provider-Sponsored edition of the 2026 Sherlock Benchmarks. We will be reporting on the results of the other universes in the months that follow. Detailed health plan costs and operational drivers are available by licensing the Sherlock Benchmarks.
If you are interested in licensing these materials, if we can answer any further questions about them, or if you have questions about this Plan Management Navigator, we hope you will not hesitate to contact us. In addition, the Sherlock Company website has an application that allows you to try out the Benchmarks free of charge. Tables of Contents, report formats, citations, quality assurance and other information can be found here.
Addendum
This addendum revises several charts to reflect a late withdrawal of one health plan from the data set. All the affected charts reflect 2025 financial and operational results. Because the withdrawn health plan was originally included only in the 2026 cycle, trend figures were not affected.
Please do not hesitate to reach out to us if we can answer any questions.