
The Sherlock Benchmarks are frequently used to manage health plan administrative costs. Their granularity helps pinpoint opportunities and gauge the potential magnitude of cost management initiatives.
In addition, the analyses and values posted on the Sherlock Company website provide useful initial insights for strategic questions such as:
- How do my health plan's per-member costs compare with the norms of a peer group that resembles my plan and offers a similar product mix?
- How do economies of scale affect the expenses of each cluster of administrative functions, and how does this compare with my plan's size?
- In the event of a sudden change in membership, what will be the short-term effect on costs?
Benchmark Calculator
This model facilitates comparisons between a health plan's costs and those of its peers. By supplying a plan's product mix and cost information, you can produce a custom benchmark for the current year.
For each product the plan offers, enter its membership and select the closest matching universe. Product segmentation is detailed, facilitating superior comparisons. For example, there are eleven Commercial Insured products and ASO and ASC are separately valued.
To reflect differences in operating styles, you may also select the most appropriate universe for each product. This recognizes that the values for Commercial HMO Insured offered by Blue Cross Blue Shield Plans are on average about 10% higher than for the same product offered by Independent / Provider-Sponsored Plans.
Economies of Scale
Economies of scale arise from fixed costs within business expense structures, including health plans. Functions such as corporate executive and governance, finance, and human resources inherently contain fixed cost elements. When membership volume doubles, these costs do not double—they increase by a smaller proportion due to their fixed components.
Economies of scale can be observed in both the long term and the short term:
Long-term scale: measured using a cross-sectional analysis of PMPM health plan costs and membership. Rates of change are derived from cost differences across plans of varying sizes at a single point in time.
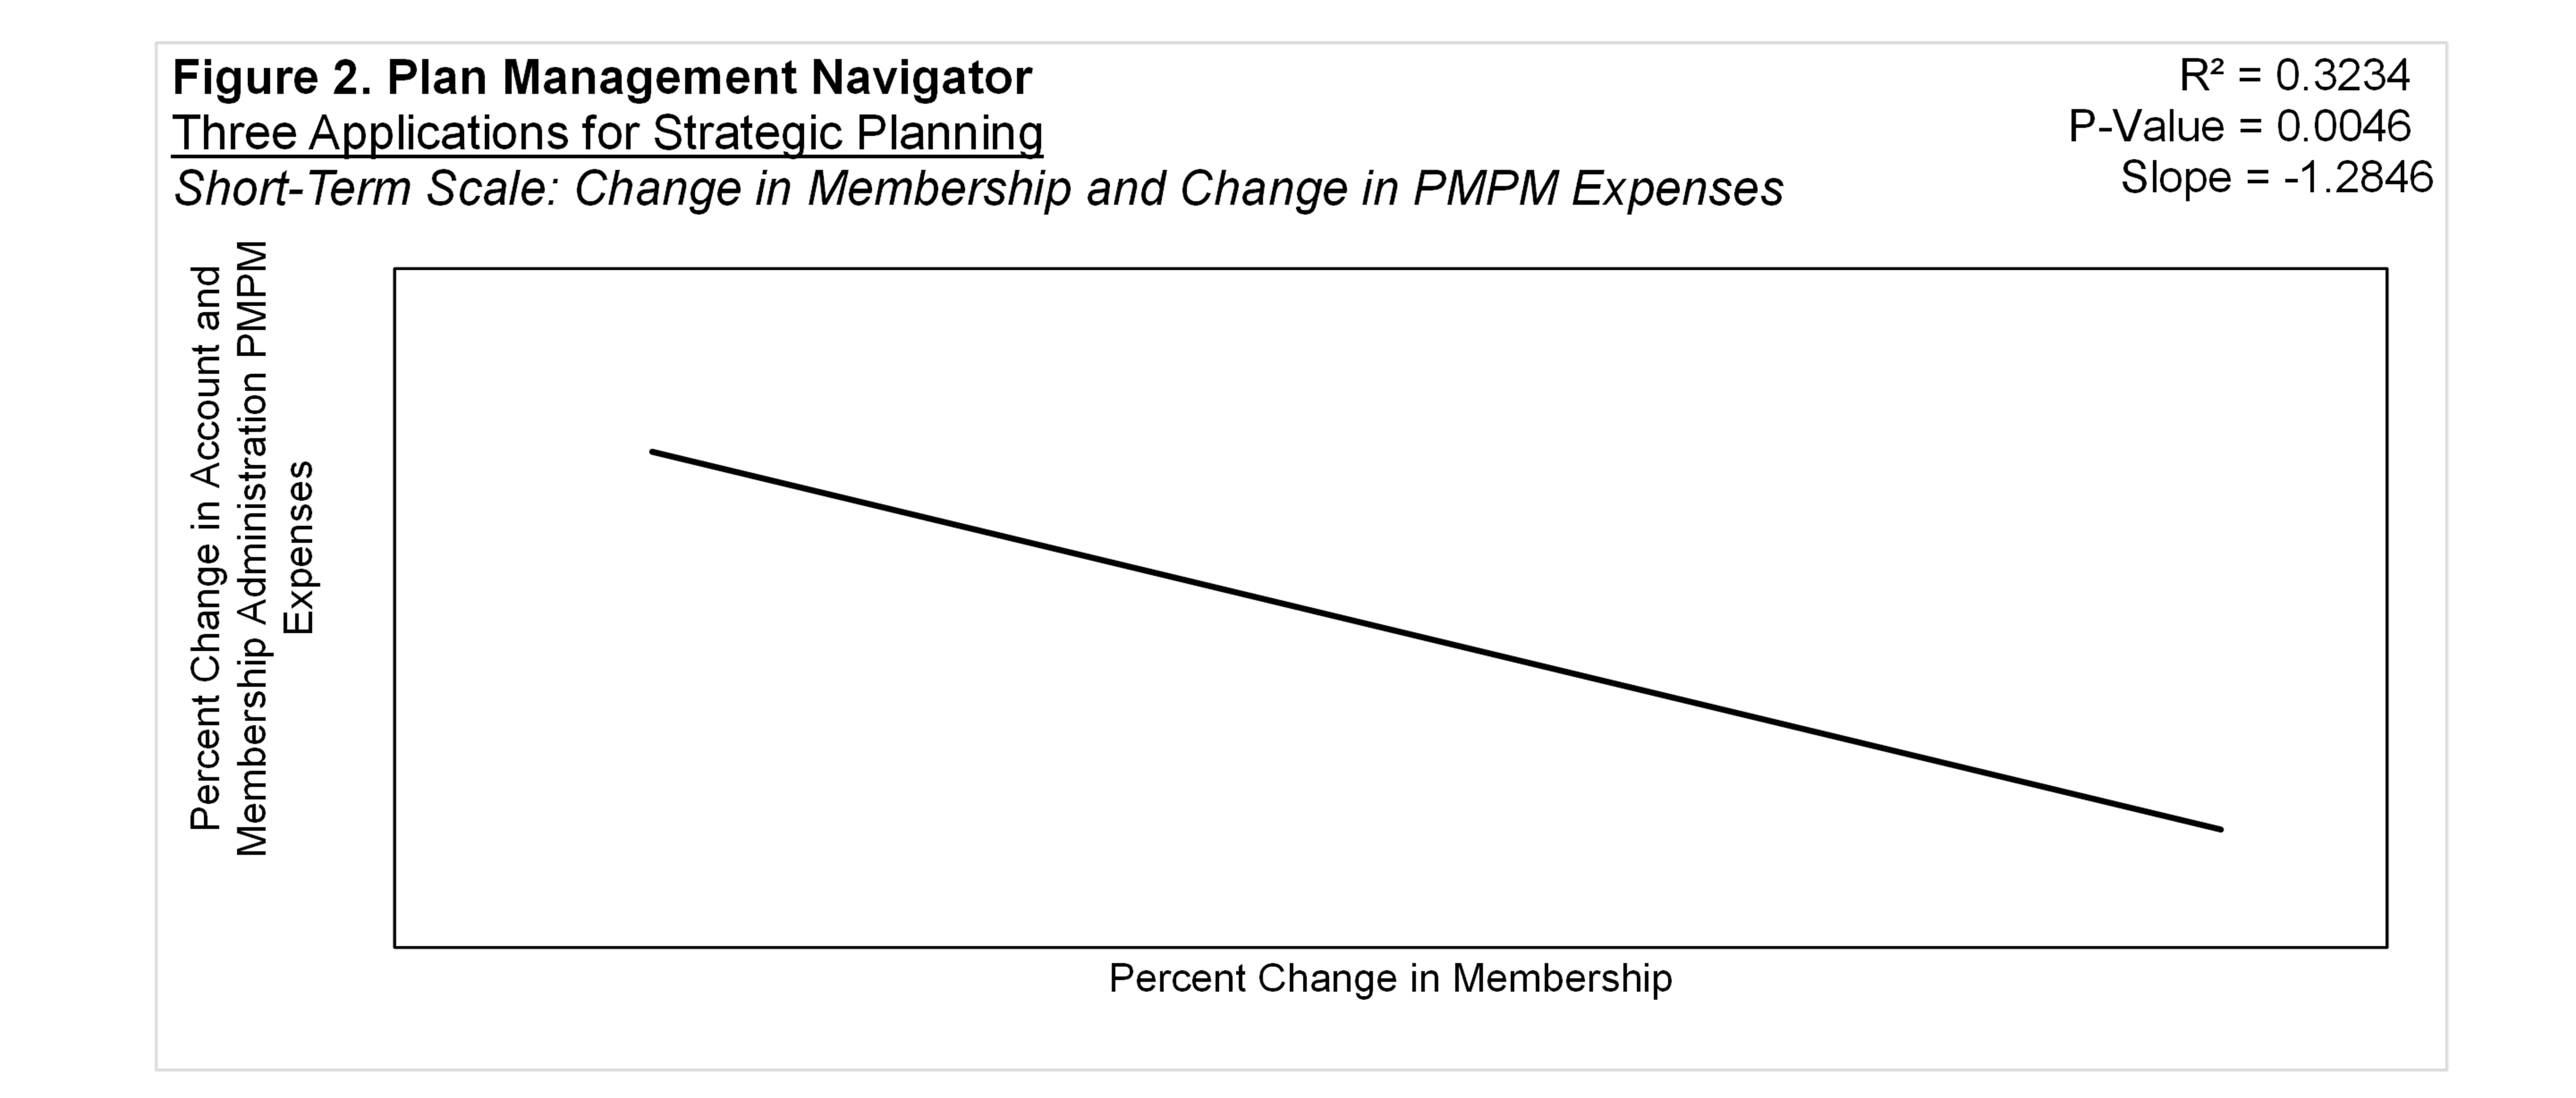
Short-term scale: measured by calculating rates of change in each plan's membership and expenses. Actual levels of membership and costs are disregarded in the analysis; only their rates of change are used.
It is often said that all costs are variable in the long term and fixed in the short term. This aphorism is essentially true. Functions like customer services grow or shrink with membership over time, but in the near term, managers cannot adjust staffing quickly enough to match rapid membership changes.
In the following charts, we illustrate this. The regressions show steeper slopes for short-term changes in scale (−1.284 × 10⁻⁴) compared to the gentler slopes observed in long-term scale analyses (−0.644 × 10⁻⁴).
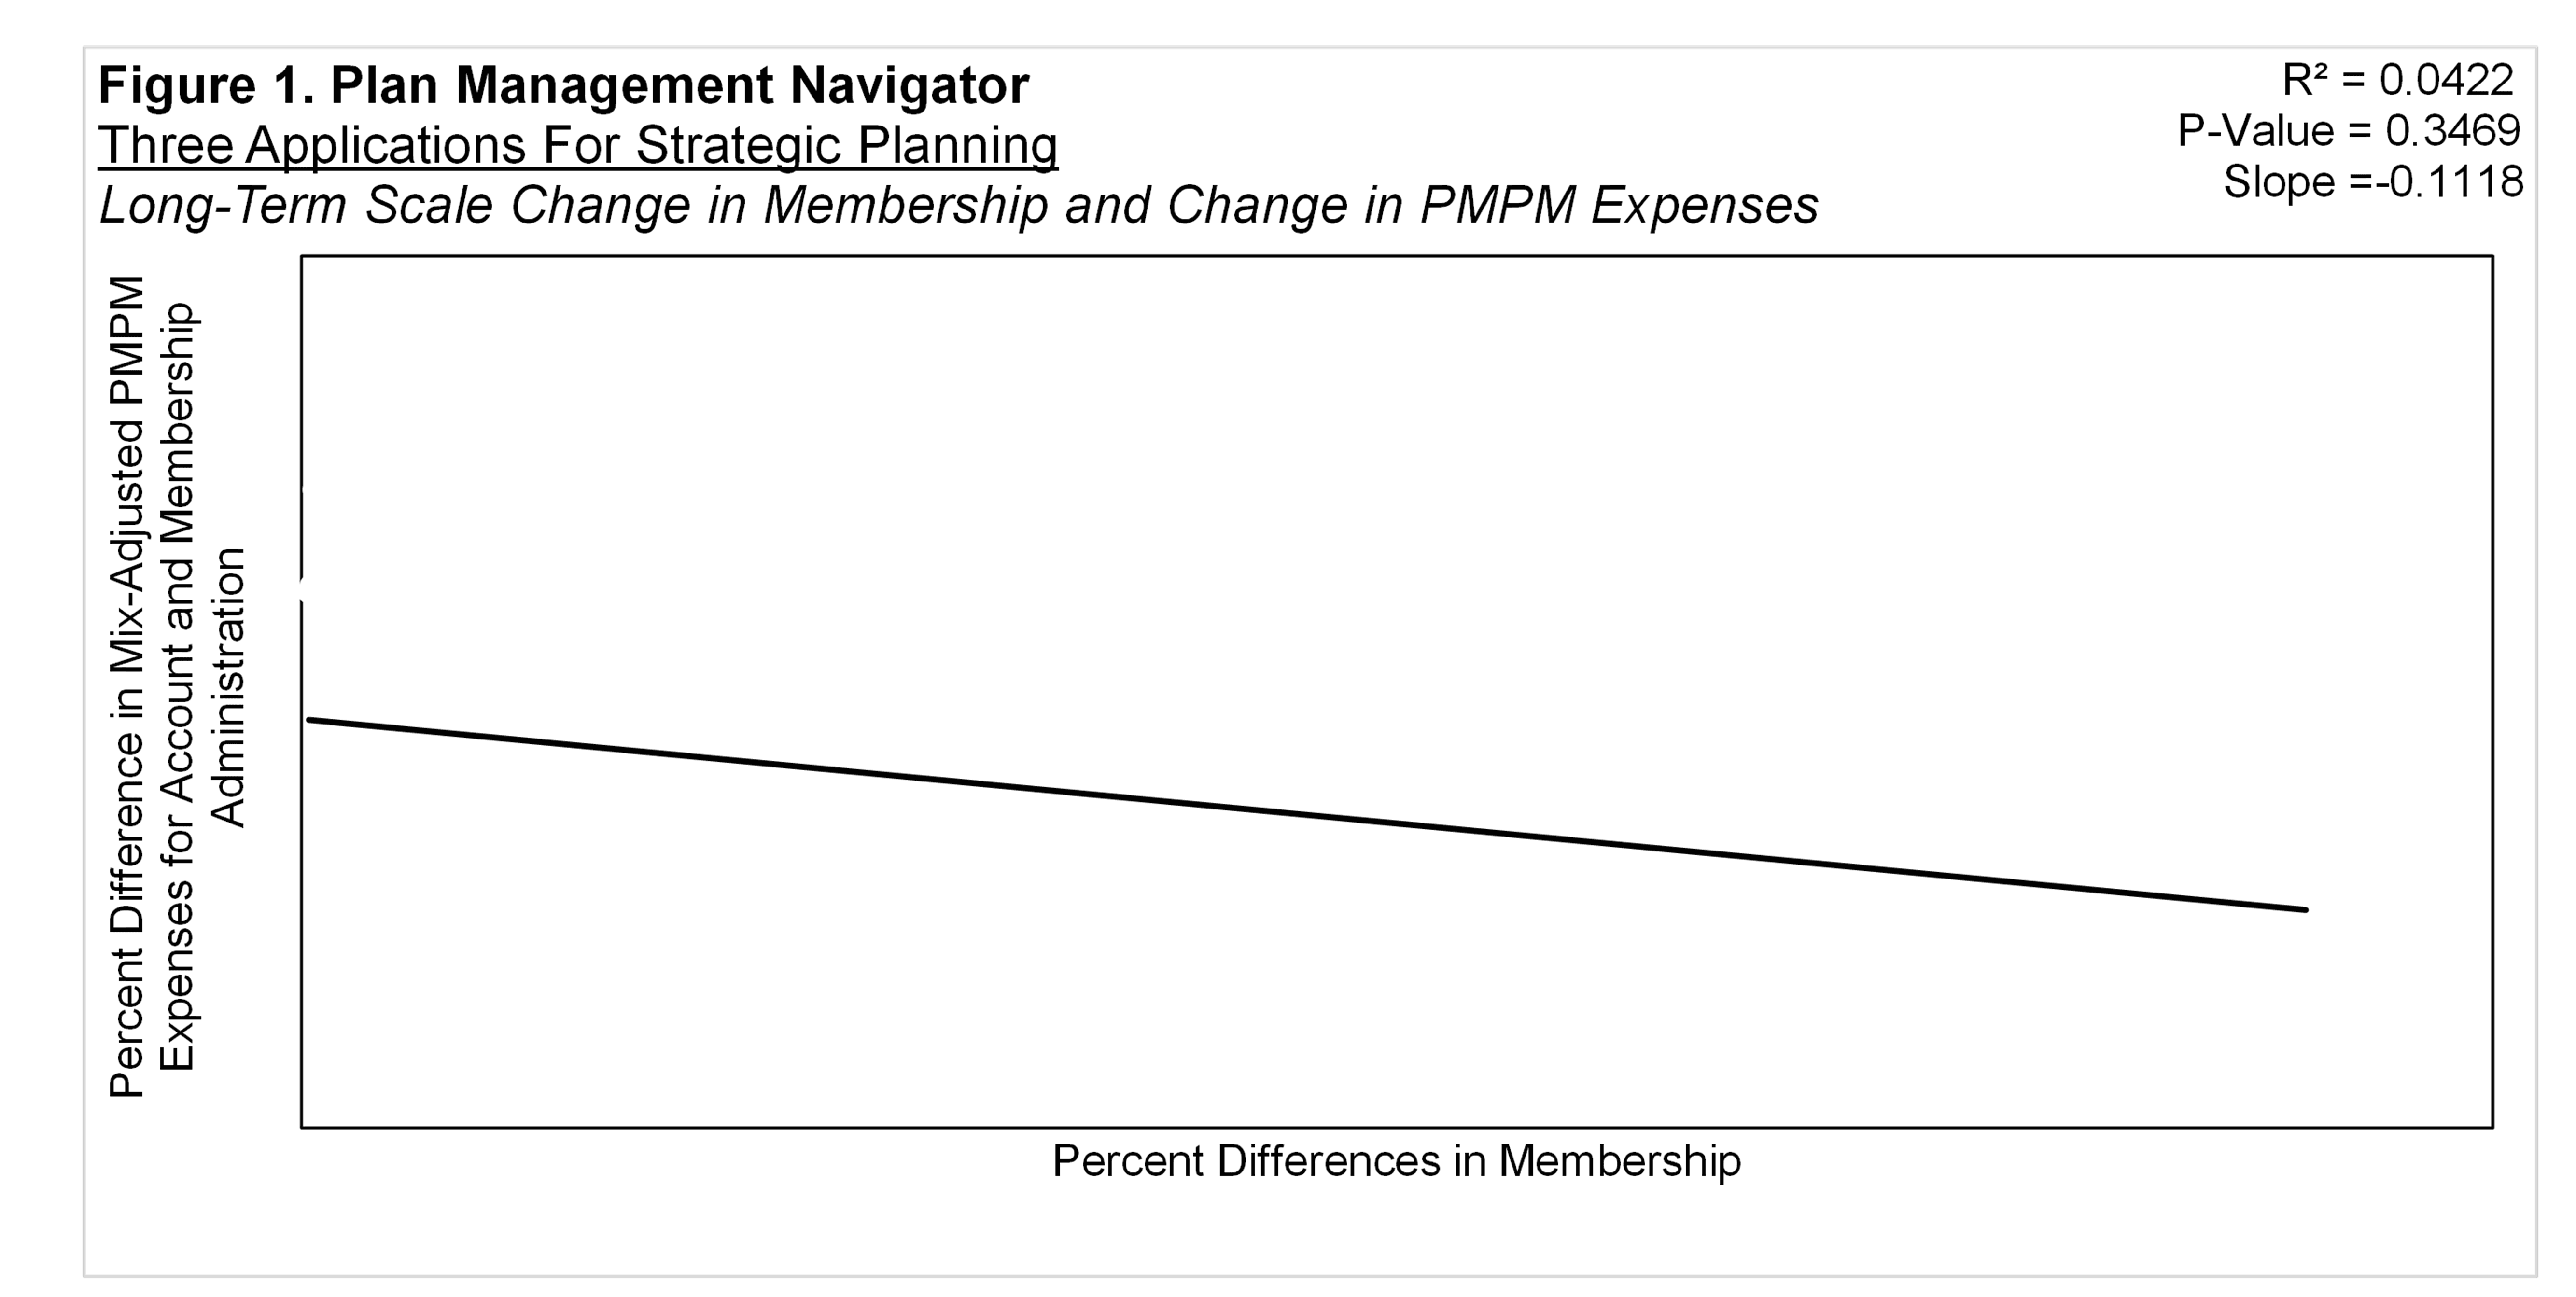
Again, the slope of cost changes relative to membership changes is steeper in the short term than in the long term. Because the magnitude of scale is twice that of the long term, the short-term effect is twice as great.
* How we calculated long-term scale for this comparison may be a qualification of this analysis. The long-term scale study (Late October Navigator) was based on a regression of natural logs of percent differences from means versus natural logs of member months. For simplicity in this illustration, we substituted absolute PMPM values and member months.
Long-Term Scale
This model estimates the effect of economies of scale on each cluster of expenses for health plans. By entering a PMPM cost for functions and your current and future membership, you can project per-member expenses after membership changes.
Although only a minority of expenses show statistically significant economies of scale—and the slopes are shallow—larger scale correlates with lower total costs. The model shows that doubling membership reduces affected function costs to approximately 83-87% of their pre-doubling levels.
Expense estimates may be calculated in total or by clusters of functions: Sales and Marketing, Medical and Provider Management, Account and Membership Administration, and Corporate Services.
The scale slopes are derived from point-in-time, cross-sectional analyses based on cost information from 2024. These slopes represent relationships between costs and membership as observed across multiple plans at a single moment in time.
Short-Term Scale
The short-term scale model quantifies the possible effect of changes in a health plan's membership growth rate on its expenses. Because plans cannot adjust staffing and other costs instantaneously, rapid membership changes create temporary cost advantages or disadvantages.
This model was developed by summarizing a longitudinal study of the relationship between membership growth and administrative cost growth for 59 Blue Cross Blue Shield Plans and Independent / Provider-Sponsored plans across sequential years.
To apply the modeled relationships to a health plan, supply its PMPM costs, base membership growth rate, baseline PMPM cost growth rate, and projected change in membership. The model estimates the resulting change in PMPM costs.
Qualifications
We hope these models are helpful. They should be considered alongside other information, including your health plan's unique circumstances, strategic objectives, and the specific competitive dynamics of your market.
Access the Models
These interactive models are available on the Sherlock Company website at Scale Calculators.
The Benchmark Calculator helps you compare your plan's costs with peer group norms by entering product mix and membership data.
The Long-Term Scale model estimates how economies of scale affect each expense cluster as membership changes over time.
The Short-Term Scale model quantifies the immediate impact of rapid membership changes on administrative costs before full adjustment can occur.