Every health plan operating function considers the needs of its members in establishing its capacity. The number of members matters, but so also does each member's needs. For health plans, those needs are partly apparent from the products that they choose.
Customer Services is among the most important activities in support of health plan members. The Sherlock Benchmarks not only captures cost and staffing information but also inquiry volume and handle time in seconds. This Plan Management Navigator reports on a series of regression analyses measuring the effects of the percent share of Medicare, Medicaid and Commercial products on inquiry volume and handle time. Twenty-five plans supplied information sufficient for this measurement.
Medicare Advantage
The health needs of Medicare Advantage members are 2.3 times that of Commercial Members, and 3.4 times that of Medicaid members. They have greater encounters with the health care system, and an encounter may give rise to higher levels of inquiries for provider participation, scope of benefits, claims reconsiderations and so forth.
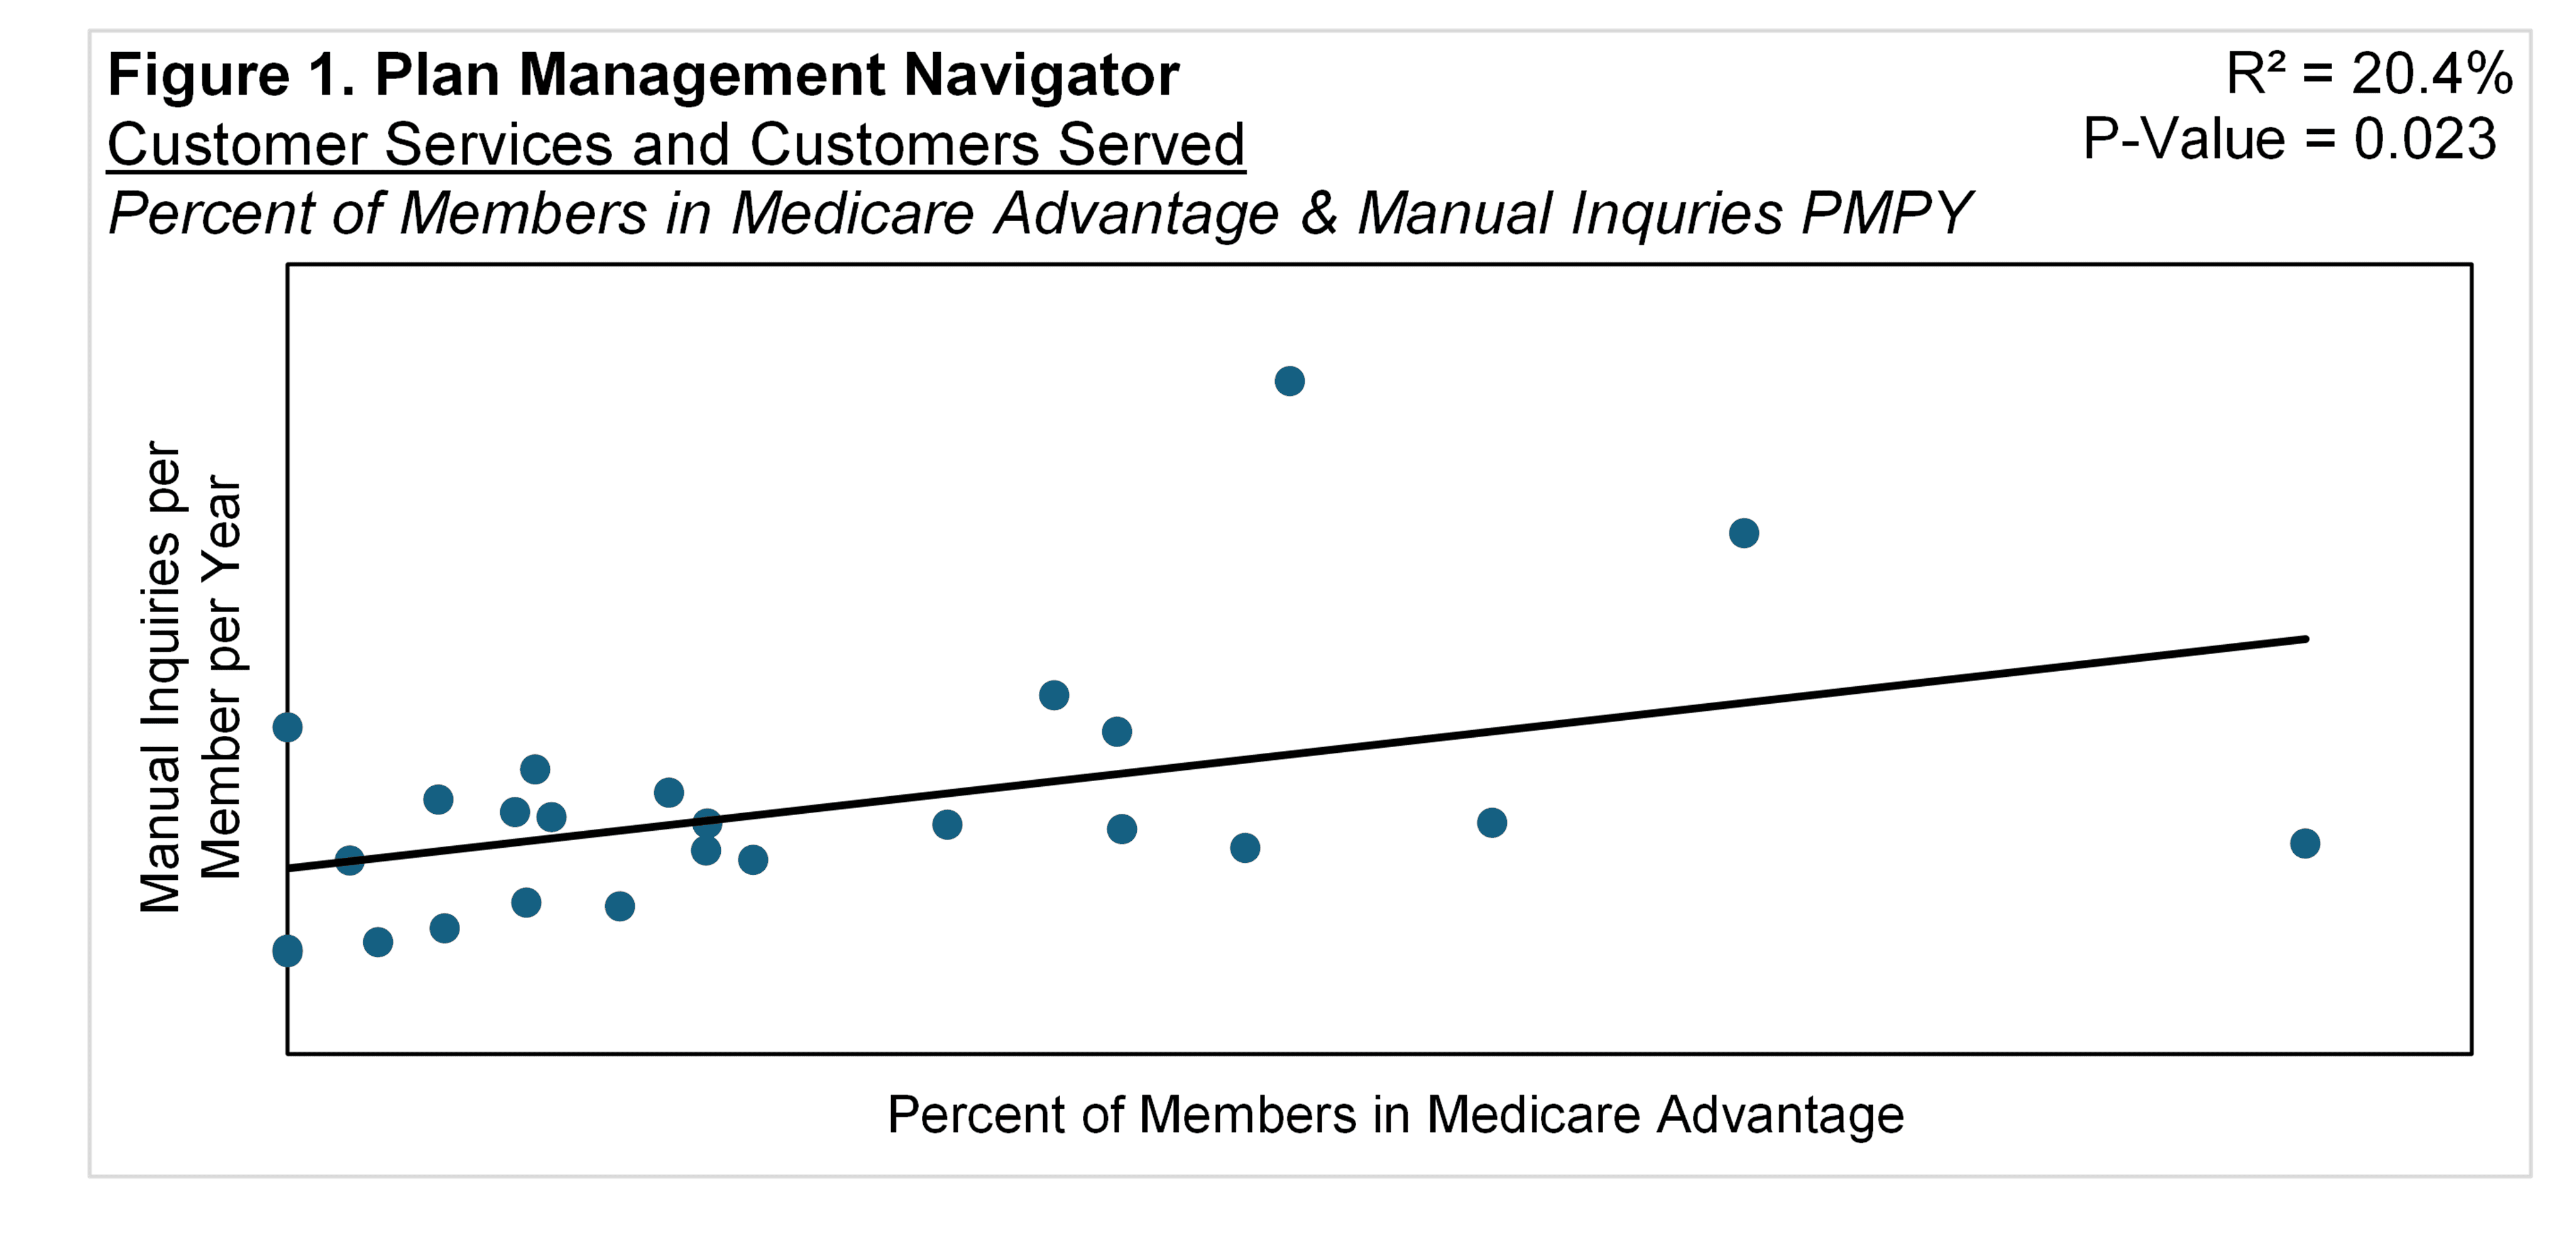
Figure 1 measures the effect of Medicare Advantage share of health plans' membership on the number of enterprise-wide Manual Inquiries per Member per Year. The slope is positive, i.e., the greater the proportion of Medicare Advantage the greater the number of inquiries per member. The P-Value was 0.023, that is, the chance of the relationship modeled by the regression line being the result of an unrepresentative sample was 2.3%. The regression line explained 20.4% of the differences between the values.
Medicaid
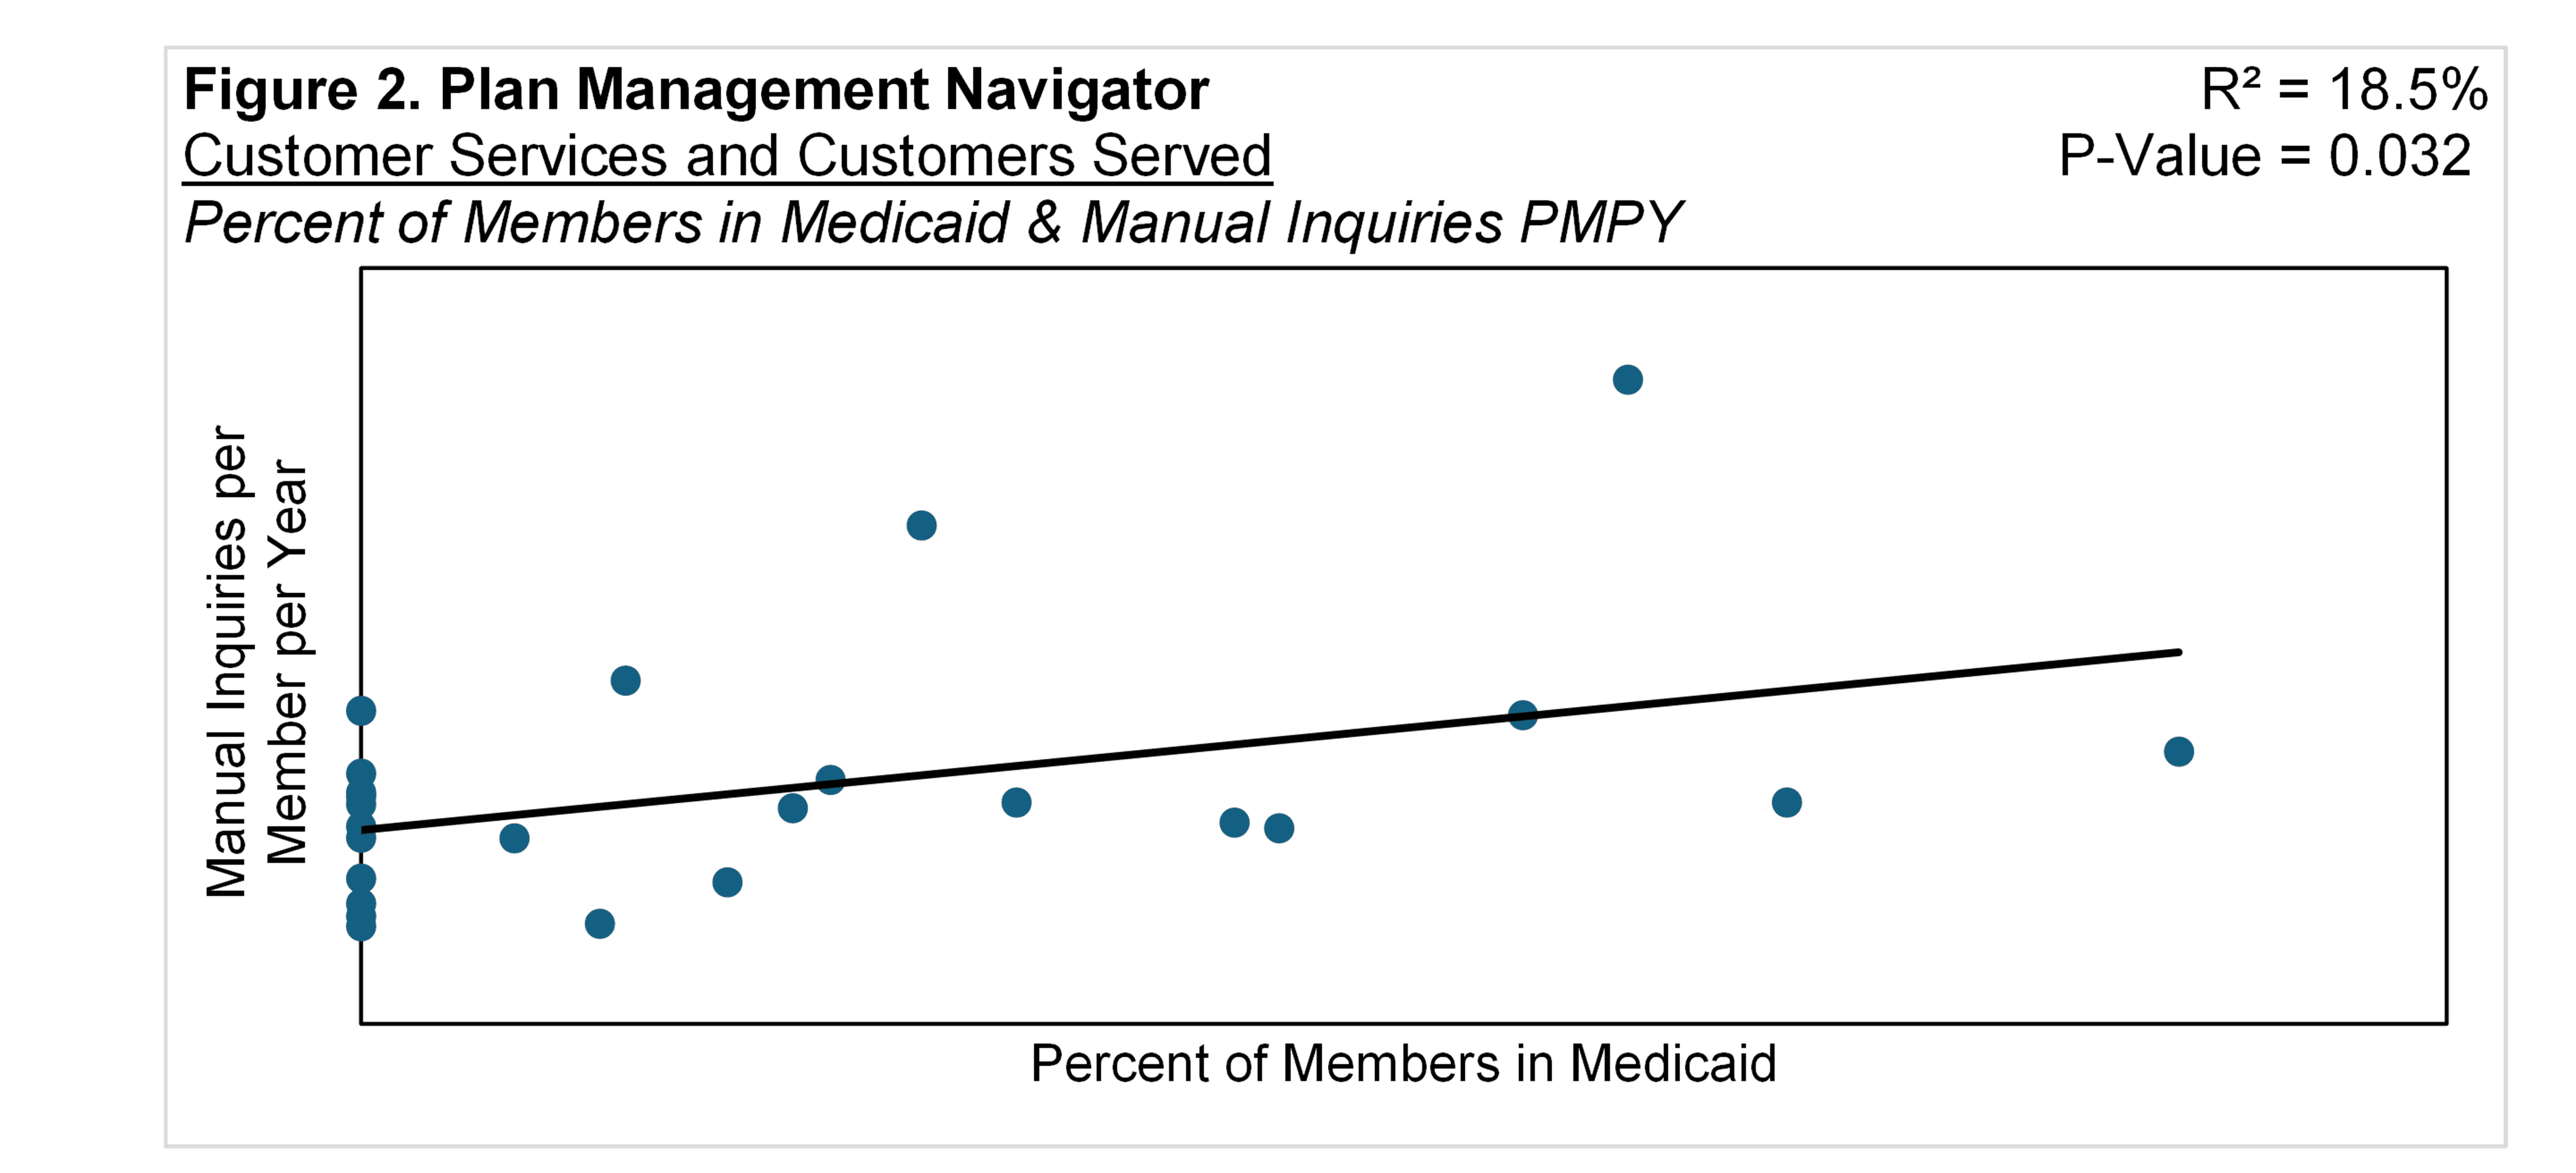
The share of membership that was Medicaid also had an effect on enterprise-wide Manual Inquiries per Member. Figure 2 measures that effect: the relationship is positive, the R² is 18.5% and the P-Value was 0.032. The greater the share of Medicaid, the greater the Inquiries per Member for the health plan.
In view of our earlier implication that health care costs are associated with inquiries, this is inconsistent with lower health care costs in Medicaid. One possible explanation stems from the nature of Medicaid enrollment: In Pennsylvania for instance, the average duration of Medicaid Expansion Population enrollment was 355 days. When their membership expired, 41% of the time it was because their income exceeded certain thresholds. Such members may therefore be either new to the Medicaid program or are new to a subsequent Commercial Product offered to that beneficiary by the same plan, perhaps a catalyst for inquiries.
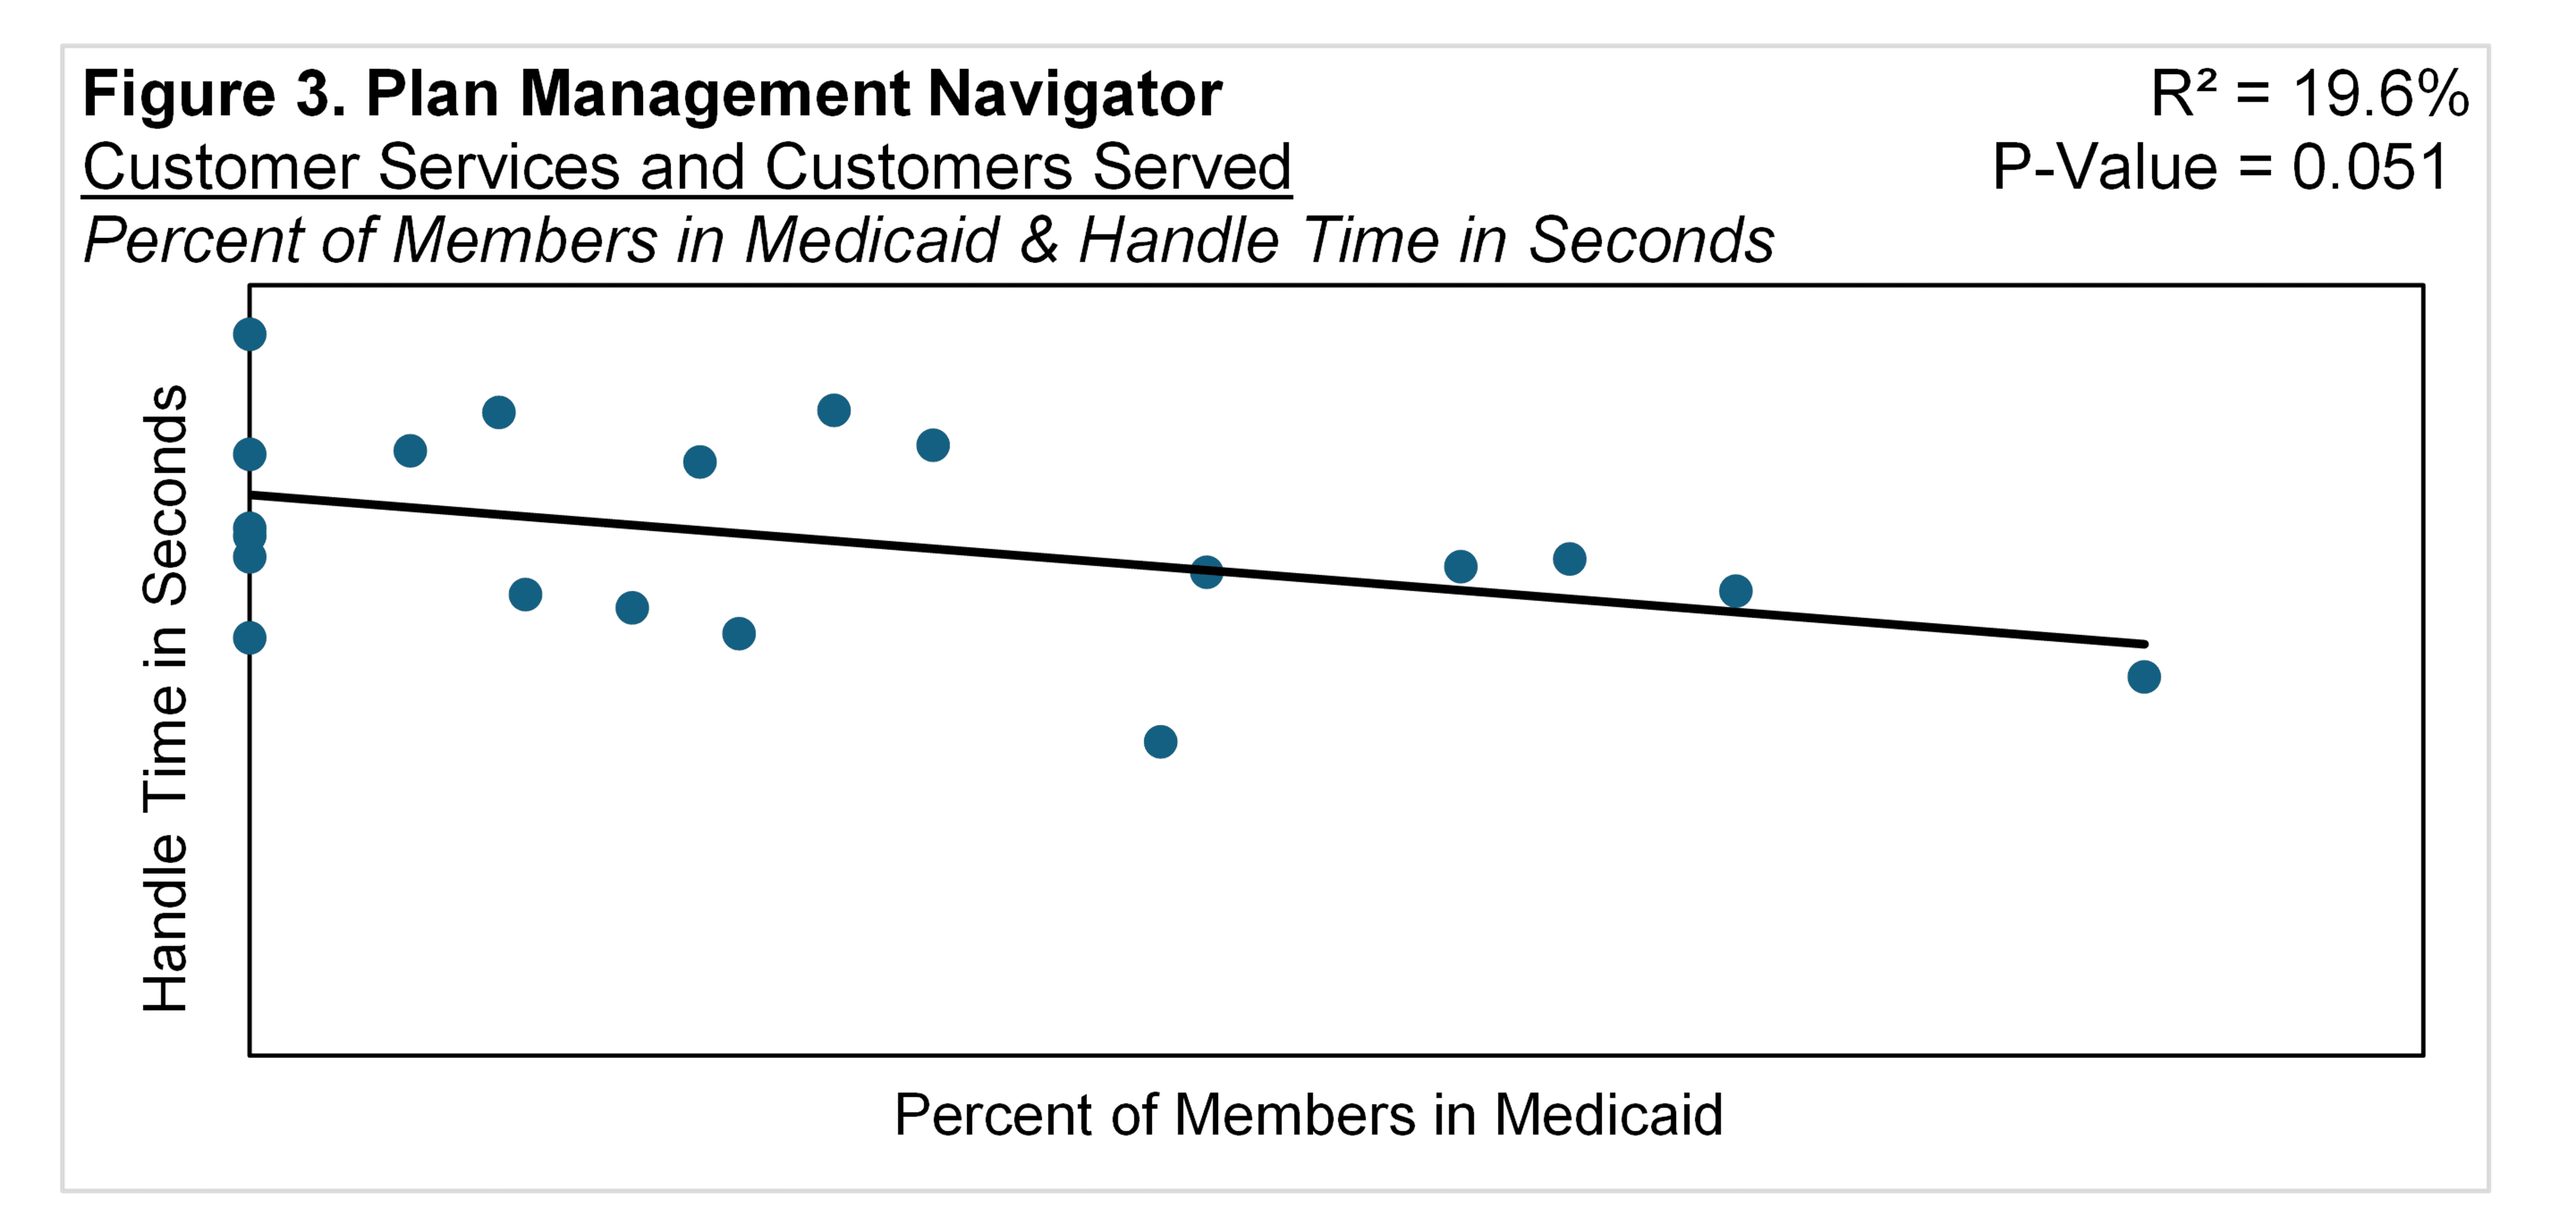
Handle time is also associated with higher Medicaid participation. The slope is negative, that is, the greater the Medicaid share, the shorter the Handle Time in Seconds. The R² is 19.6% and the P-Value is 0.051. Please see Figure 3.
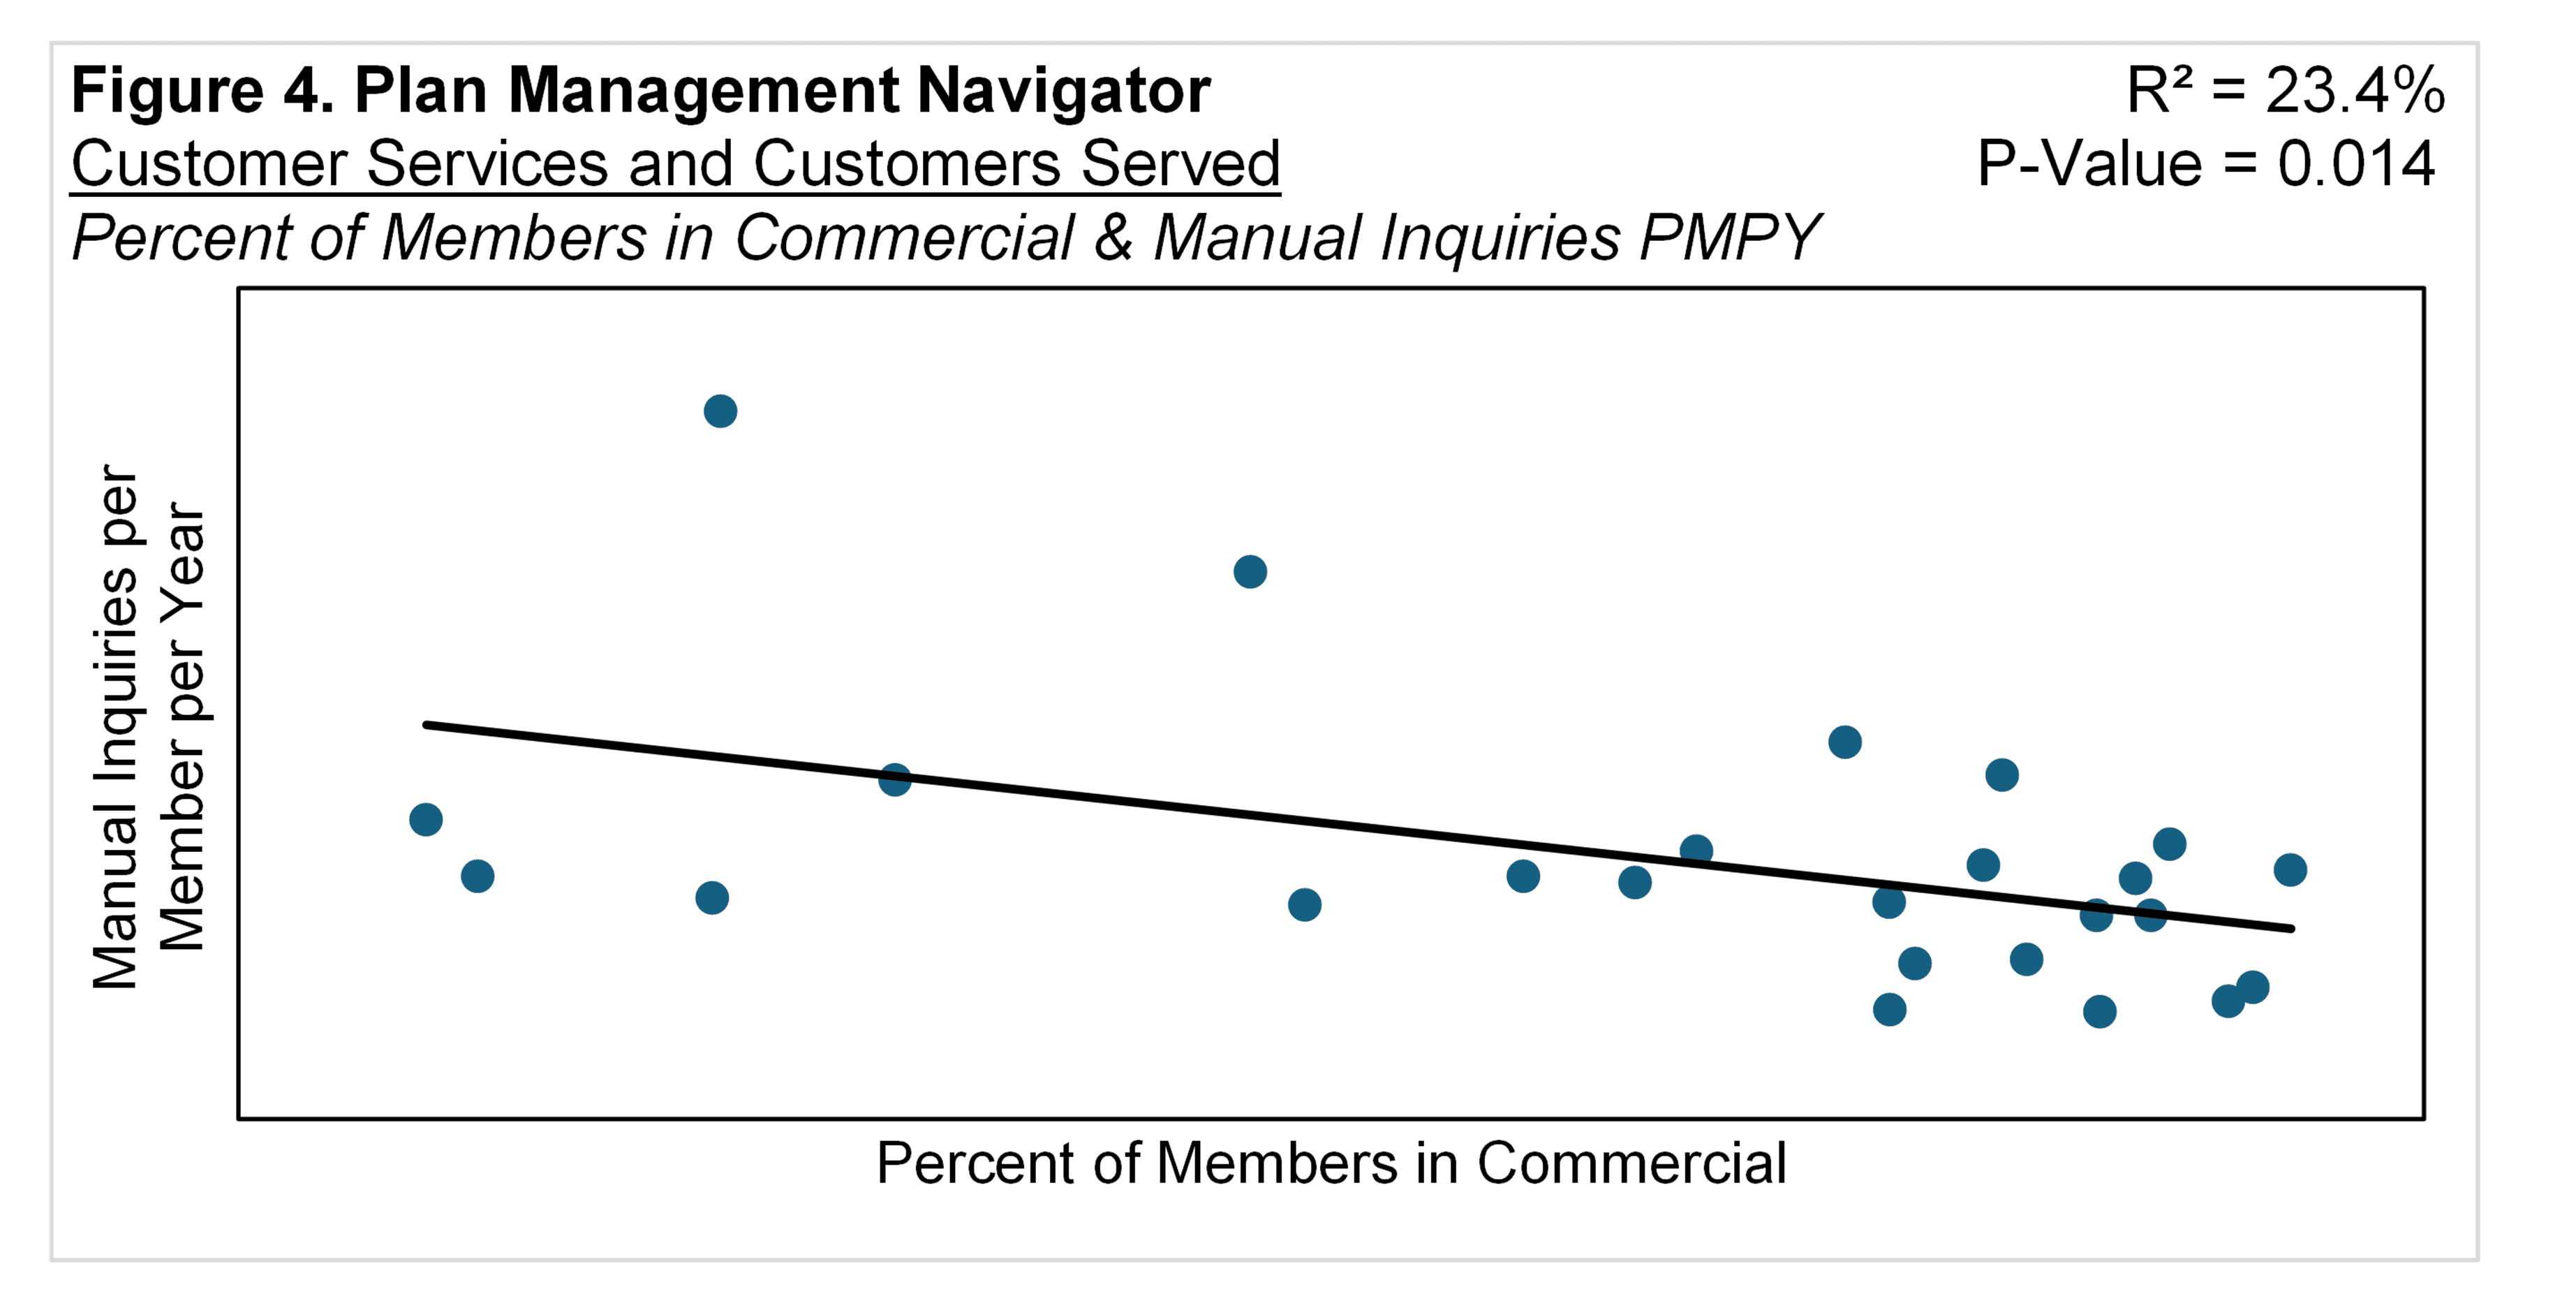
Commercial
The predominant product offered by these health plans is Commercial. Unsurprisingly, based on the above, the greater the share that is Commercial, the lower the manual inquiries per member. The slope is negative, with a R² of 23.4% and a P-Value of 0.014. This is shown in Figure 4.
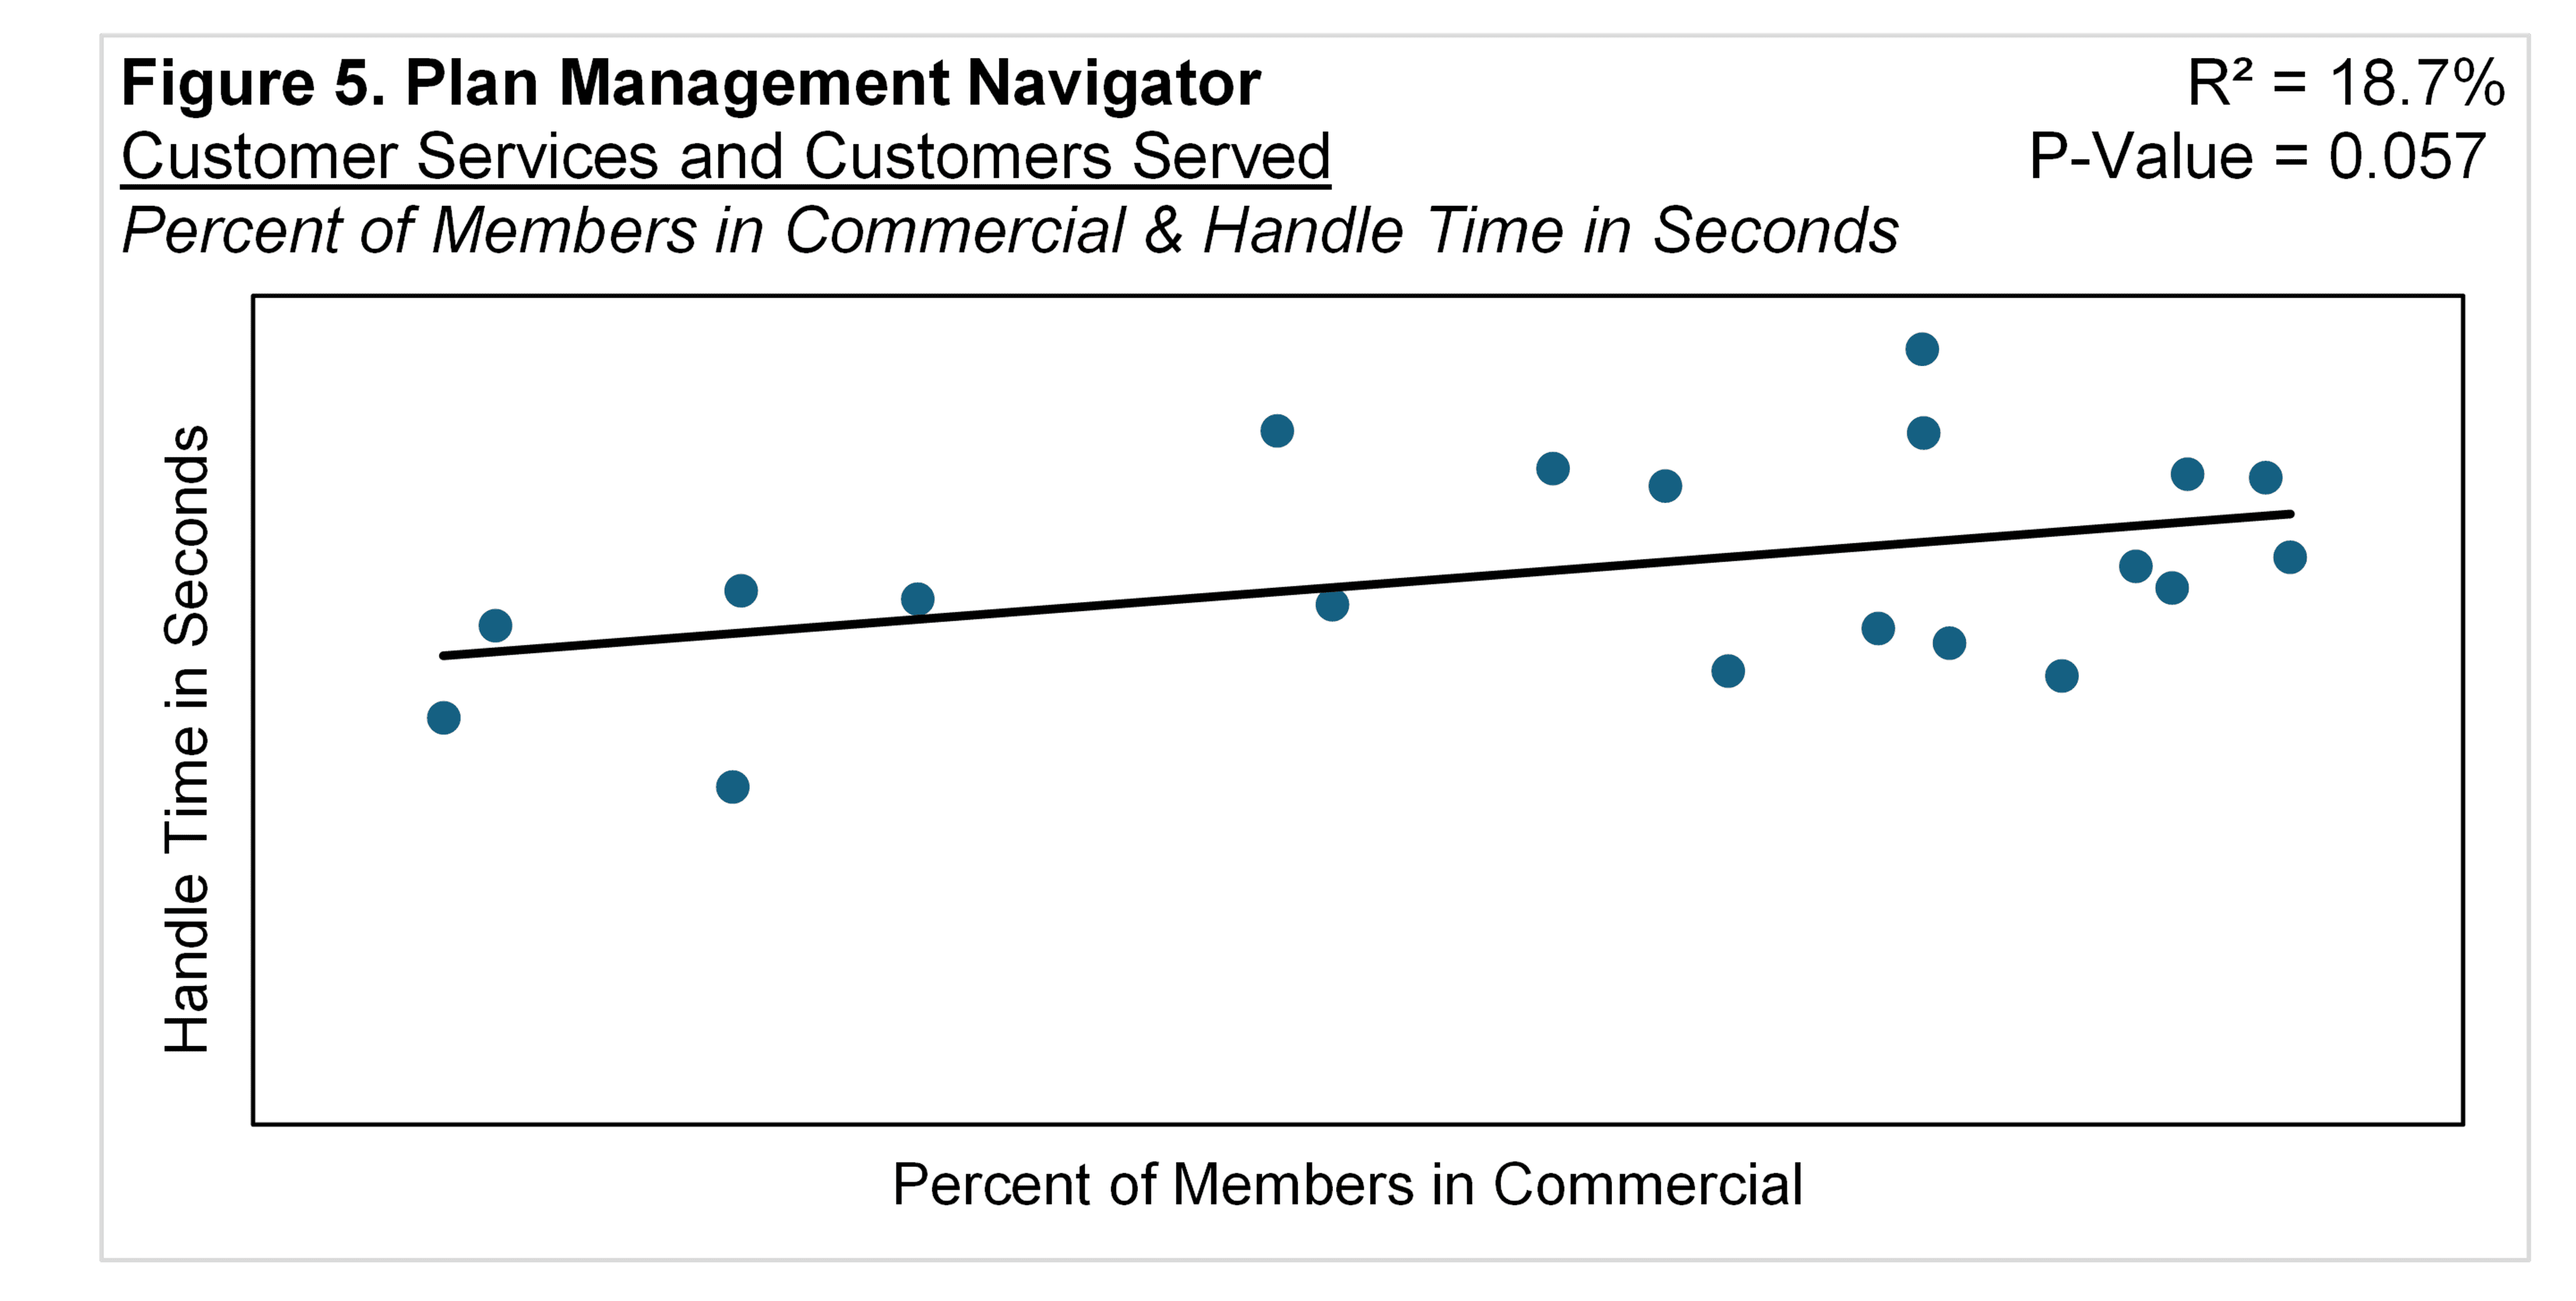
As shown in Figure 5, Handle Time in Seconds was also affected by the share of membership that was Commercial: the greater the proportion, the longer the Handle Time in Seconds. The R² was 18.7% and the P-Value was 0.057.