
Introduction
This Plan Management Navigator shows how cost improvement is achieved through operational improvements such as automation, and member use rates. We illustrate this through the areas of Provider Relations Services, Member Services, and by using Claims Auto-Adjudication as a proxy for automation in other functions.
This analysis is based on the results of 29 plans that participated in the 2024 Sherlock Benchmarks, which reflects health plan results from the year ended 2023. Note that not all plans supplied the operational metrics within this analysis or serve all products benchmarked.
For this analysis, we consider relationships to be significant if they have P-Values of 0.10 (10%) or less. P-Value measures the chance that the regression line could be the result of unrepresentative data. This is a generous threshold. The R², or coefficient of determination, is the degree to which all the data points are found on the slope. It measures the degree to which the regression line explains differences between the various values. We have not endeavored to remove outliers that are apparent only visually: sometimes their removal strengthens and sometimes it weakens the regression.
Unless otherwise specified, all relationships cited in this analysis reflect Comprehensive Total. That is, they are solely physician / hospital insurance, and exclude such products as Stand-alone Part D.
Provider Relations Services
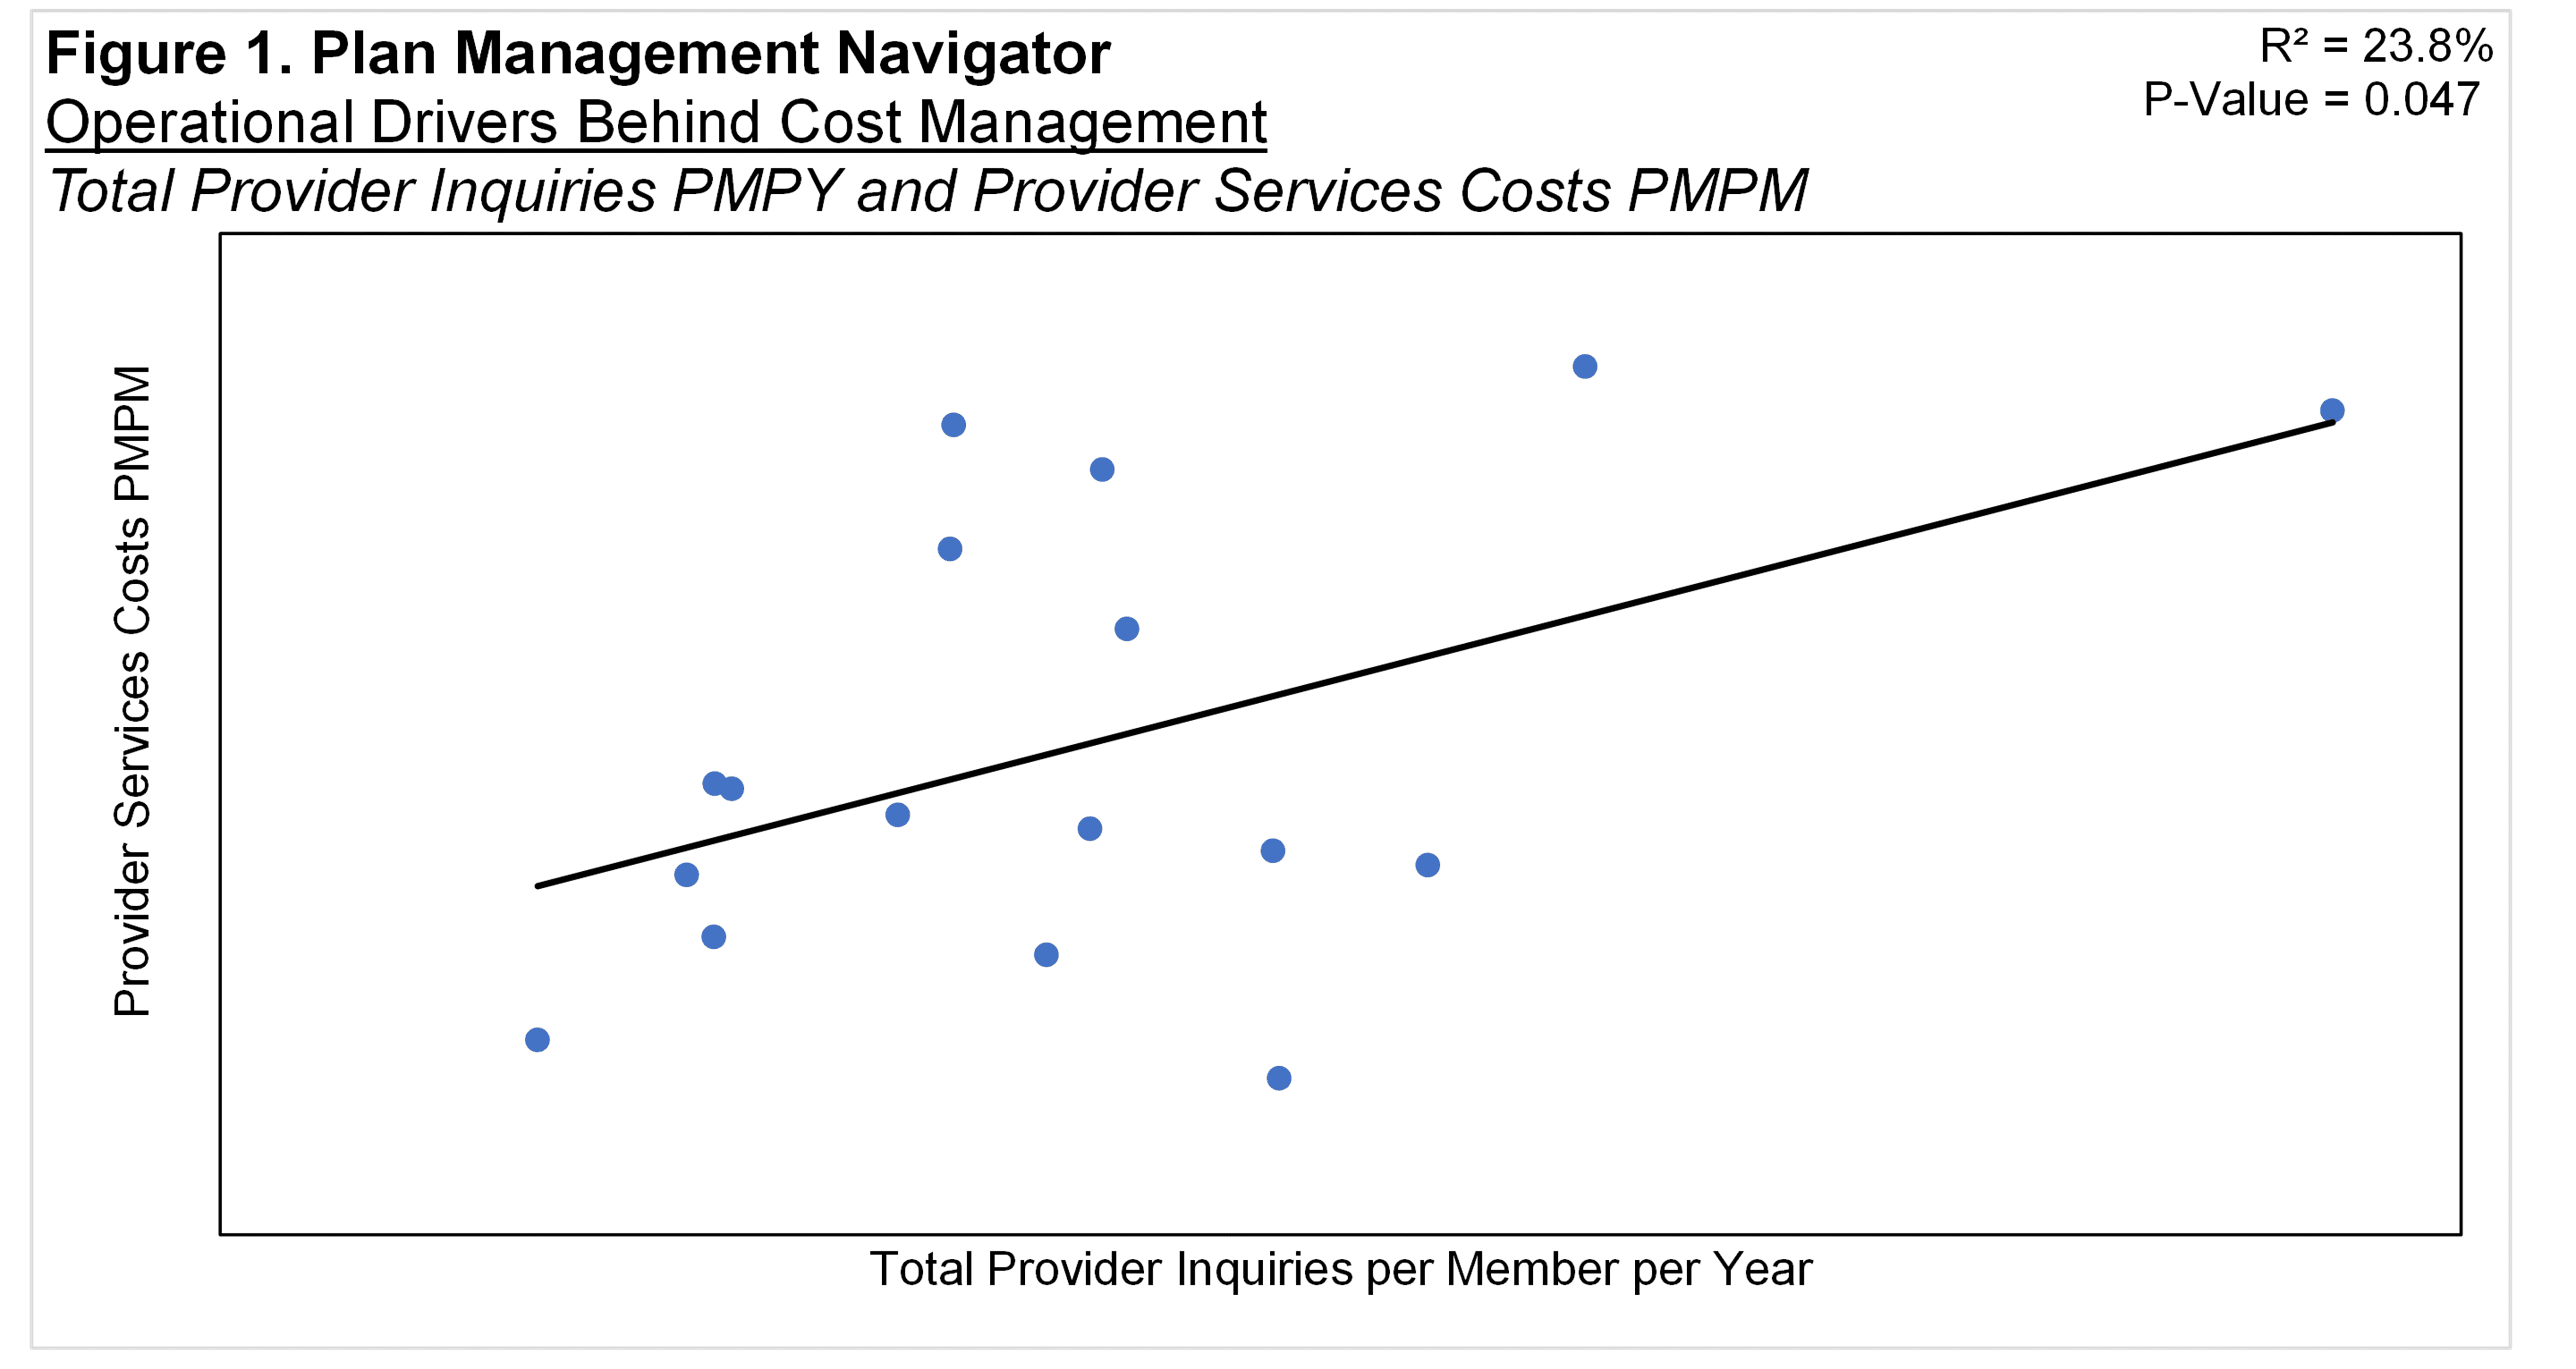
Provider Relations Services activities are the initial point of contact for by providers to the health plan. We refer to those contacts as inquiries. The Total Number of Provider Inquiries per member per year displayed a significant relationship with Provider Relations Services Costs PMPM, shown in Figure 1. The relationship had P-Value of 0.047 and R² of 23.8%. The relationship between the two variables suggests that the greater the number of Provider Inquiries, the greater the health plan's PMPM Costs in Provider Relations Services.
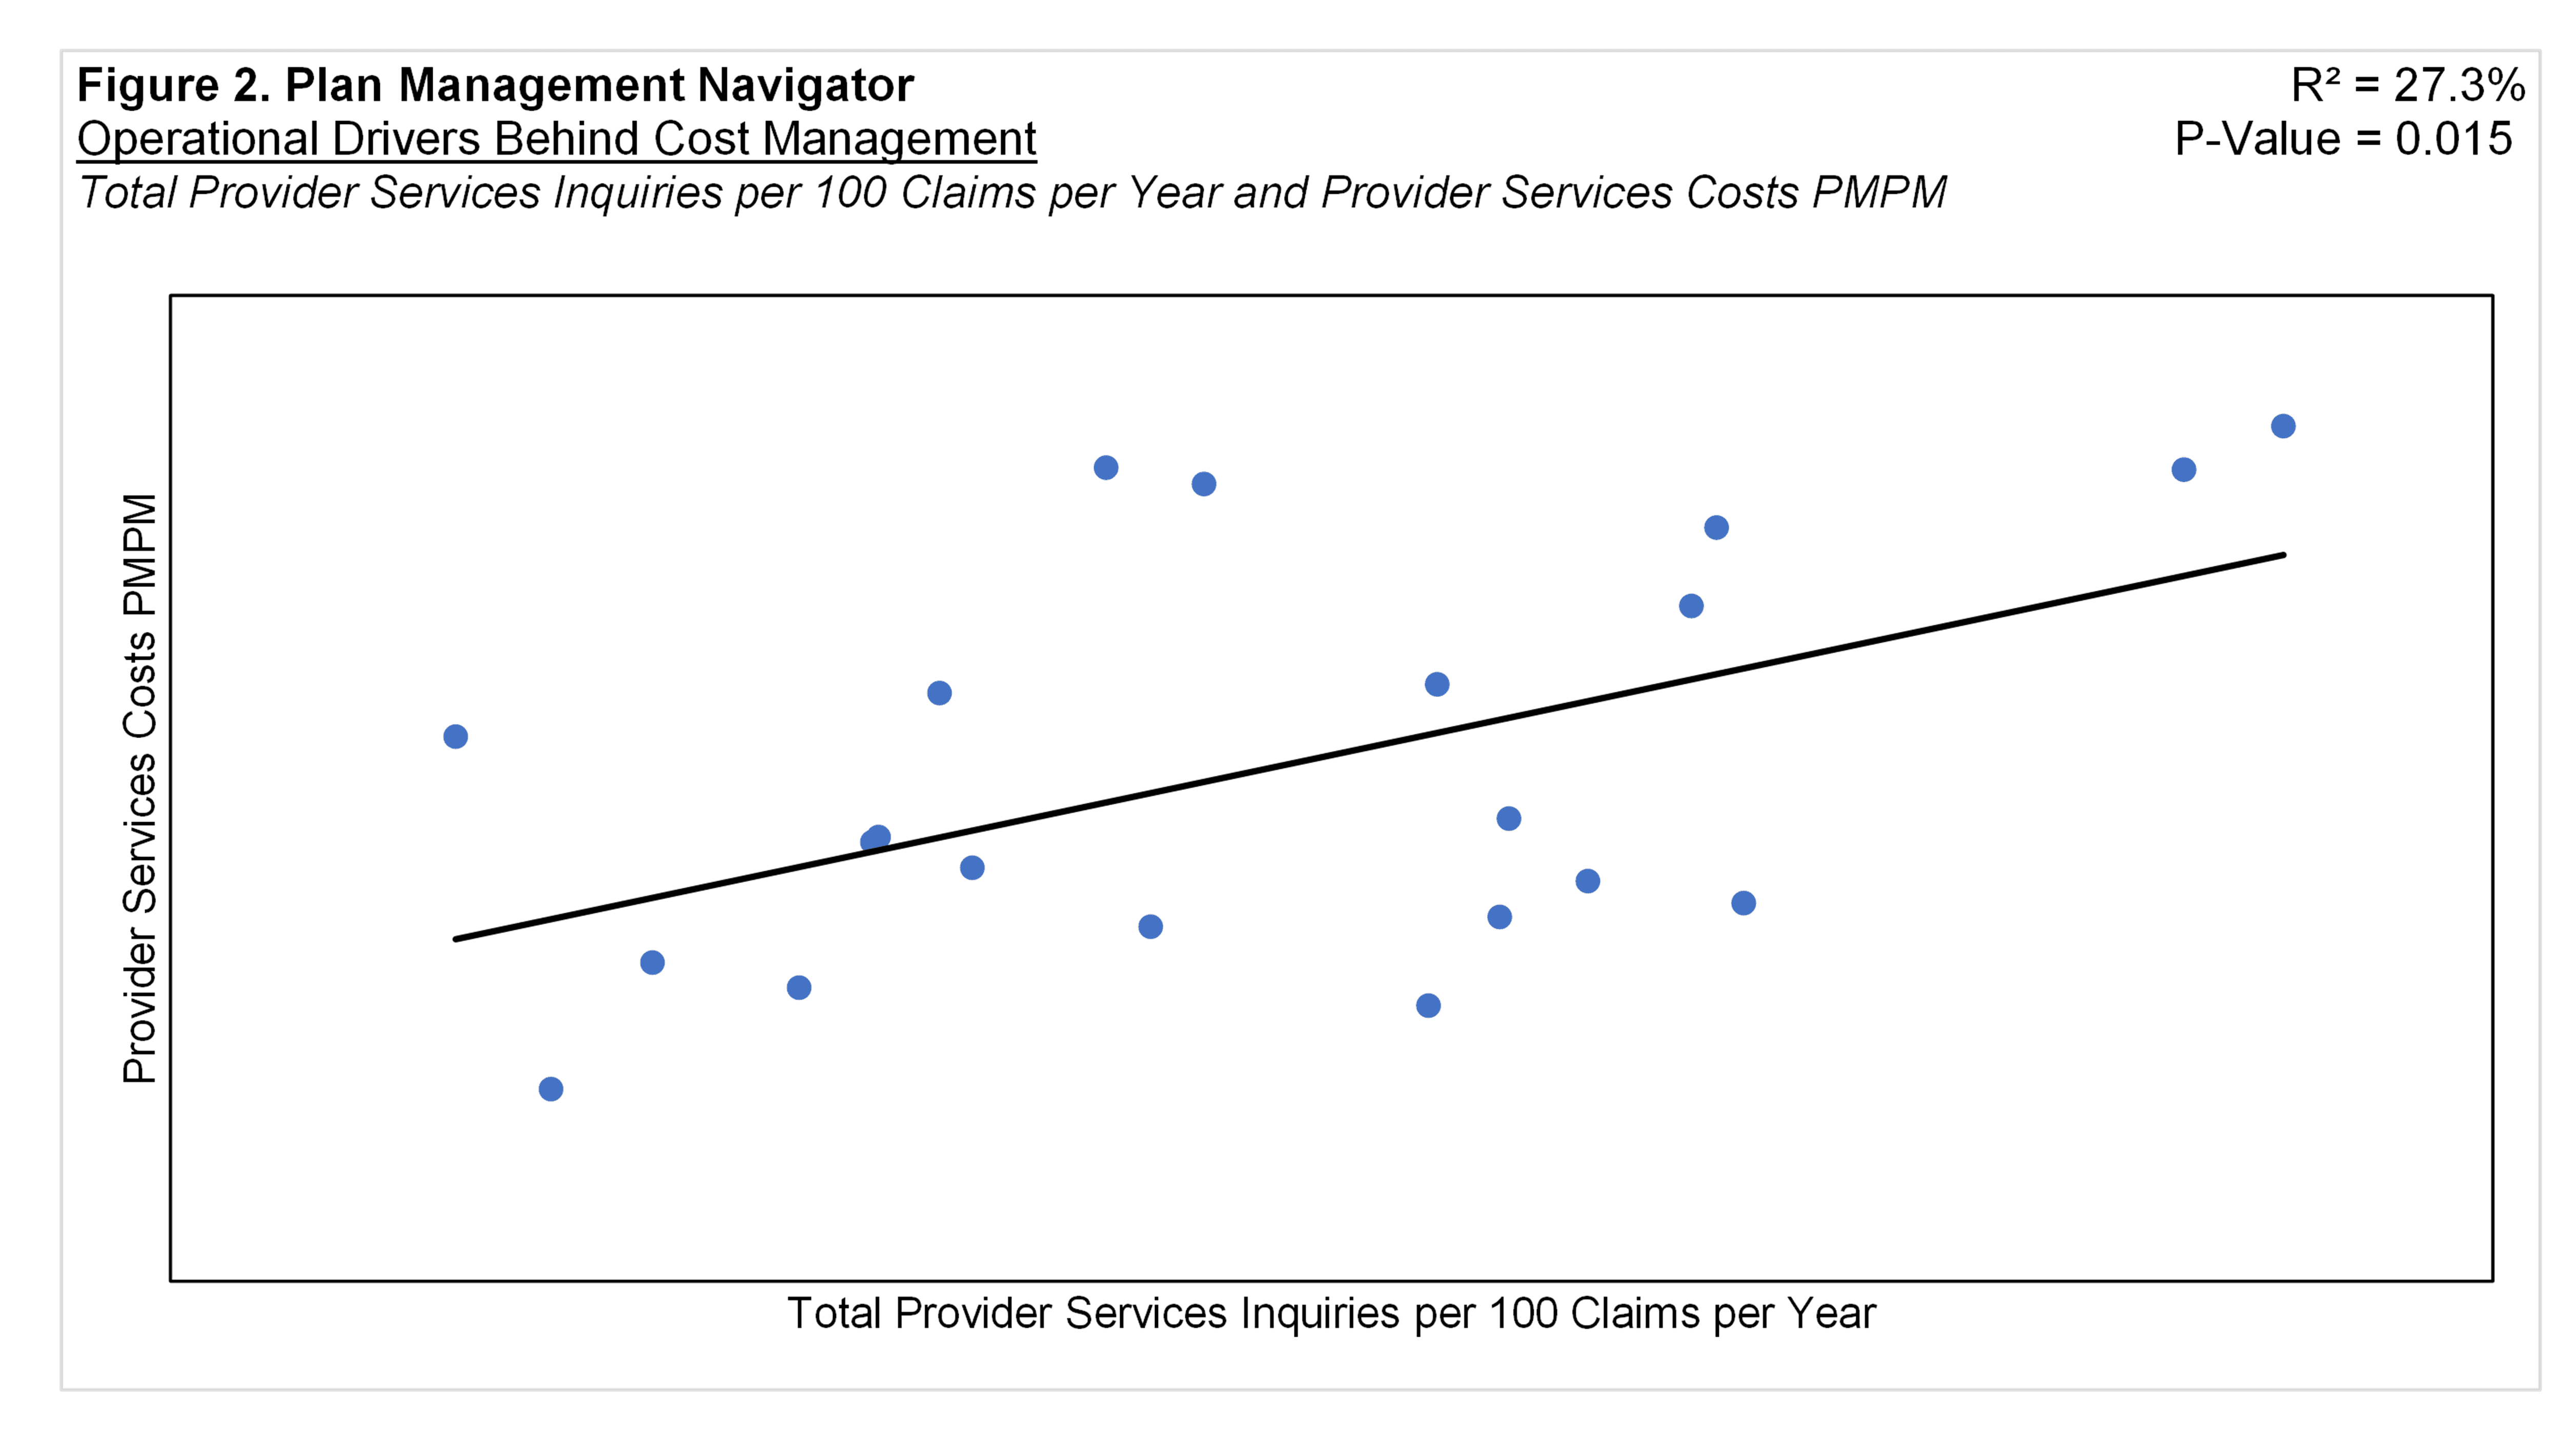
A central reason for provider service inquiries relates to health benefit claims related to patient care to members. So we standardized inquiries on a per 100 claims basis (as opposed to per member) and conducted our test again. The results seem to reinforce the conclusions in Figure 1: higher provider inquiries per 100 claims is associated with higher provider services expenses. The P-Value was 0.015 and R² was 27.3%.
Member Services
Figure 3 displays the relationship between Total Member Manual Calls per Member per Year and Member Services Costs PMPM. A manual call is a telephone contact handled by a member services representative in a call center setting. Member Services is the largest subfunction of Customer Services. Analogous to Provider Services Inquiries, it is the initial point of contact of the member to the health plan.
The resulting regression analysis produced a P-Value of 0.084 and an R² of 13.5%. The positive slope suggests that higher manual calls are associated with increased member services costs PMPM.
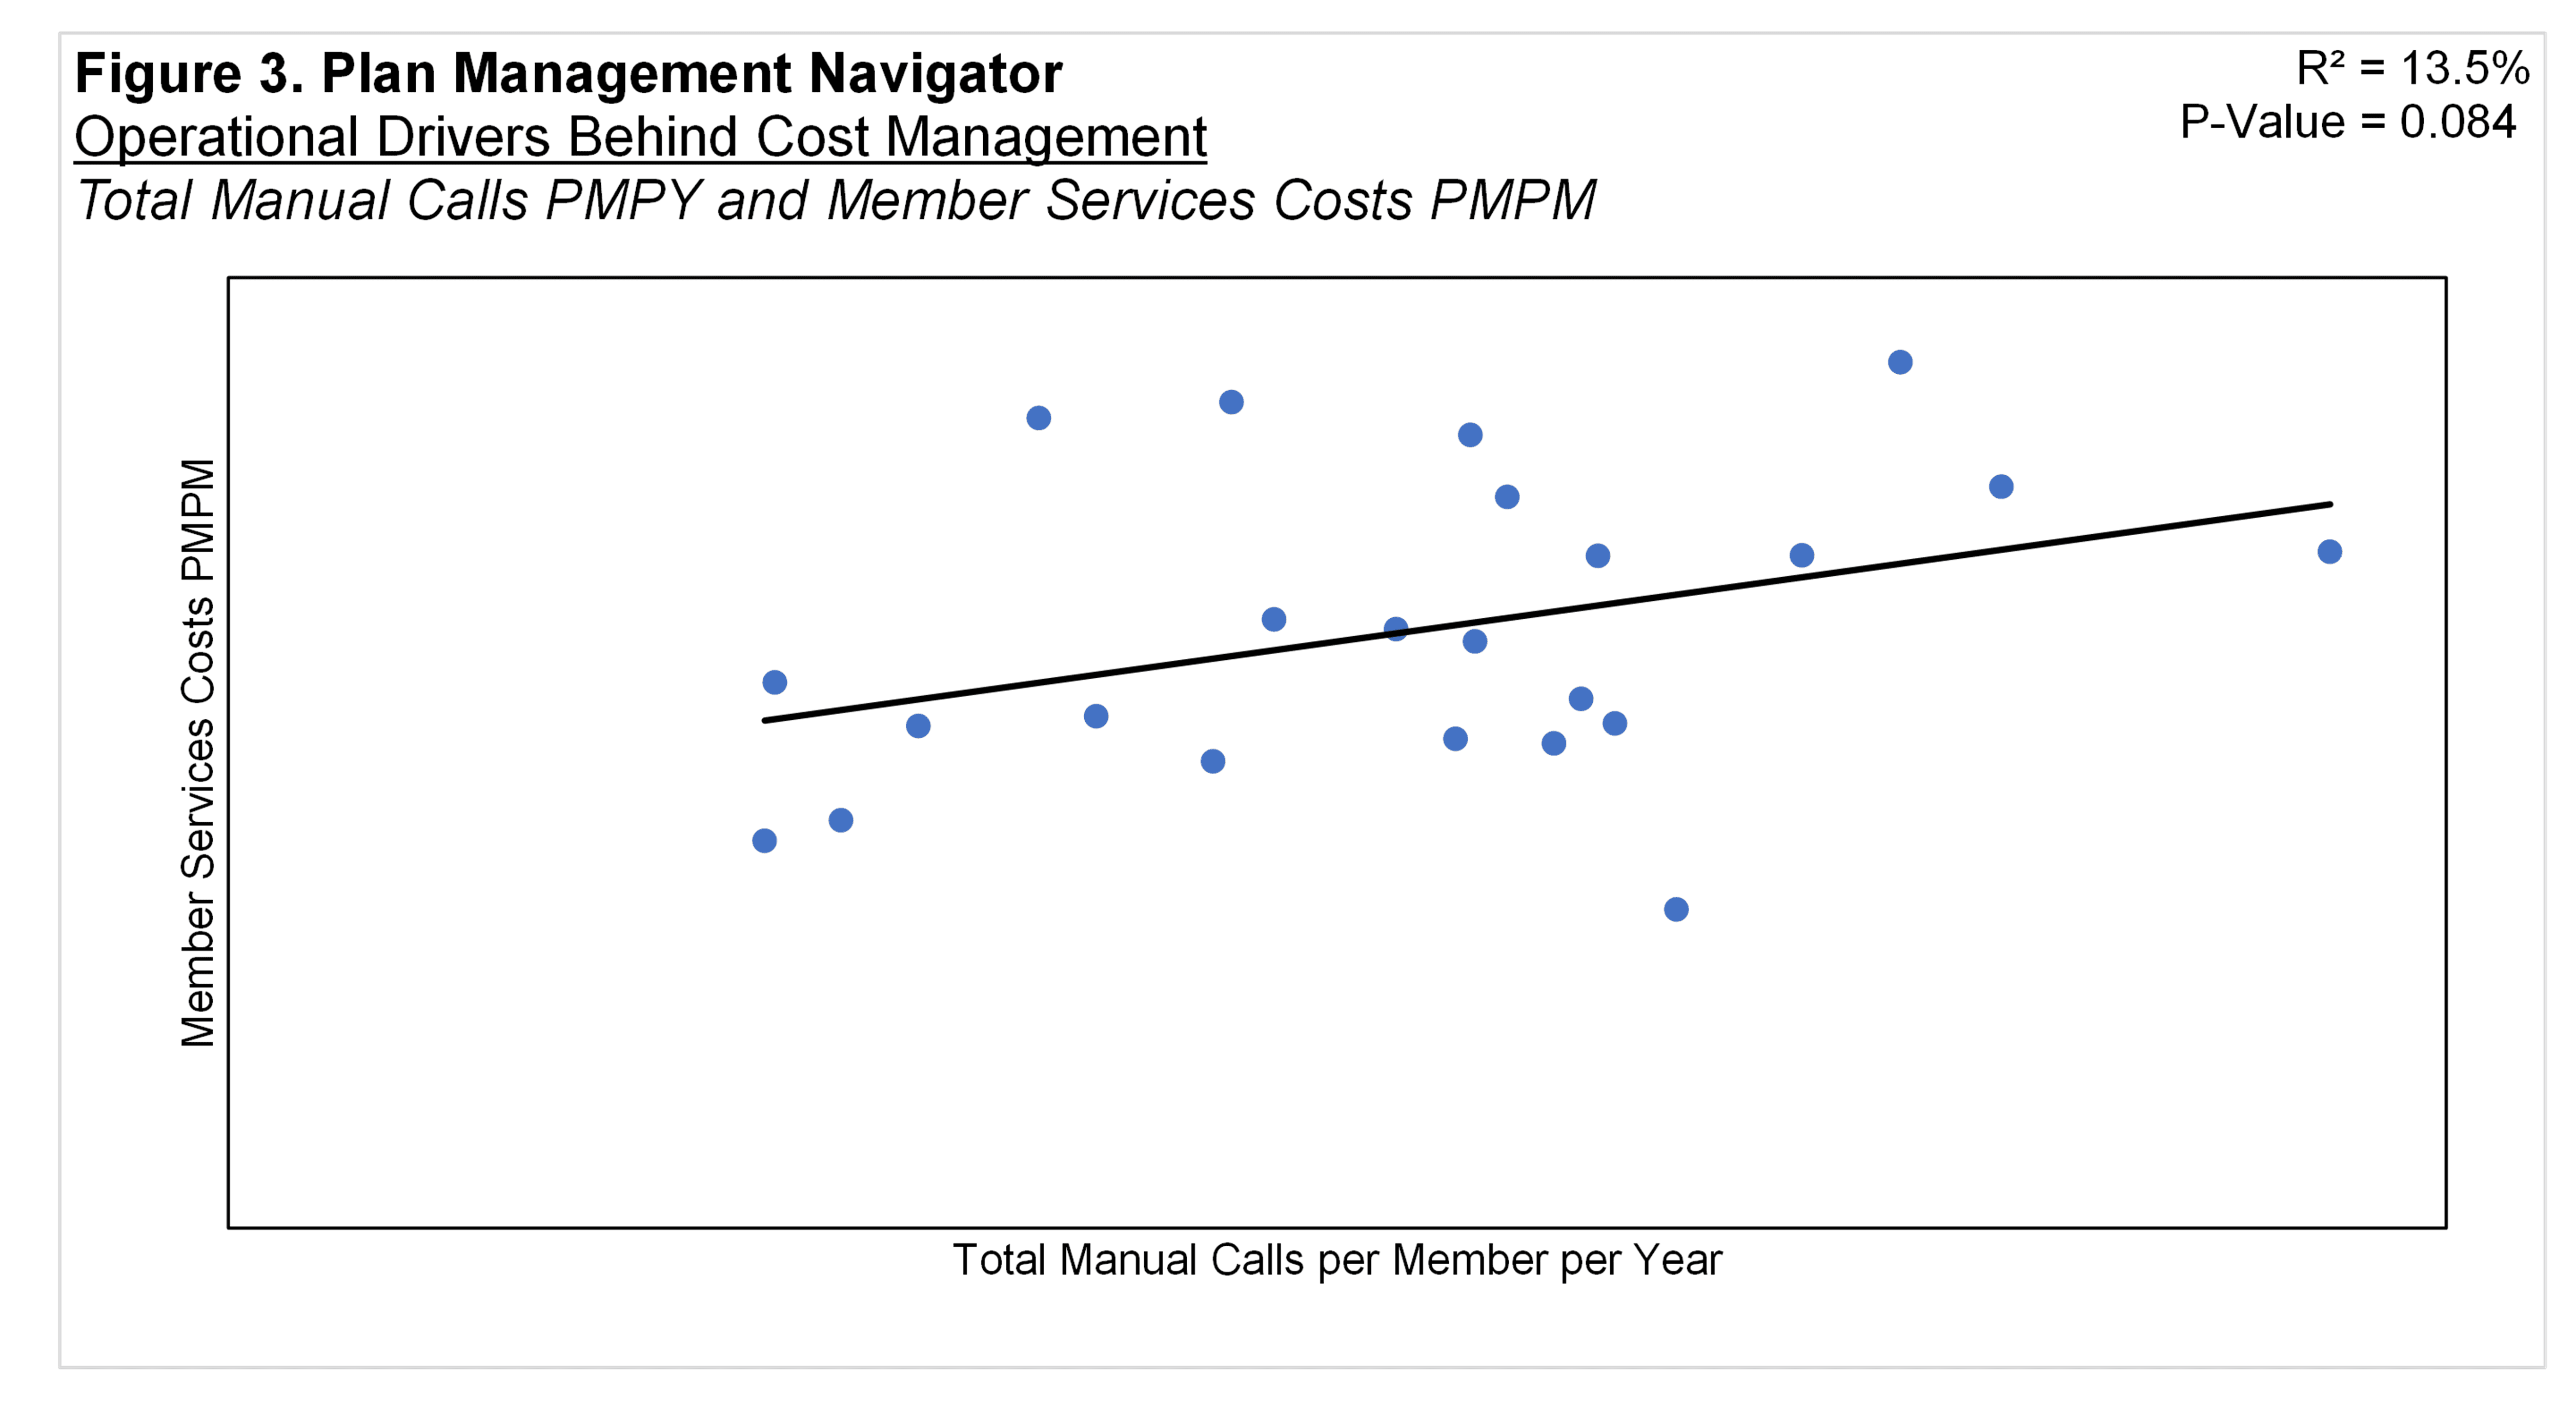
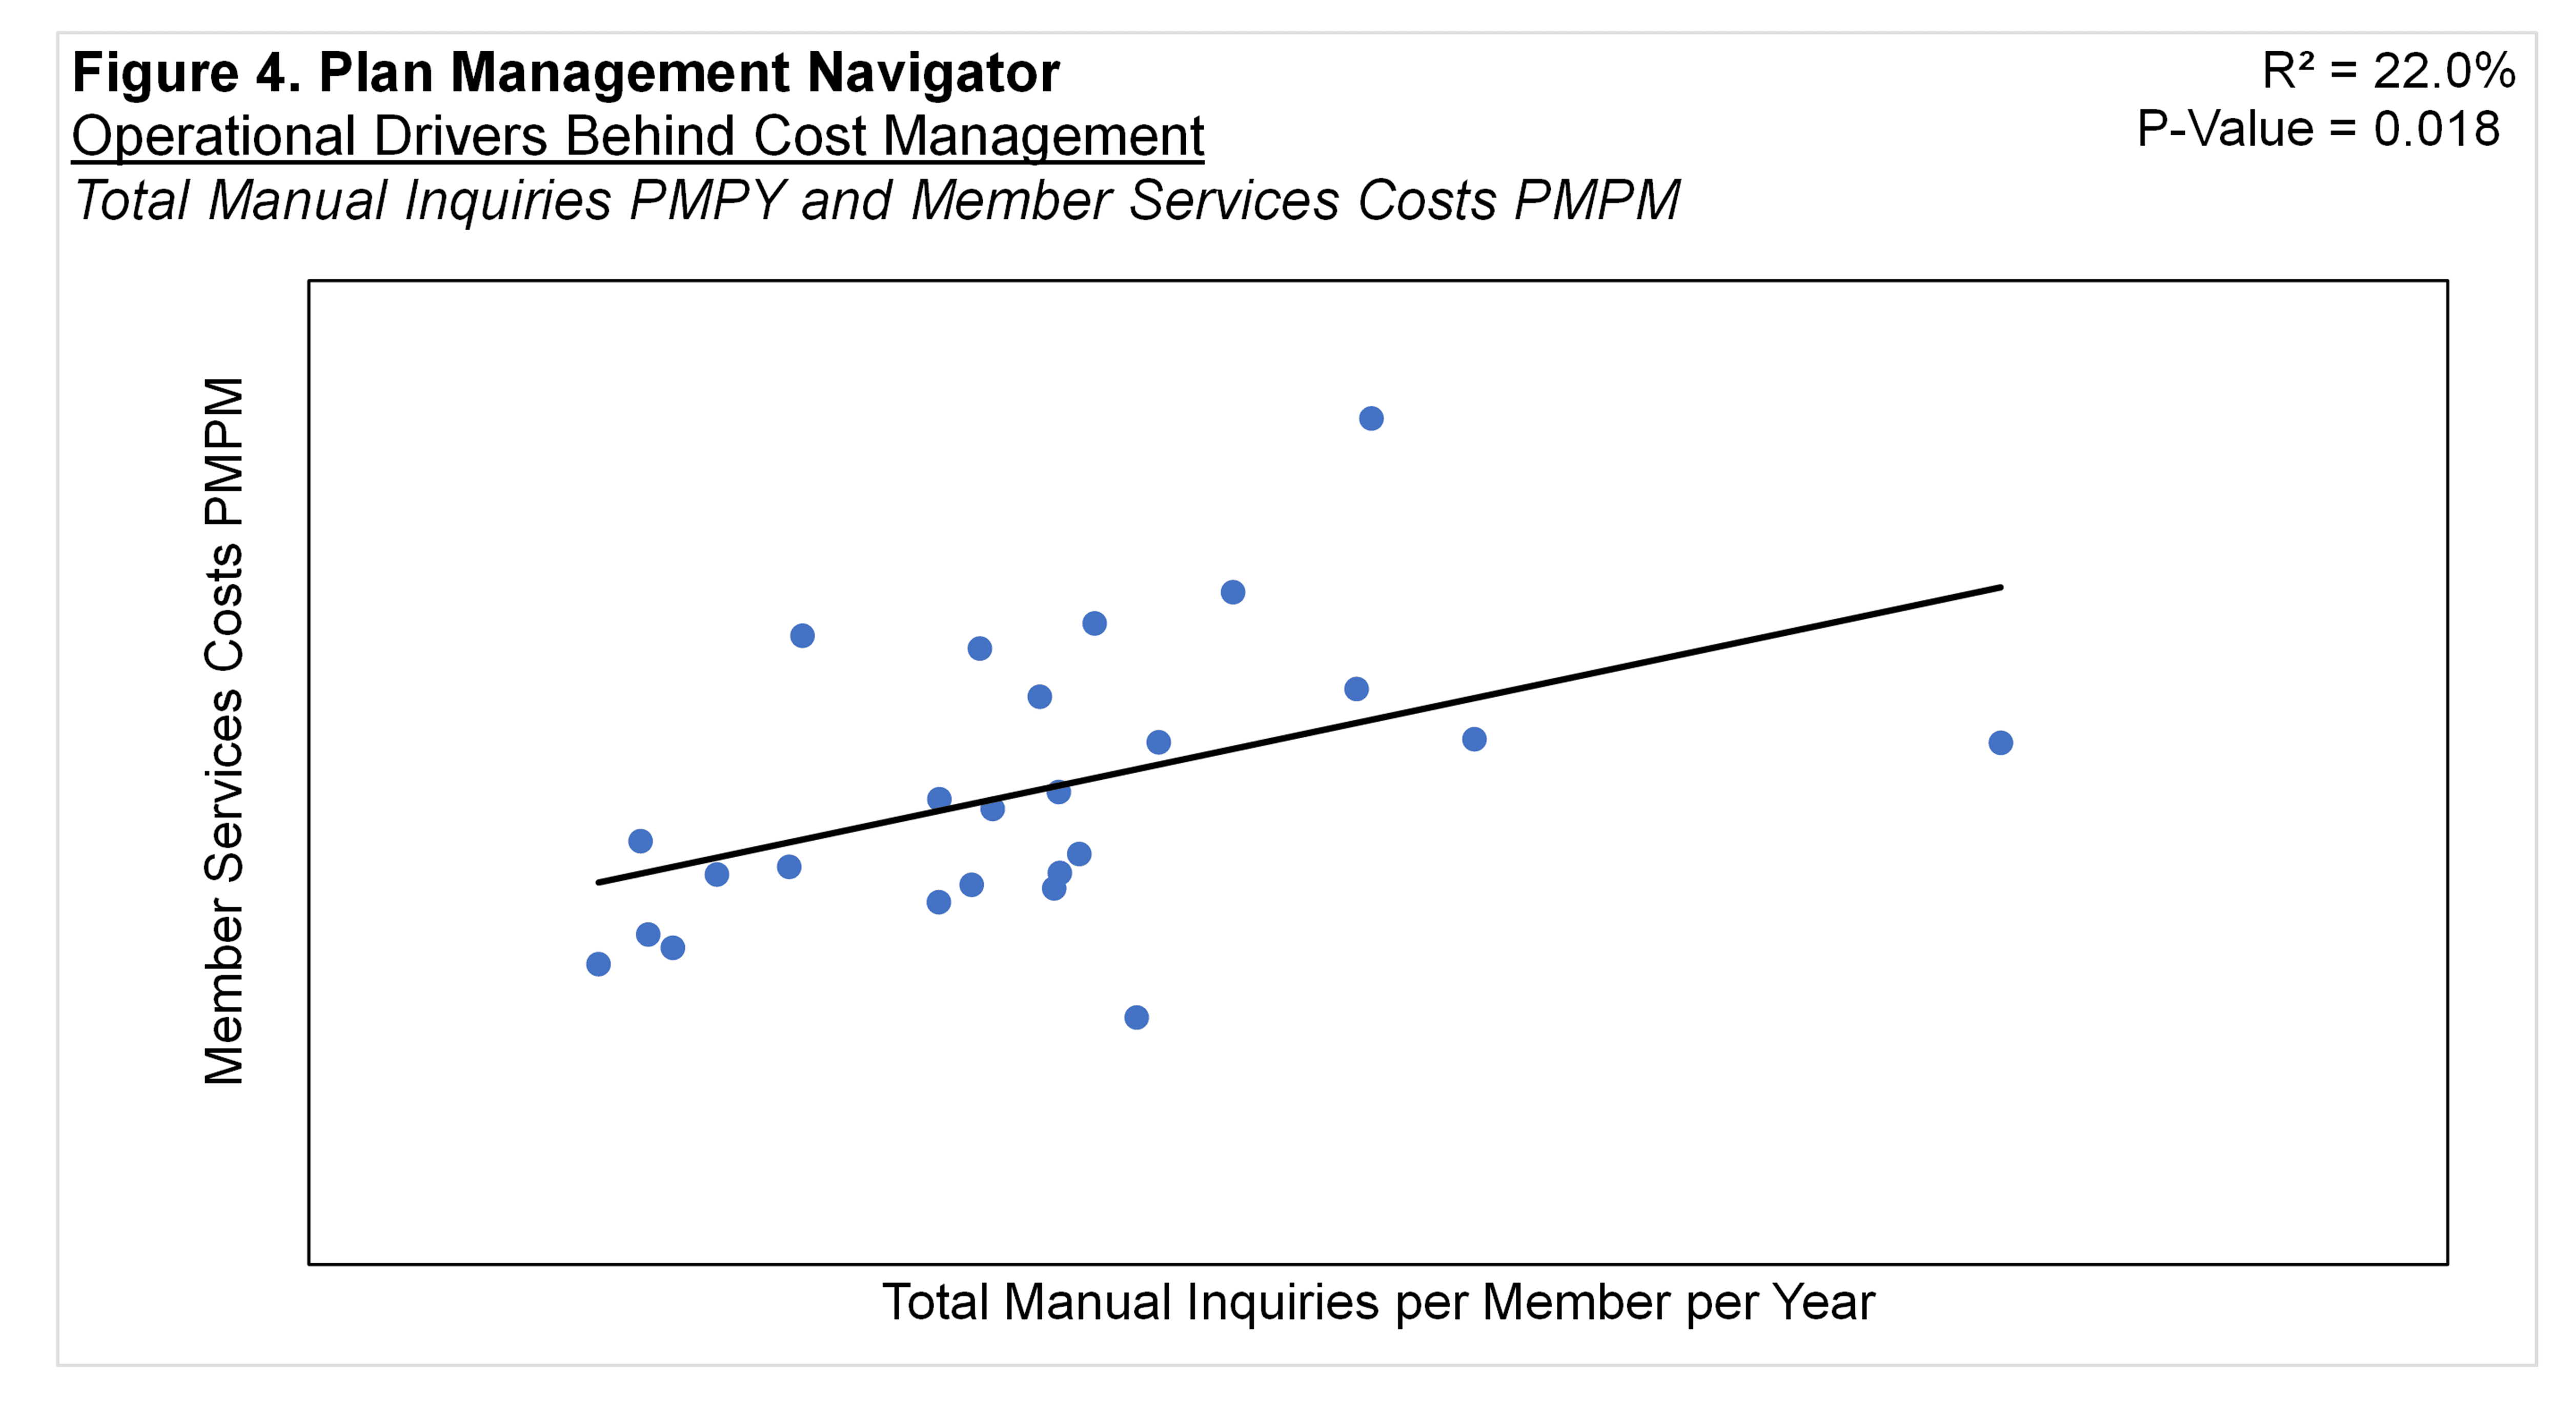
Figure 4 shows Total Manual Inquiries per Member per Year and Member Services Costs PMPM. Member contacts with health plan member services departments that entail human response are most frequently calls but can be written or emailed correspondence as well. So Total Manual Inquiries reflects Manual Calls, plus Paper/Written Inquiries and Manual Electronic Inquiries. (Like Calls, both Paper / Written Inquiries and Manual Electronic Inquiries are addressed by Customer Services Reps.) The positive relationship implies that the higher the Total Manual Inquiries, the higher the Member Services Costs PMPM. The P-Value of this regression analysis was 0.018 and R² was 22.0%.
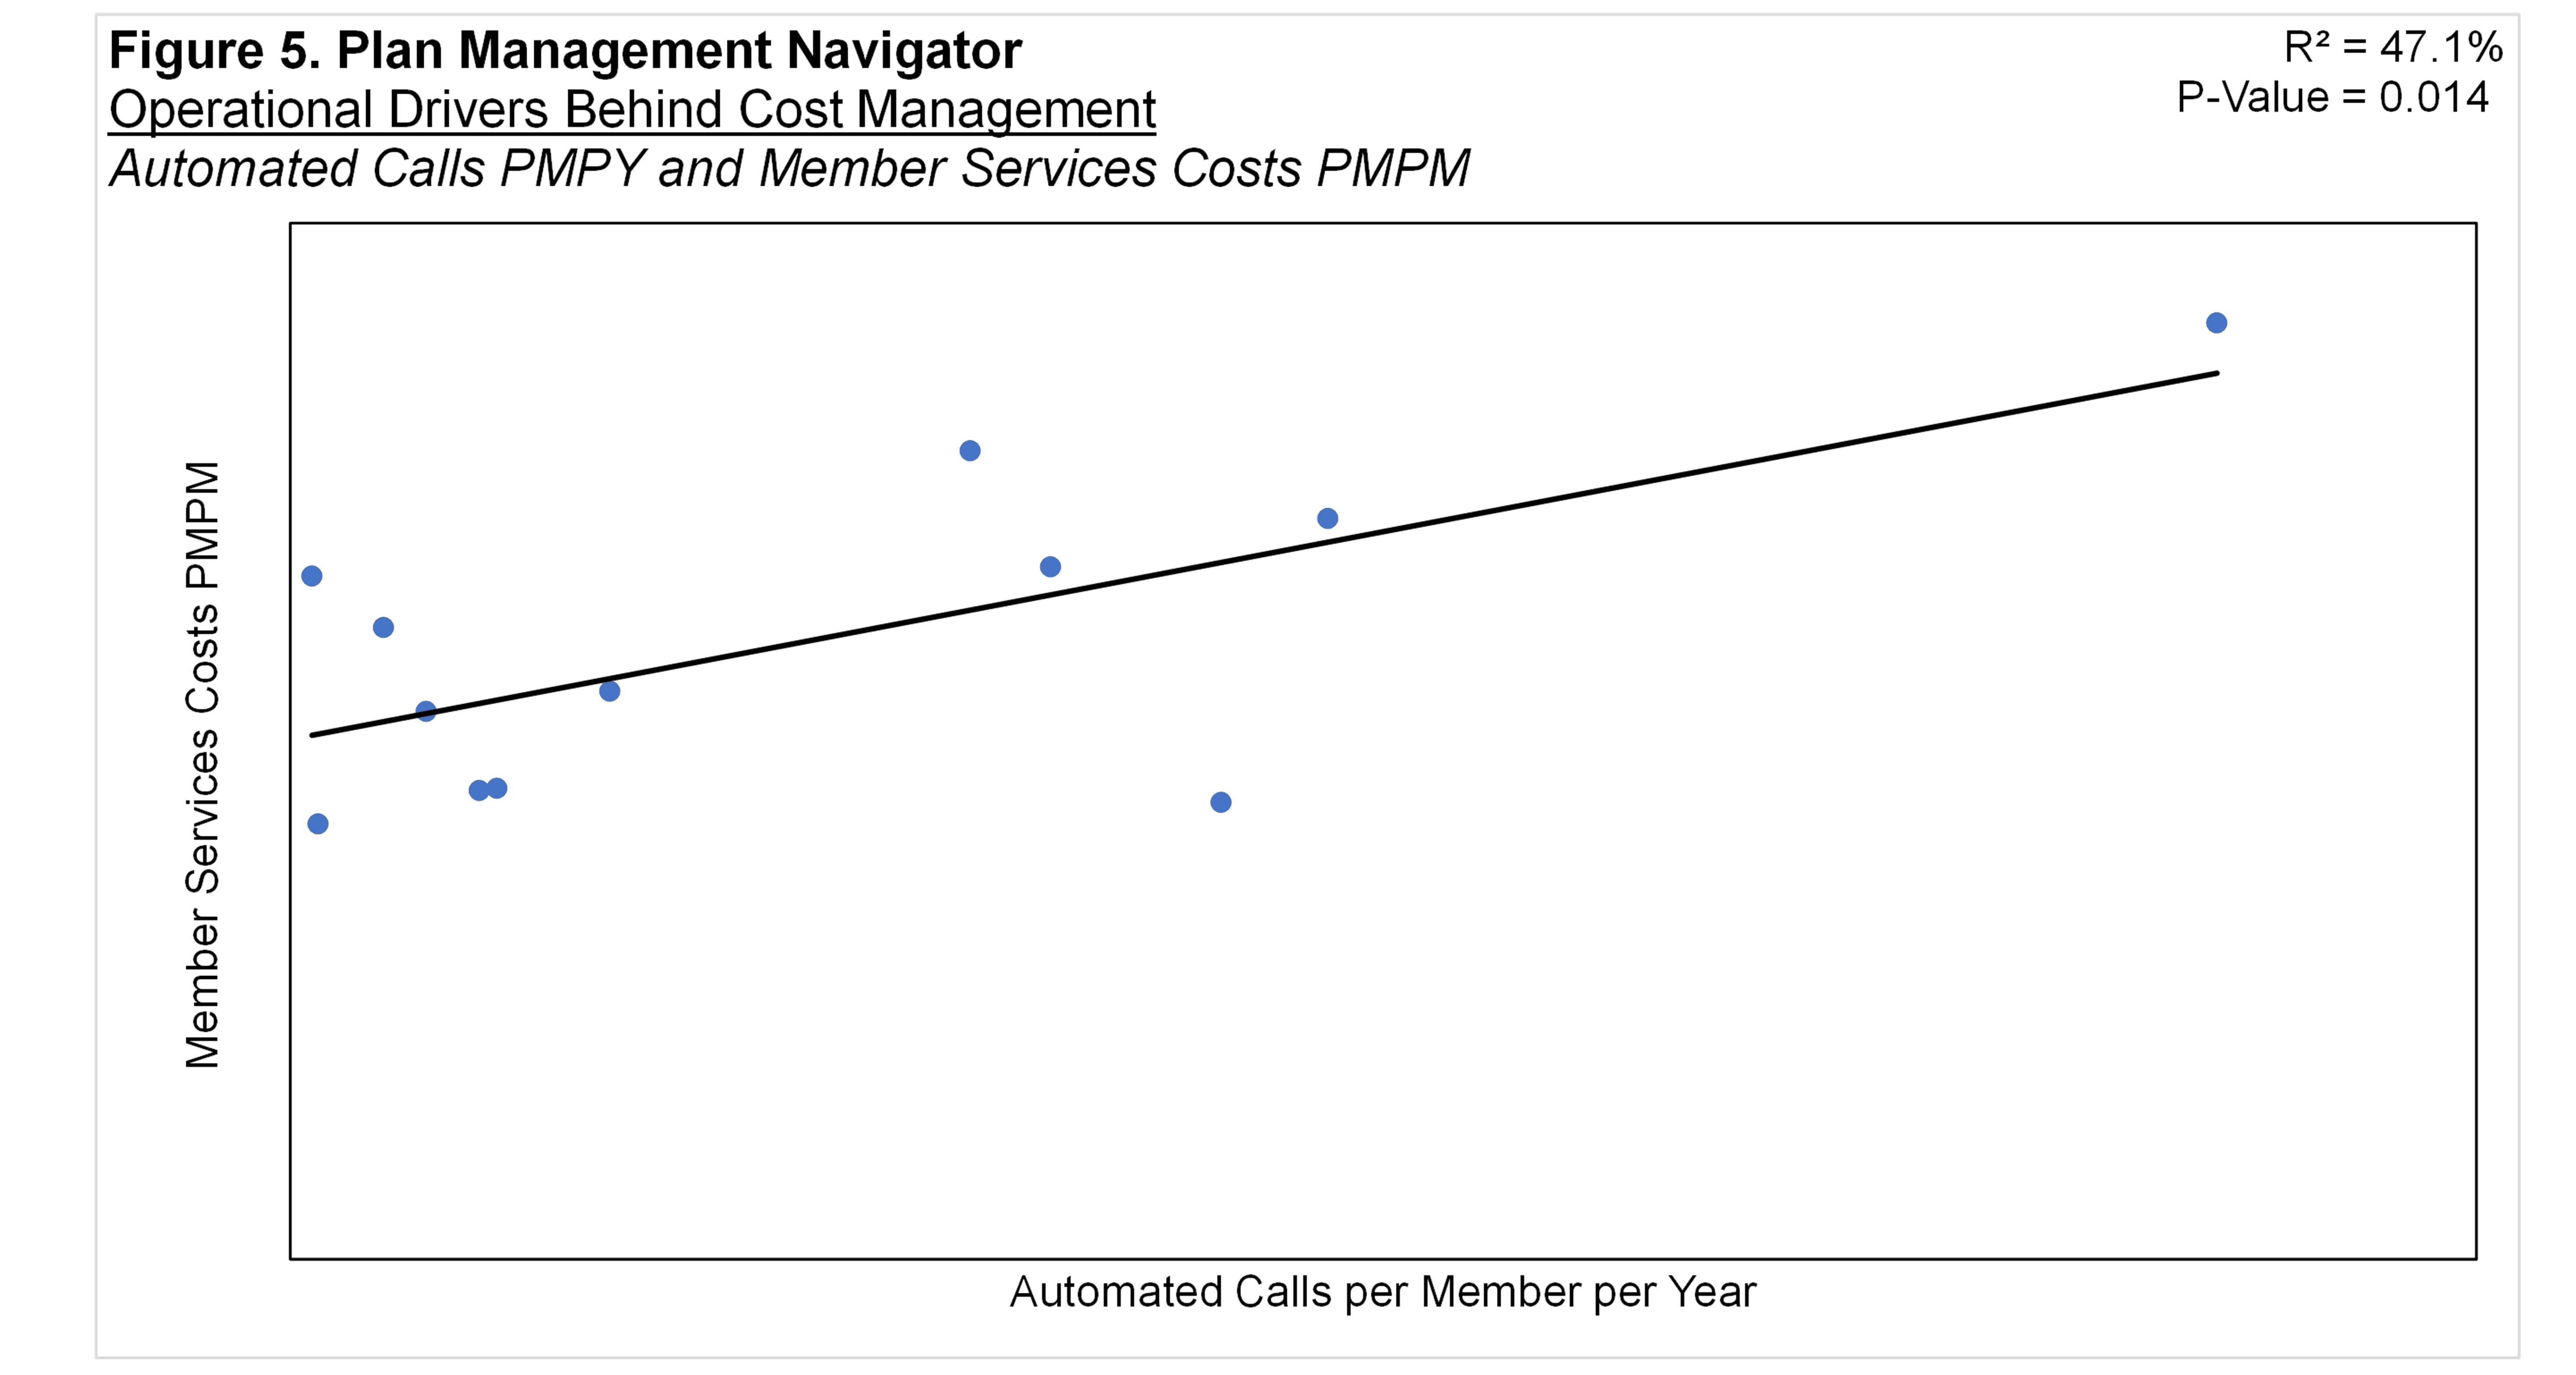
Surprisingly, the volume of Automated Calls was also positively correlated with Member Services costs. Automated Calls are those that are fully handled by an automated system rather than a customer service rep. The regression analysis resulted in a P-Value of 0.014 and R² of 47.1%, shown in Figure 5. The positive slope implies that the higher the number of calls handled automatically, the higher the PMPM Costs in Member Services.
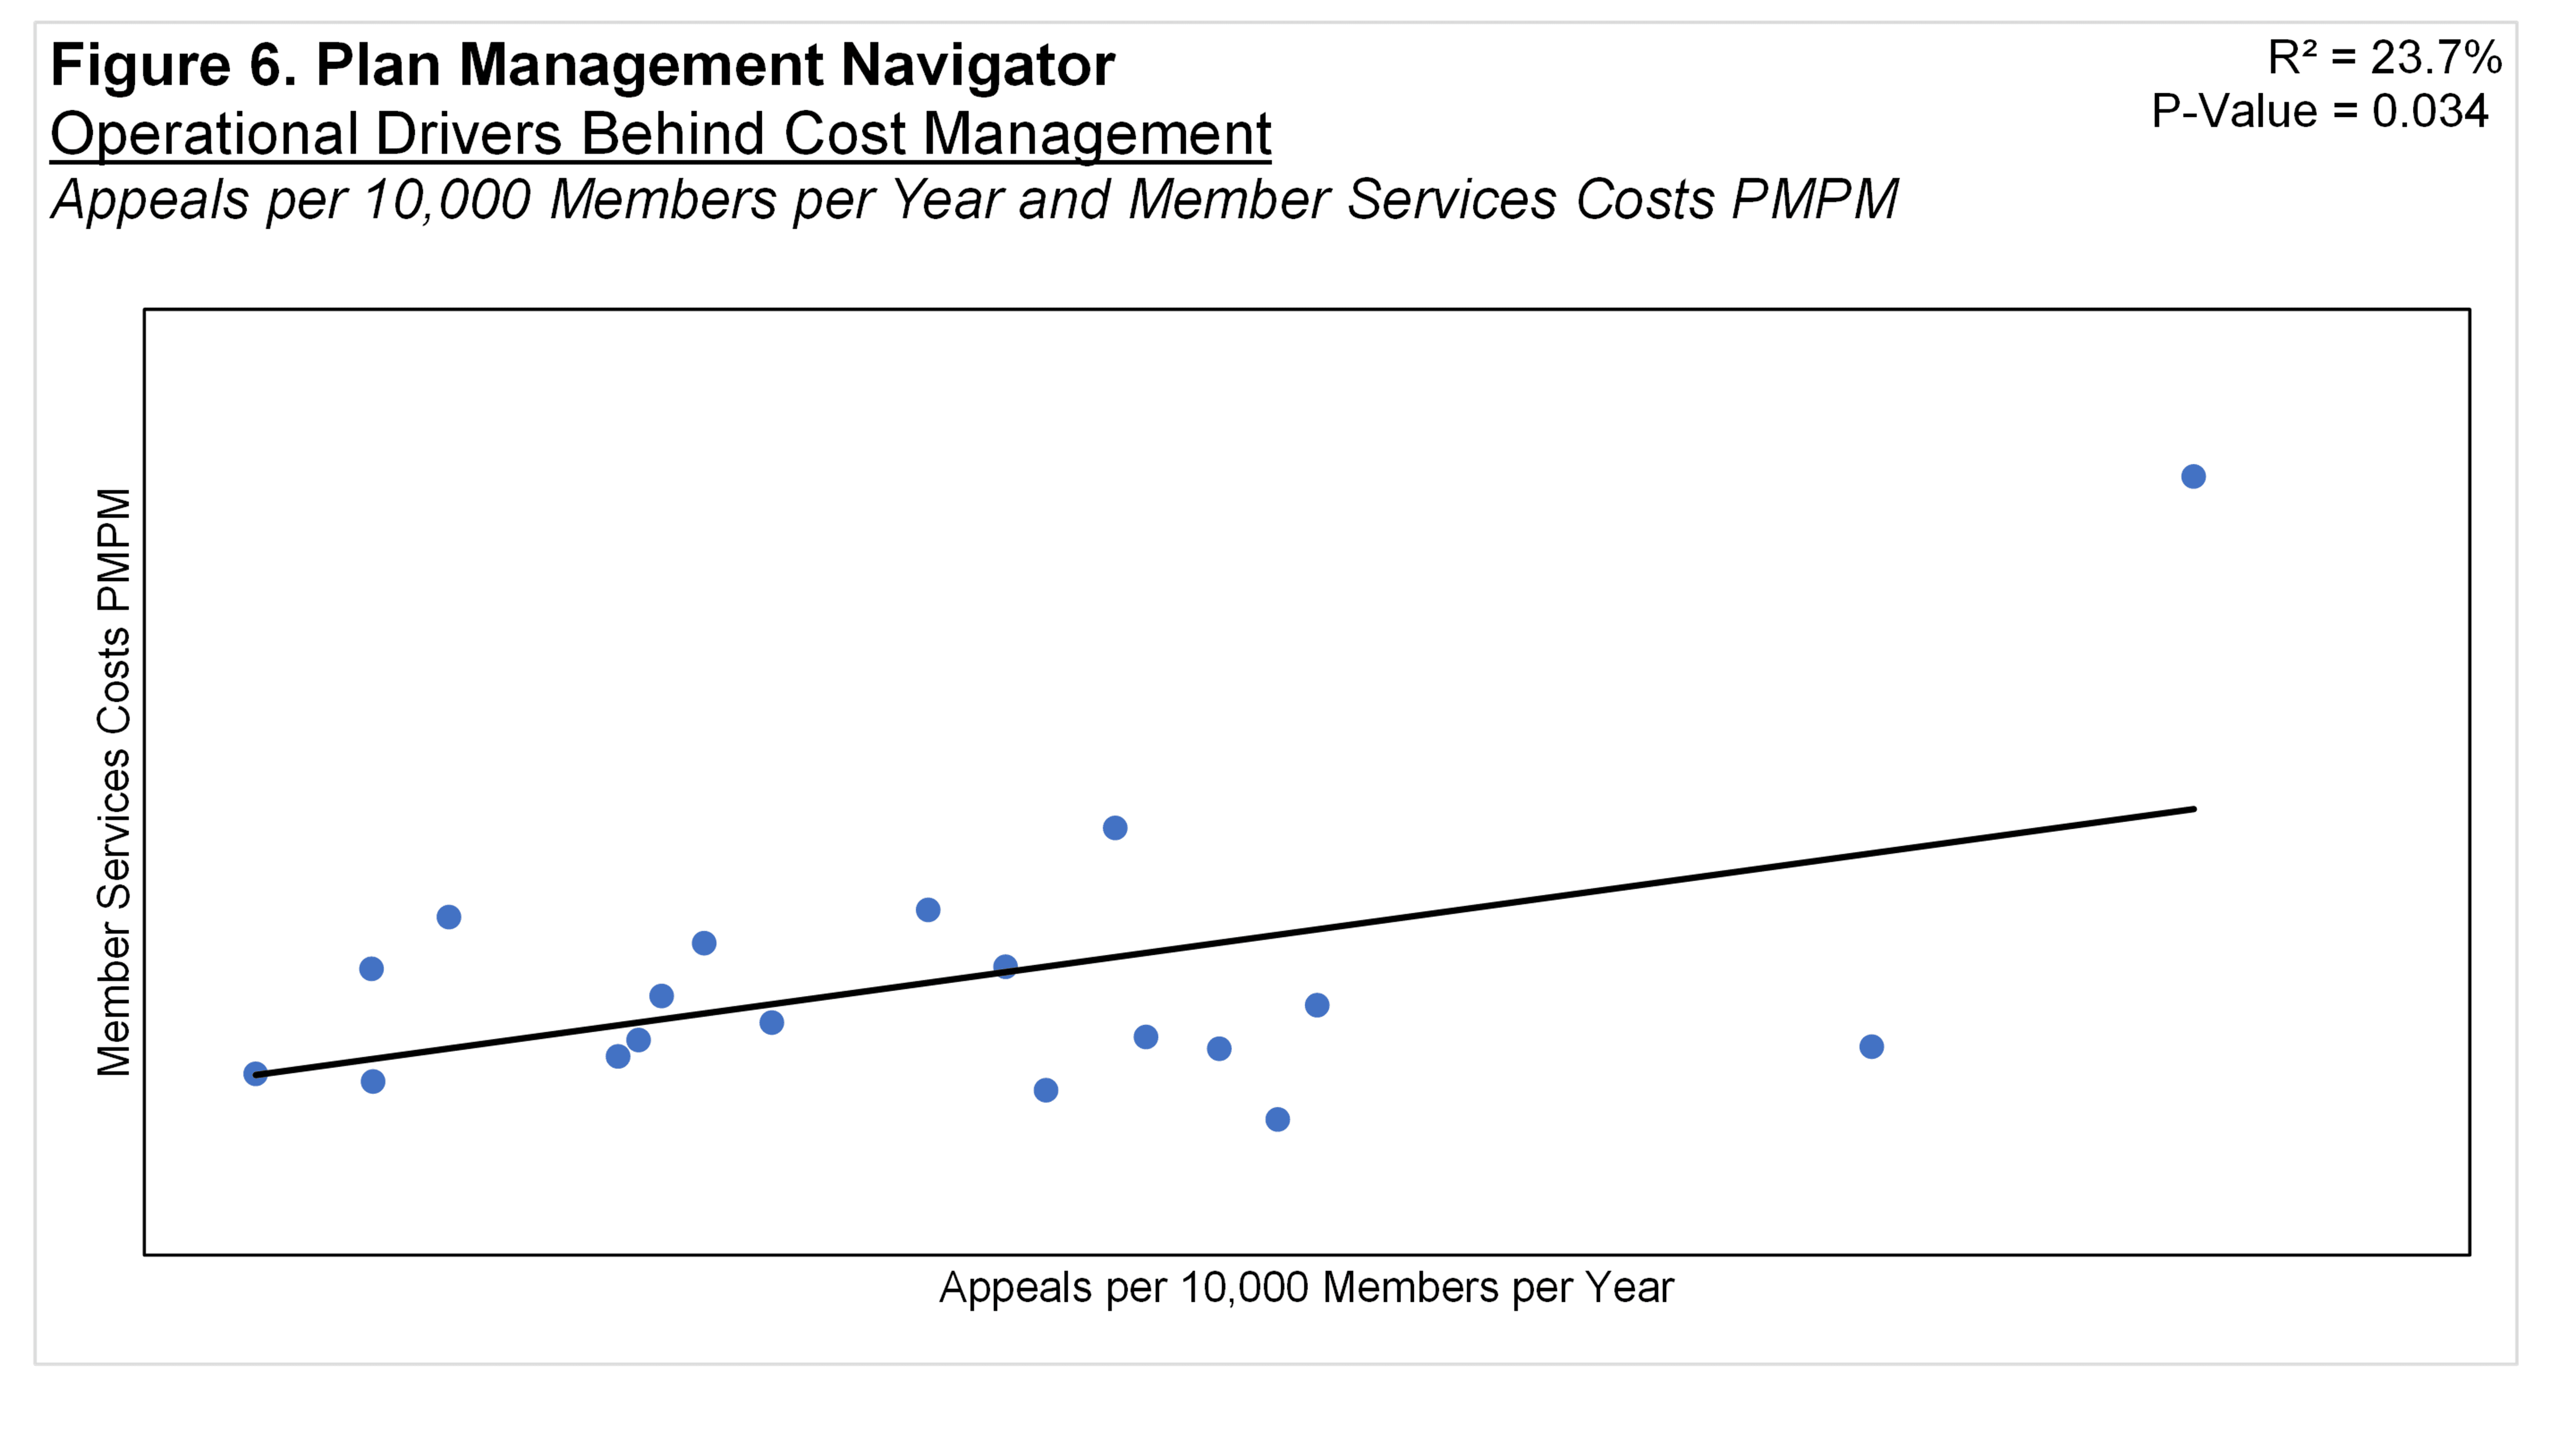
An "appeal" is a request to change a claims decision made by the plan. They may arise from both members and providers. Figure 6 shows that there is a positive correlation between Appeals per 10,000 Members per Year and Member Services Costs PMPM. The positive slope implies that the greater the number of appeals per 10,000 members, the higher the member services costs PMPM. The P-Value was 0.034 and R² was 23.7%.
Automation
Most health plan claims are processed automatically through Information Systems. Automation varies by health plan, and also by sector: TPAs tend to be lower than the greater than 80% normally experienced by health plans. Auto-Adjudicated claims are those claims adjudicated by the IS claims processing system without manual intervention. An auto-adjudicated claim may also include those that fail routine auto adjudication, and are instead processed by "scripts". Scripts are mini-programs that extend existing autoadjudication rules. The costs of claims that are auto-adjudicated are borne by Information Systems.
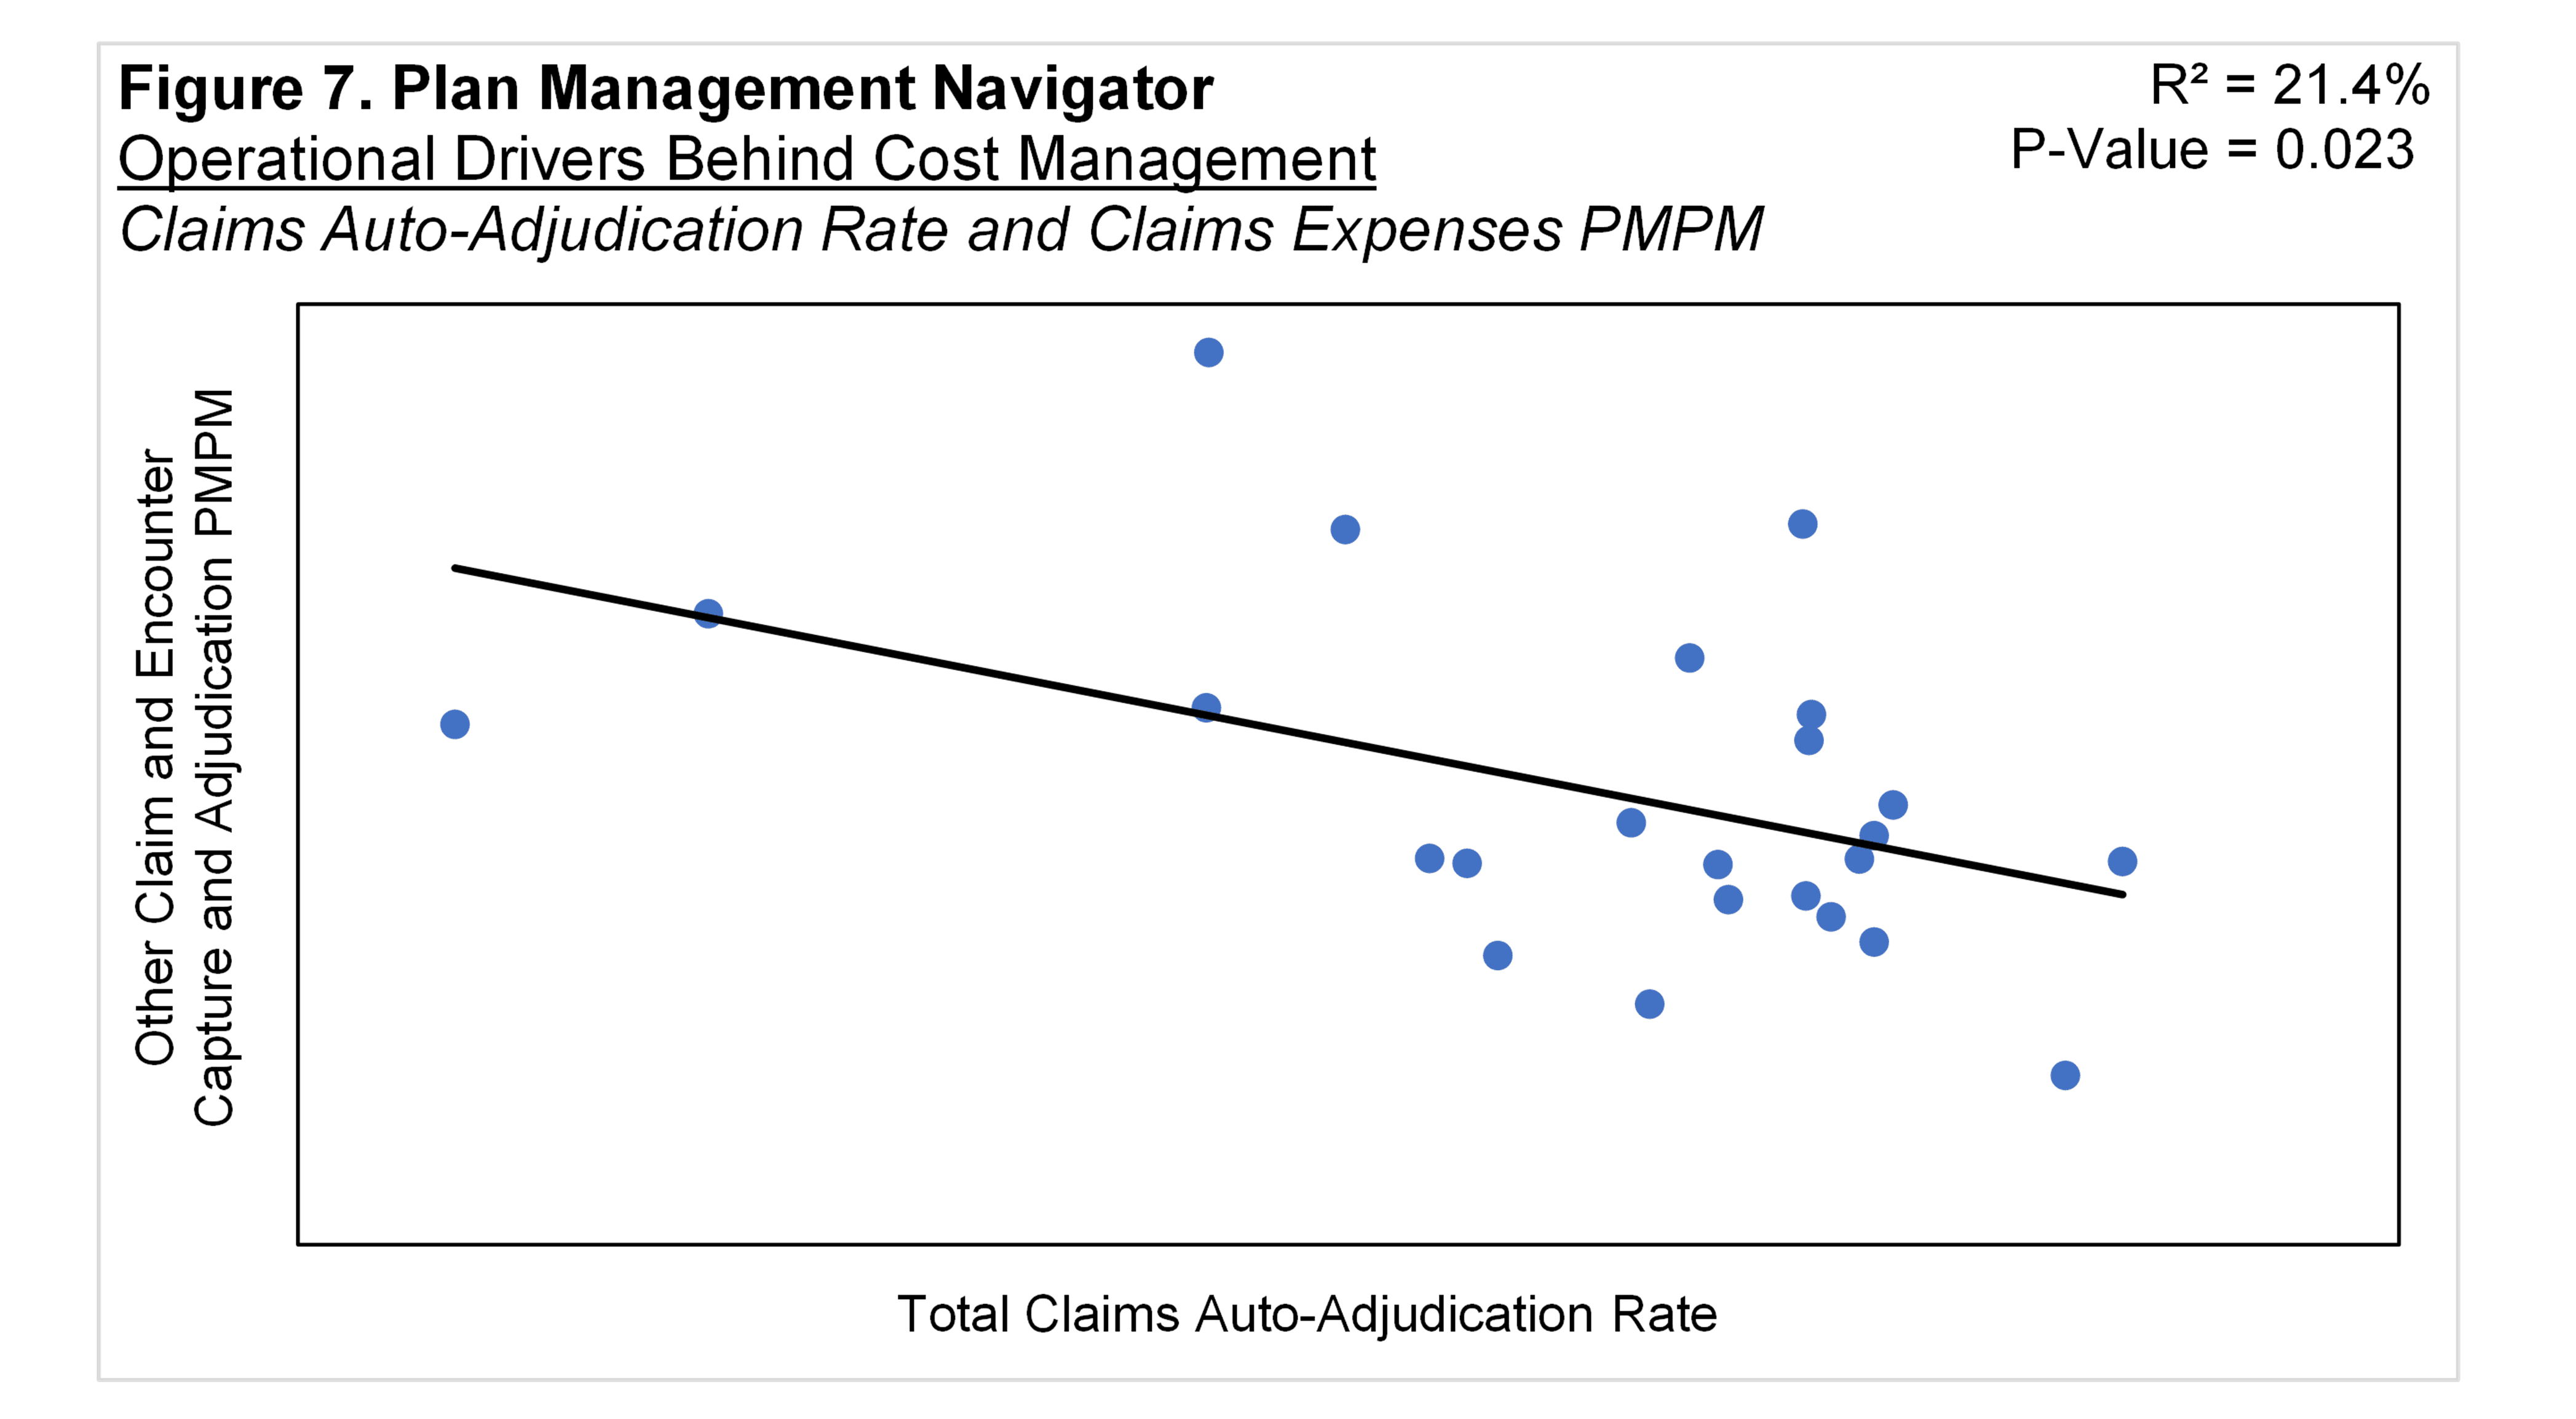
By contrast, the Claims function has the responsibility and incurs the expense to manually process the claims that are not auto-adjudicated. Auto-adjudicated claims processed through Information Systems should require fewer manually processed claims and therefore fewer costs in the Claims function. This is shown in Figure 7, resulting in a P-Value of 0.023 and R² of 21.4%. The inverse relationship implies that higher the rate of auto-adjudicated claims the lower the costs in the Other Claims sub-function. (Note that the Other Claims sub-function represents the majority of costs within the Claim functional area. Activities in the Other Claims sub-function reflect the mainly manual processes.)
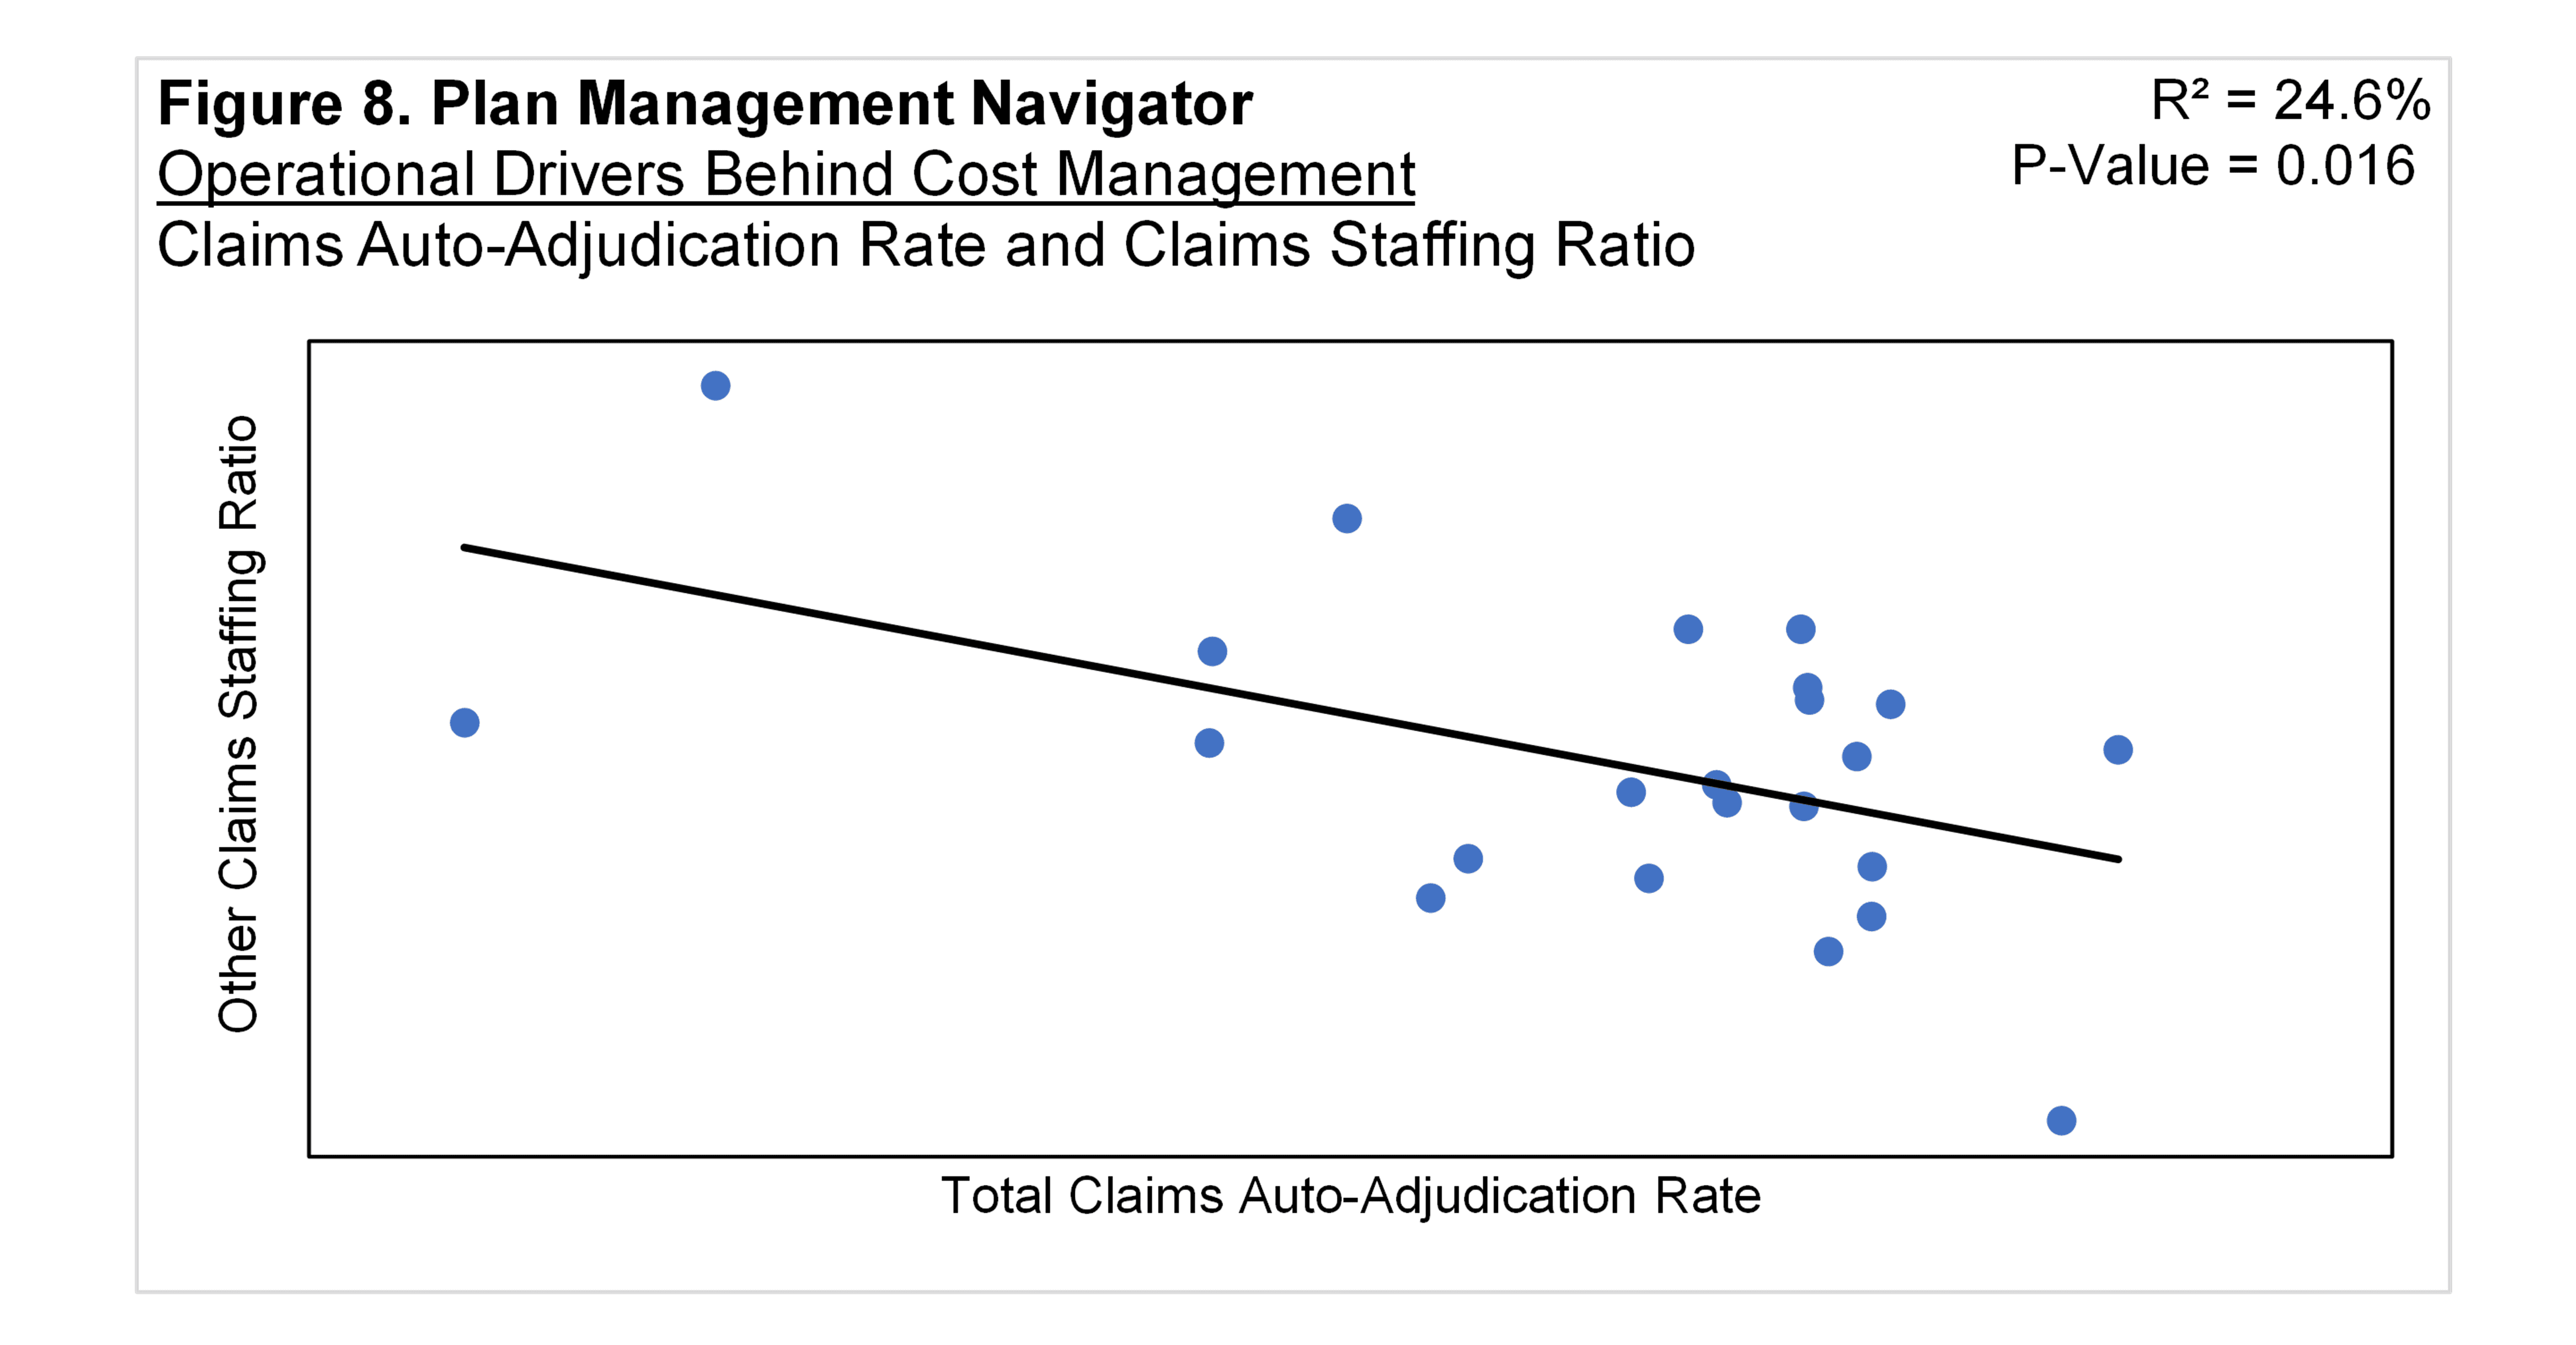
A similar relationship is indicated in staffing ratios in the Other Claims function. The higher the claims auto-adjudication rate, the fewer staff are found in the Other Claims function. This relationship is shown in Figure 8, with a P-Value of 0.016 and R² of 24.6% for Comprehensive Total.
It may be that automation of claims is paralleled by automation and lower costs across functional areas other than Claims. However, aside from auto-adjudication, no specific measures of other function-level automation are available. Therefore, our conjecture is that auto-adjudication may be an indicator of the degree of automation in other functions. In fact, Sherlock Benchmark participants report Information Systems applications in support of Enrollment and Customer Services, as well the Claim and Encounter Capture and Adjudication function within the Account and Membership Administration Cluster.
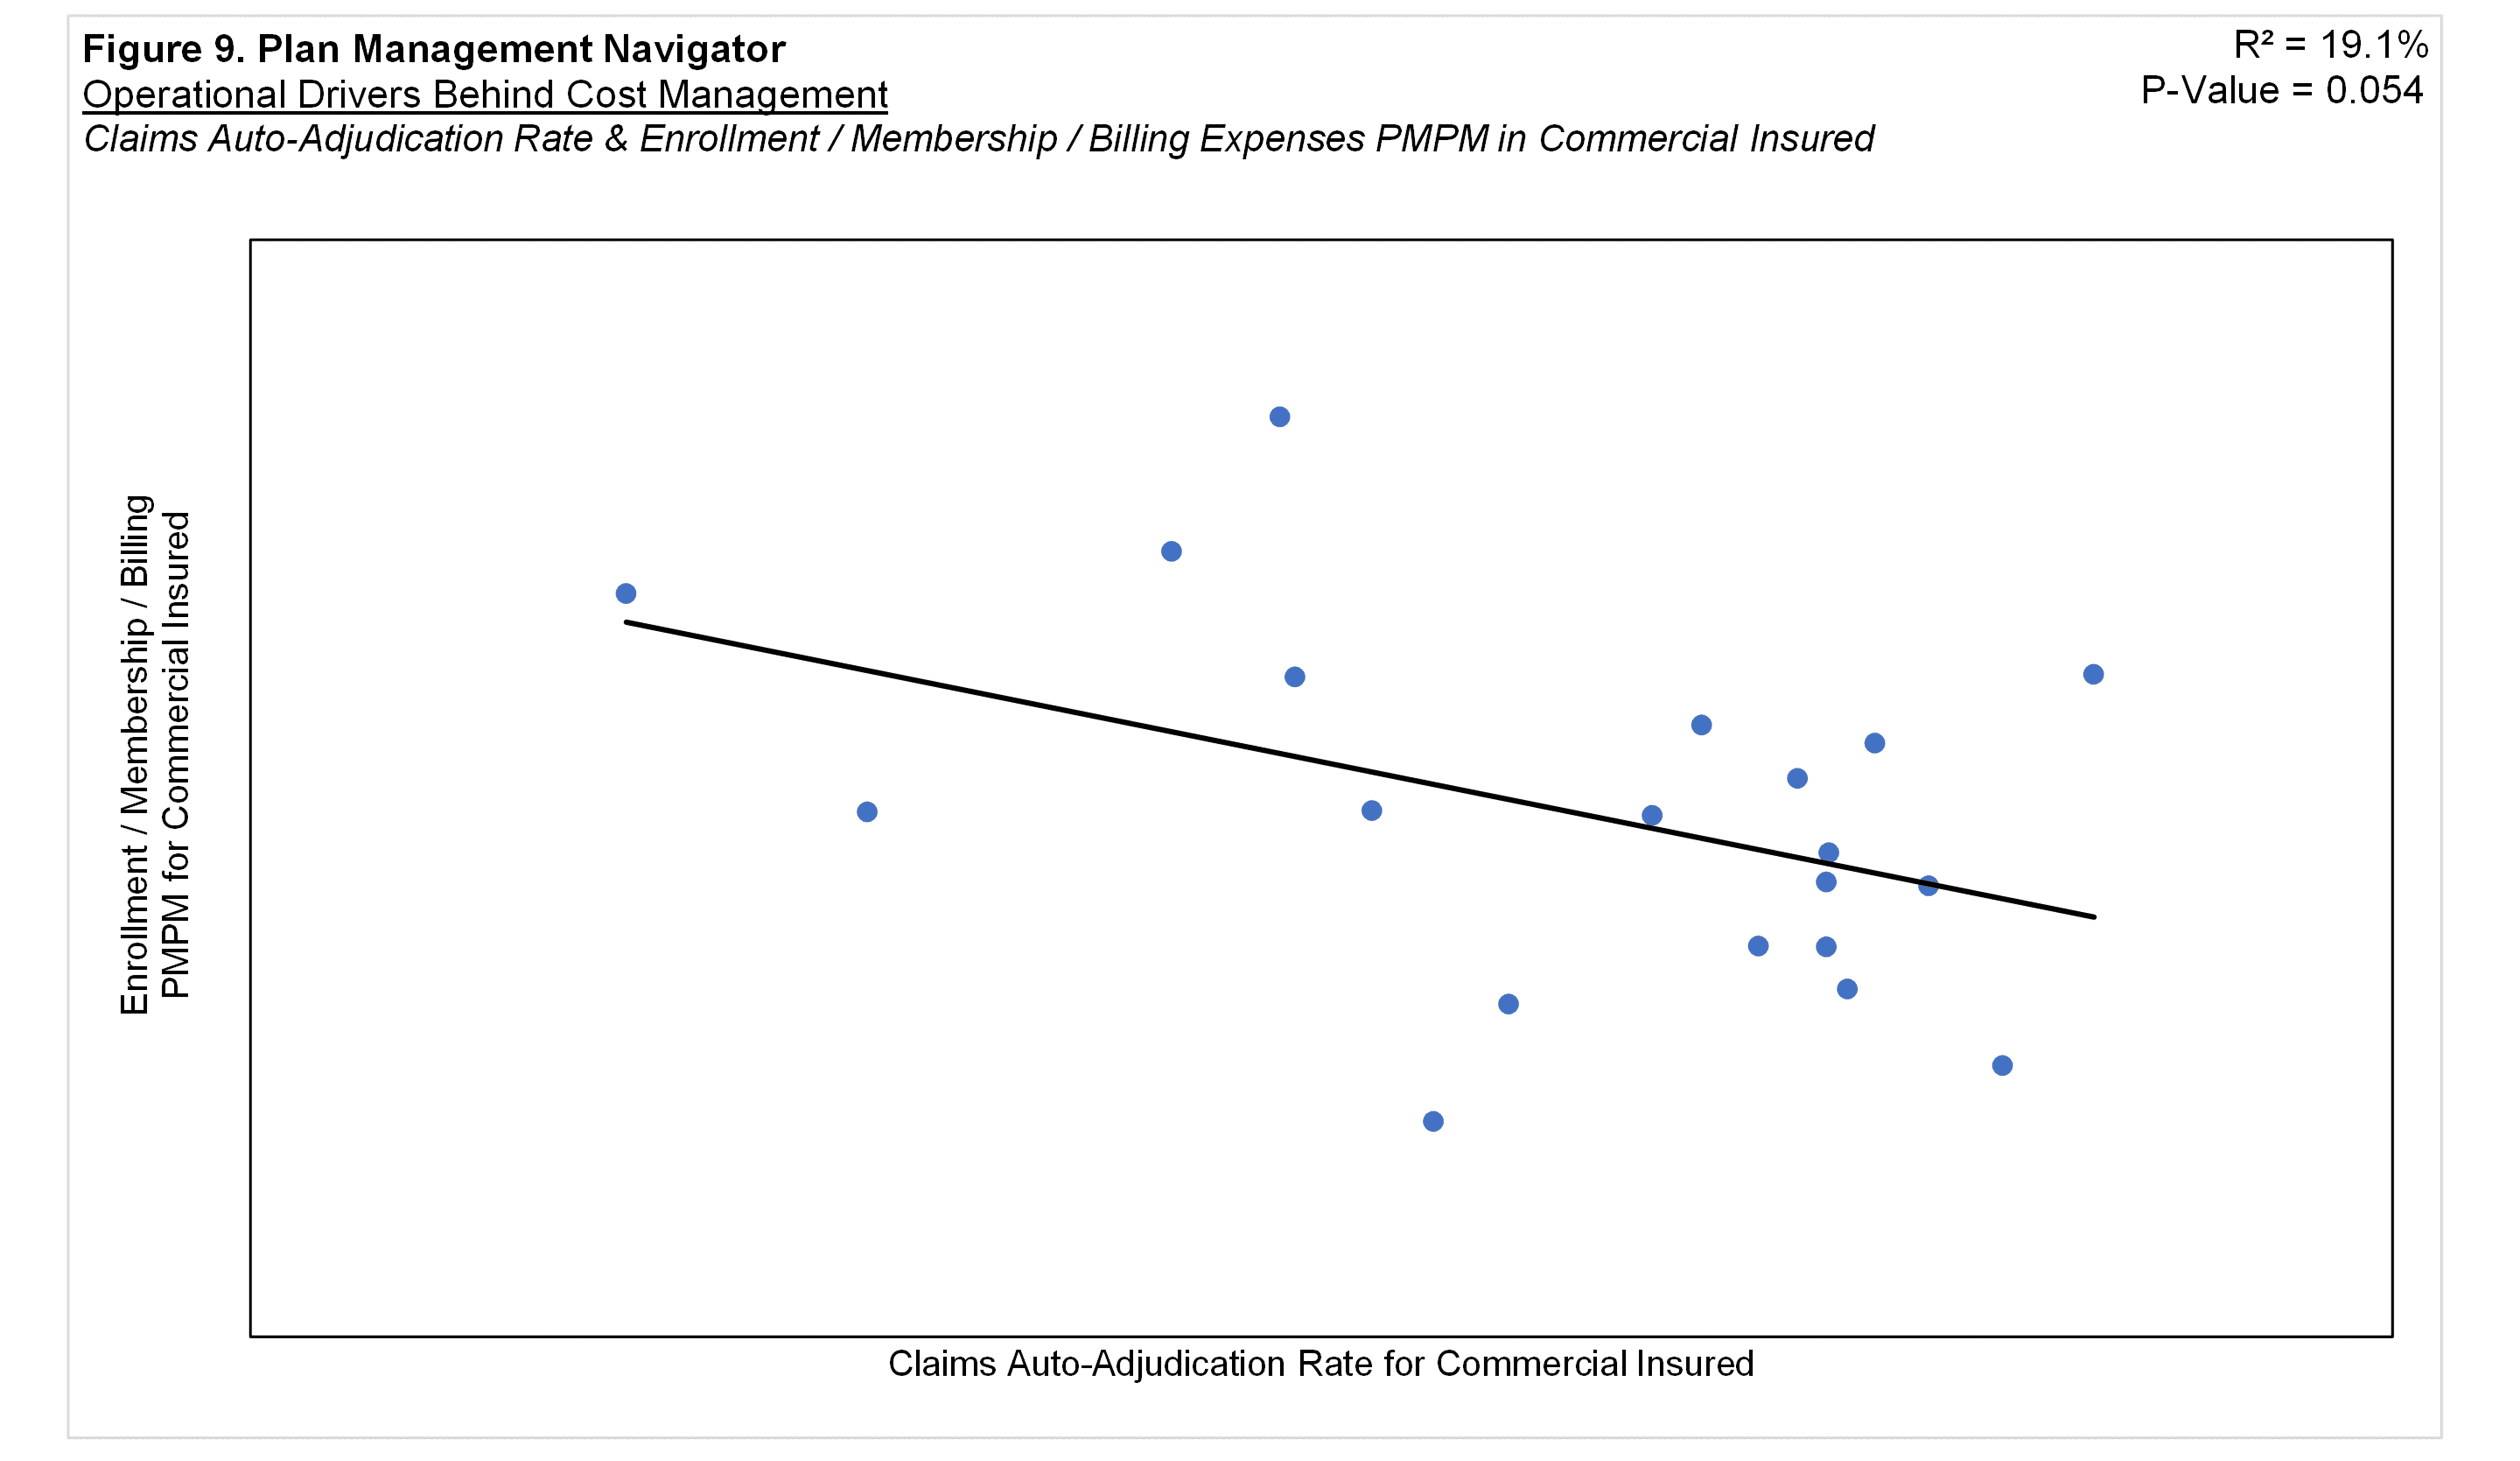
Using auto-adjudication as an indicator of other functions' automation, we found that Enrollment / Membership / Billing displayed a significant relationship with per member costs. Figure 9 depicts this relationship within the Commercial Insured product. This figure suggests that, the greater the Commercial Insured auto-adjudication rate, the lower this product's Commercial Enrollment / Membership / Billing PMPM costs. The R² was 19.1% and P-Value was 0.054. Comprehensive Total Enrollment was near significant with a P-Value of 0.113 and R² of 11.6%.
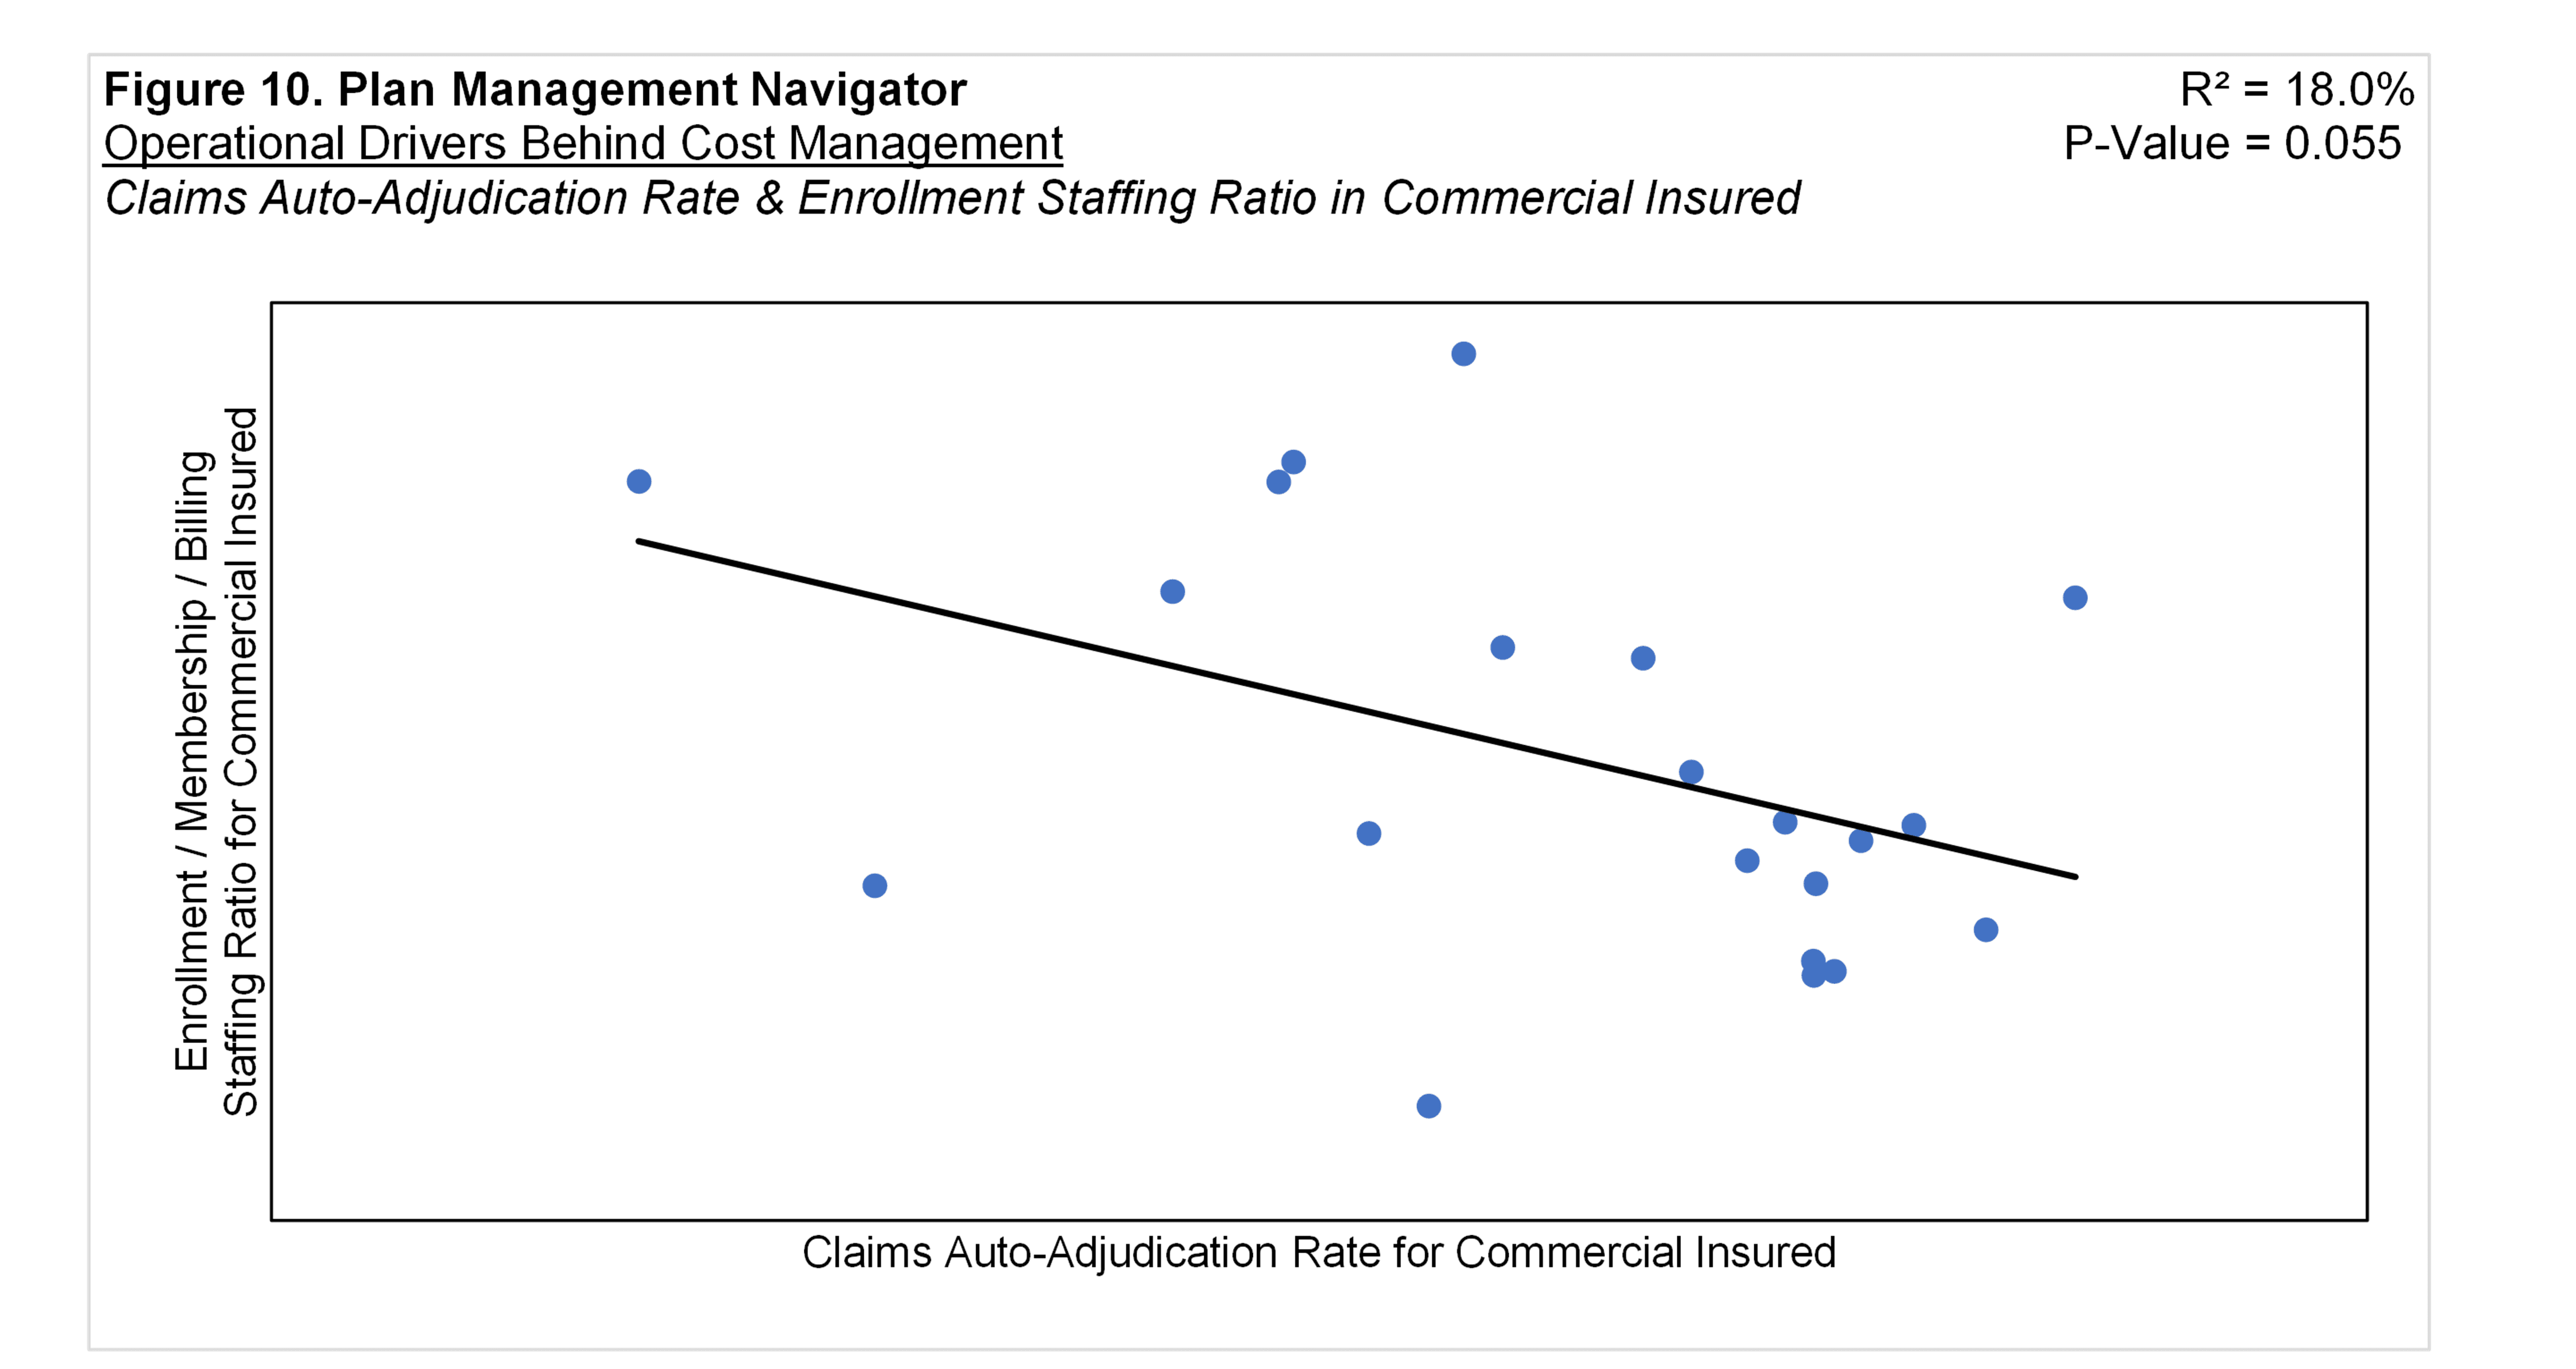
Similarly, the regression analysis of Commercial Insured Auto-Adjudication Rate and Enrollment / Membership / Billing Staffing Ratios showed a relationship with a P Value of 0.55 and R² of 18.0%. Shown in Figure 10, the relationship suggests that the greater the Auto-Adjudication Rate, the lower the staffing ratio in Enrollment for the Commercial Insured Product.
We also tested the relationship between Auto-Adjudication Rate with Customer Services per member expenses. However, we found no significant relationships between autoadjudication rate and this function's PMPM costs or Staffing Ratios.
Touching on the credence of auto-adjudication as a general measure of automation, we measured the relationship between auto-adjudication and Information Systems expenses. While auto-adjudication is related to the Claims functional area, it is only 25% of the functional Application Allocations of the Account and Membership Administration cluster.
Figure 11 displays the relationship between the Auto-Adjudication Rate and Information Systems expenses in the Commercial Insured product. The analysis resulted in a P-Value of 0.008 and R² of 33.3%. The positive relationship implies that the higher the auto-adjudication rate, the higher the expenses in PMPM Information Systems costs within the Commercial Insured product. This result also aligns with Figure 7 showing that the higher the rate of auto-adjudicated claims the lower the costs in the Other Claims subfunction.
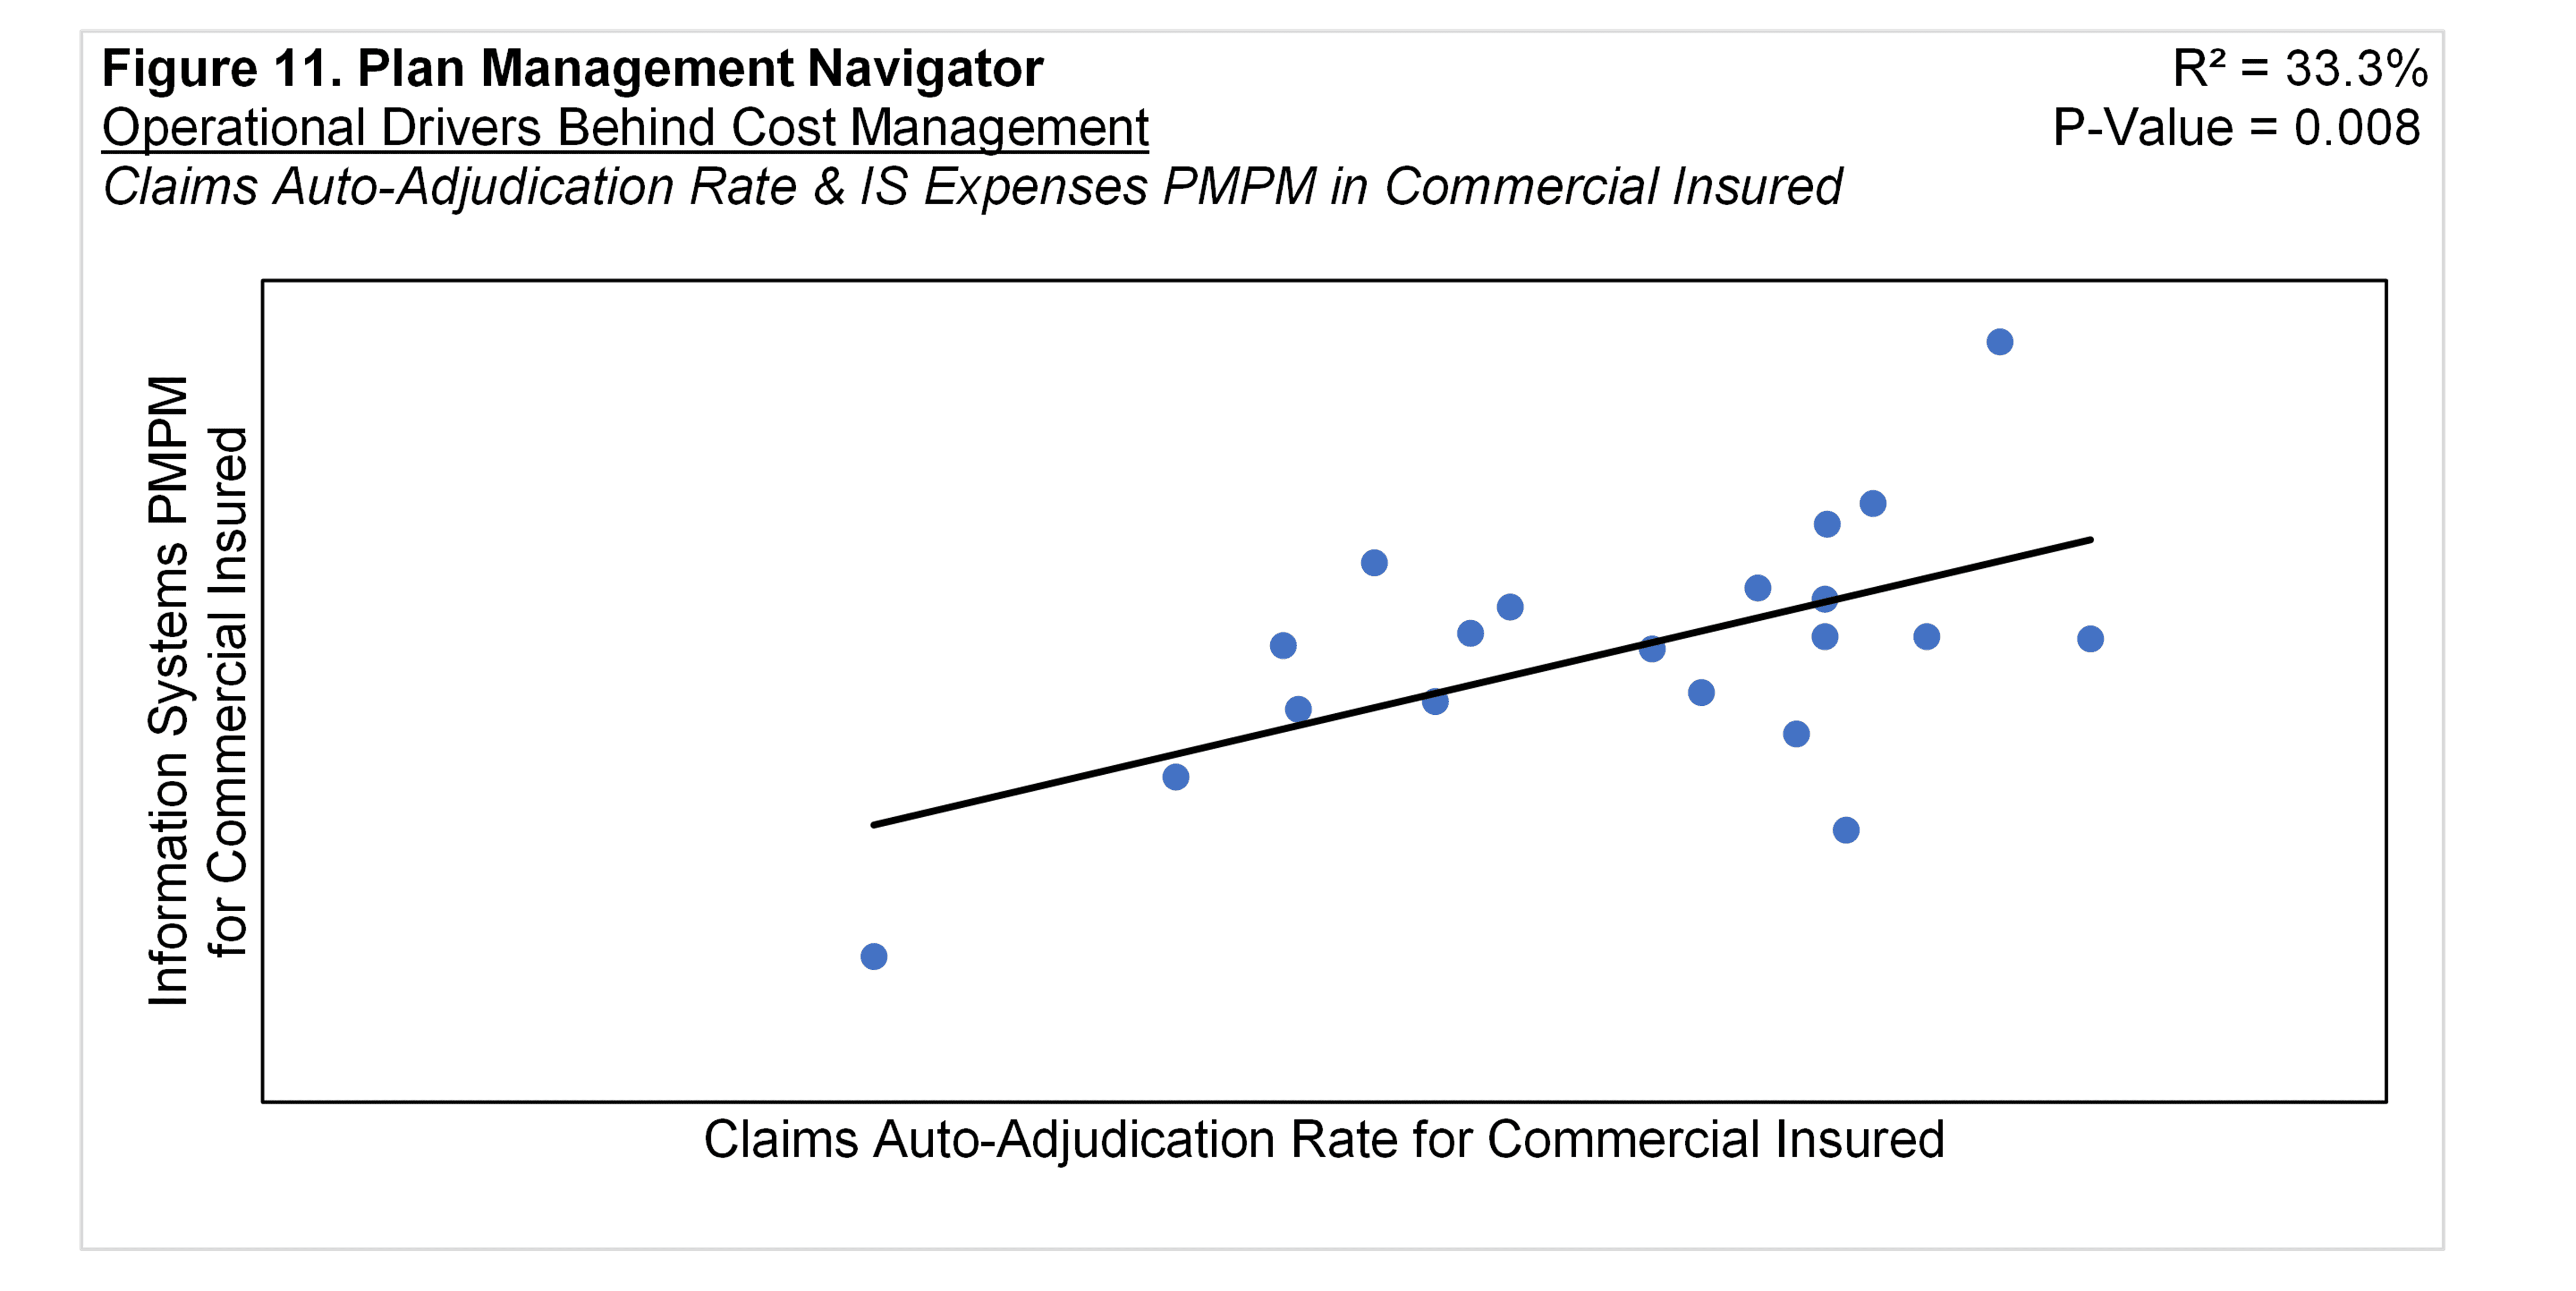
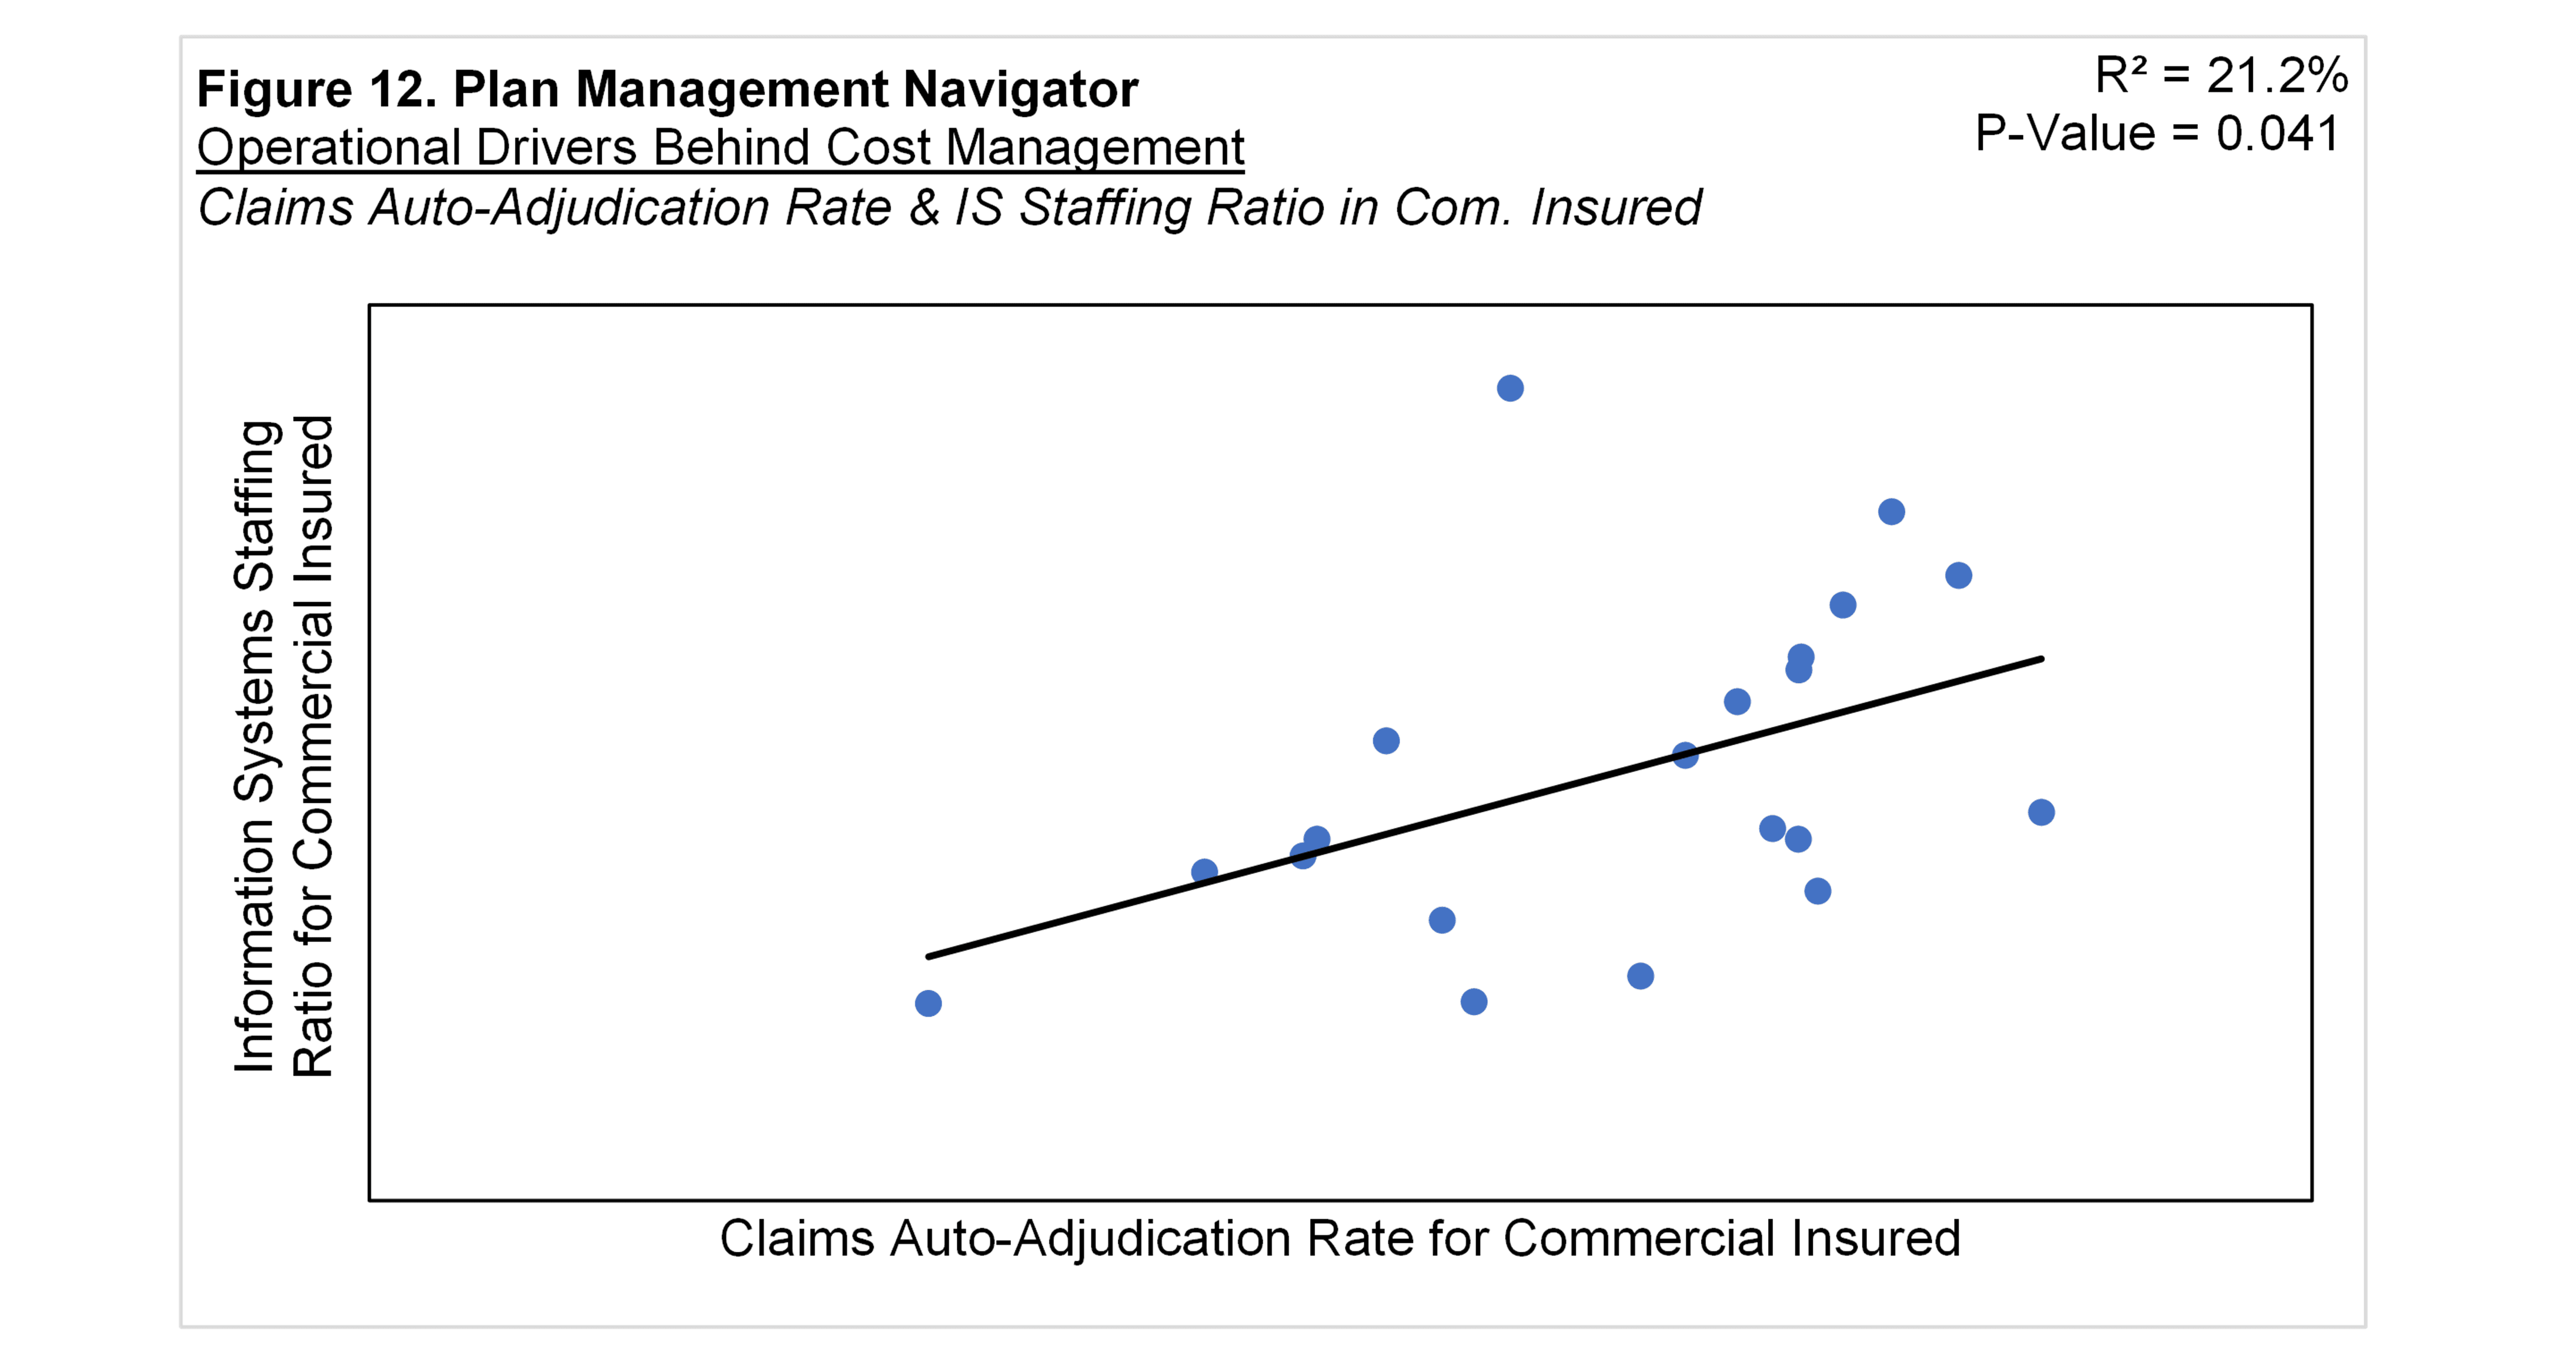
Figure 12 shows the relationship between Commercial Insured Claims Auto-Adjudication Rate and Commercial Insured Information Systems Staffing Ratios. The positive regression analysis suggests that the higher the auto-adjudication rate, the higher the IS Staffing Ratio. The P-Value was 0.041 and R² was 21.2%.
Conclusion
In this Plan Management Navigator, we measured the relationships between administrative costs and operational metrics. Our view is that efficiencies achieved in operational metrics can drive improvements in financial performance. In a low margin industry, even modest enhancements can lead to notable growth in enterprise earnings.
The modeled relationships correspond with common-sense intuition. To review, inquiry volume is correlated with PMPM costs within both Provider Services and Member Services functional areas. The positive relationships imply that the more inquiries, the higher the PMPM costs.
Meanwhile, automation, measured by claims auto-adjudication rate, has direct inverse relationships with claims function staffing and PMPM costs. The relationship also extends to costs and staffing within Information Systems. In this case, the variables are positively related, which reflects that investments in automation reside in IT.
Lastly, we explored the potential for enterprise-wide automation using claims autoadjudication as its indicator. We speculate that higher automation in claims may reflect broader automation across other functional areas. Using this approach, we found statistically significant inverse relationships between auto-adjudication rates and both PMPM costs and staffing within the Enrollment / Membership / Billing functional area.