
The Analysis
Health plans that grow faster see their per-member administrative costs decline, at least in the short term. Among 23 plans in the Sherlock Benchmarks universe, a one percentage point increase in membership growth was associated with a 0.89 percentage point decline in per-member cost growth (P=0.003, R²=35.4%). Five of sixteen functional areas showed statistically significant relationships, all favoring plans with faster membership growth.
This matters now because membership trends have diverged sharply across segments. Medicare Advantage enrollment growth slowed from 7% to 4% between 2024 and 2025, while Medicaid MCOs lost 12% to 15% of members as redeterminations resumed.1 When membership shifts quickly, costs often cannot adjust at the same pace. Understanding the short-term cost dynamics helps plans anticipate the financial impact of these swings.
Faster Growth, Lower Per-Member Costs
Figure 1 shows the overall relationship between membership growth and administrative cost growth for Subtotal expenses (all administrative costs except Miscellaneous Business Taxes). The slope of negative 0.89 means that for every percentage point increase in membership growth, cost growth per member declines by 0.89 percentage points. The relationship is statistically significant (P=0.003) and explains about a third of the variation (R²=35.4%).
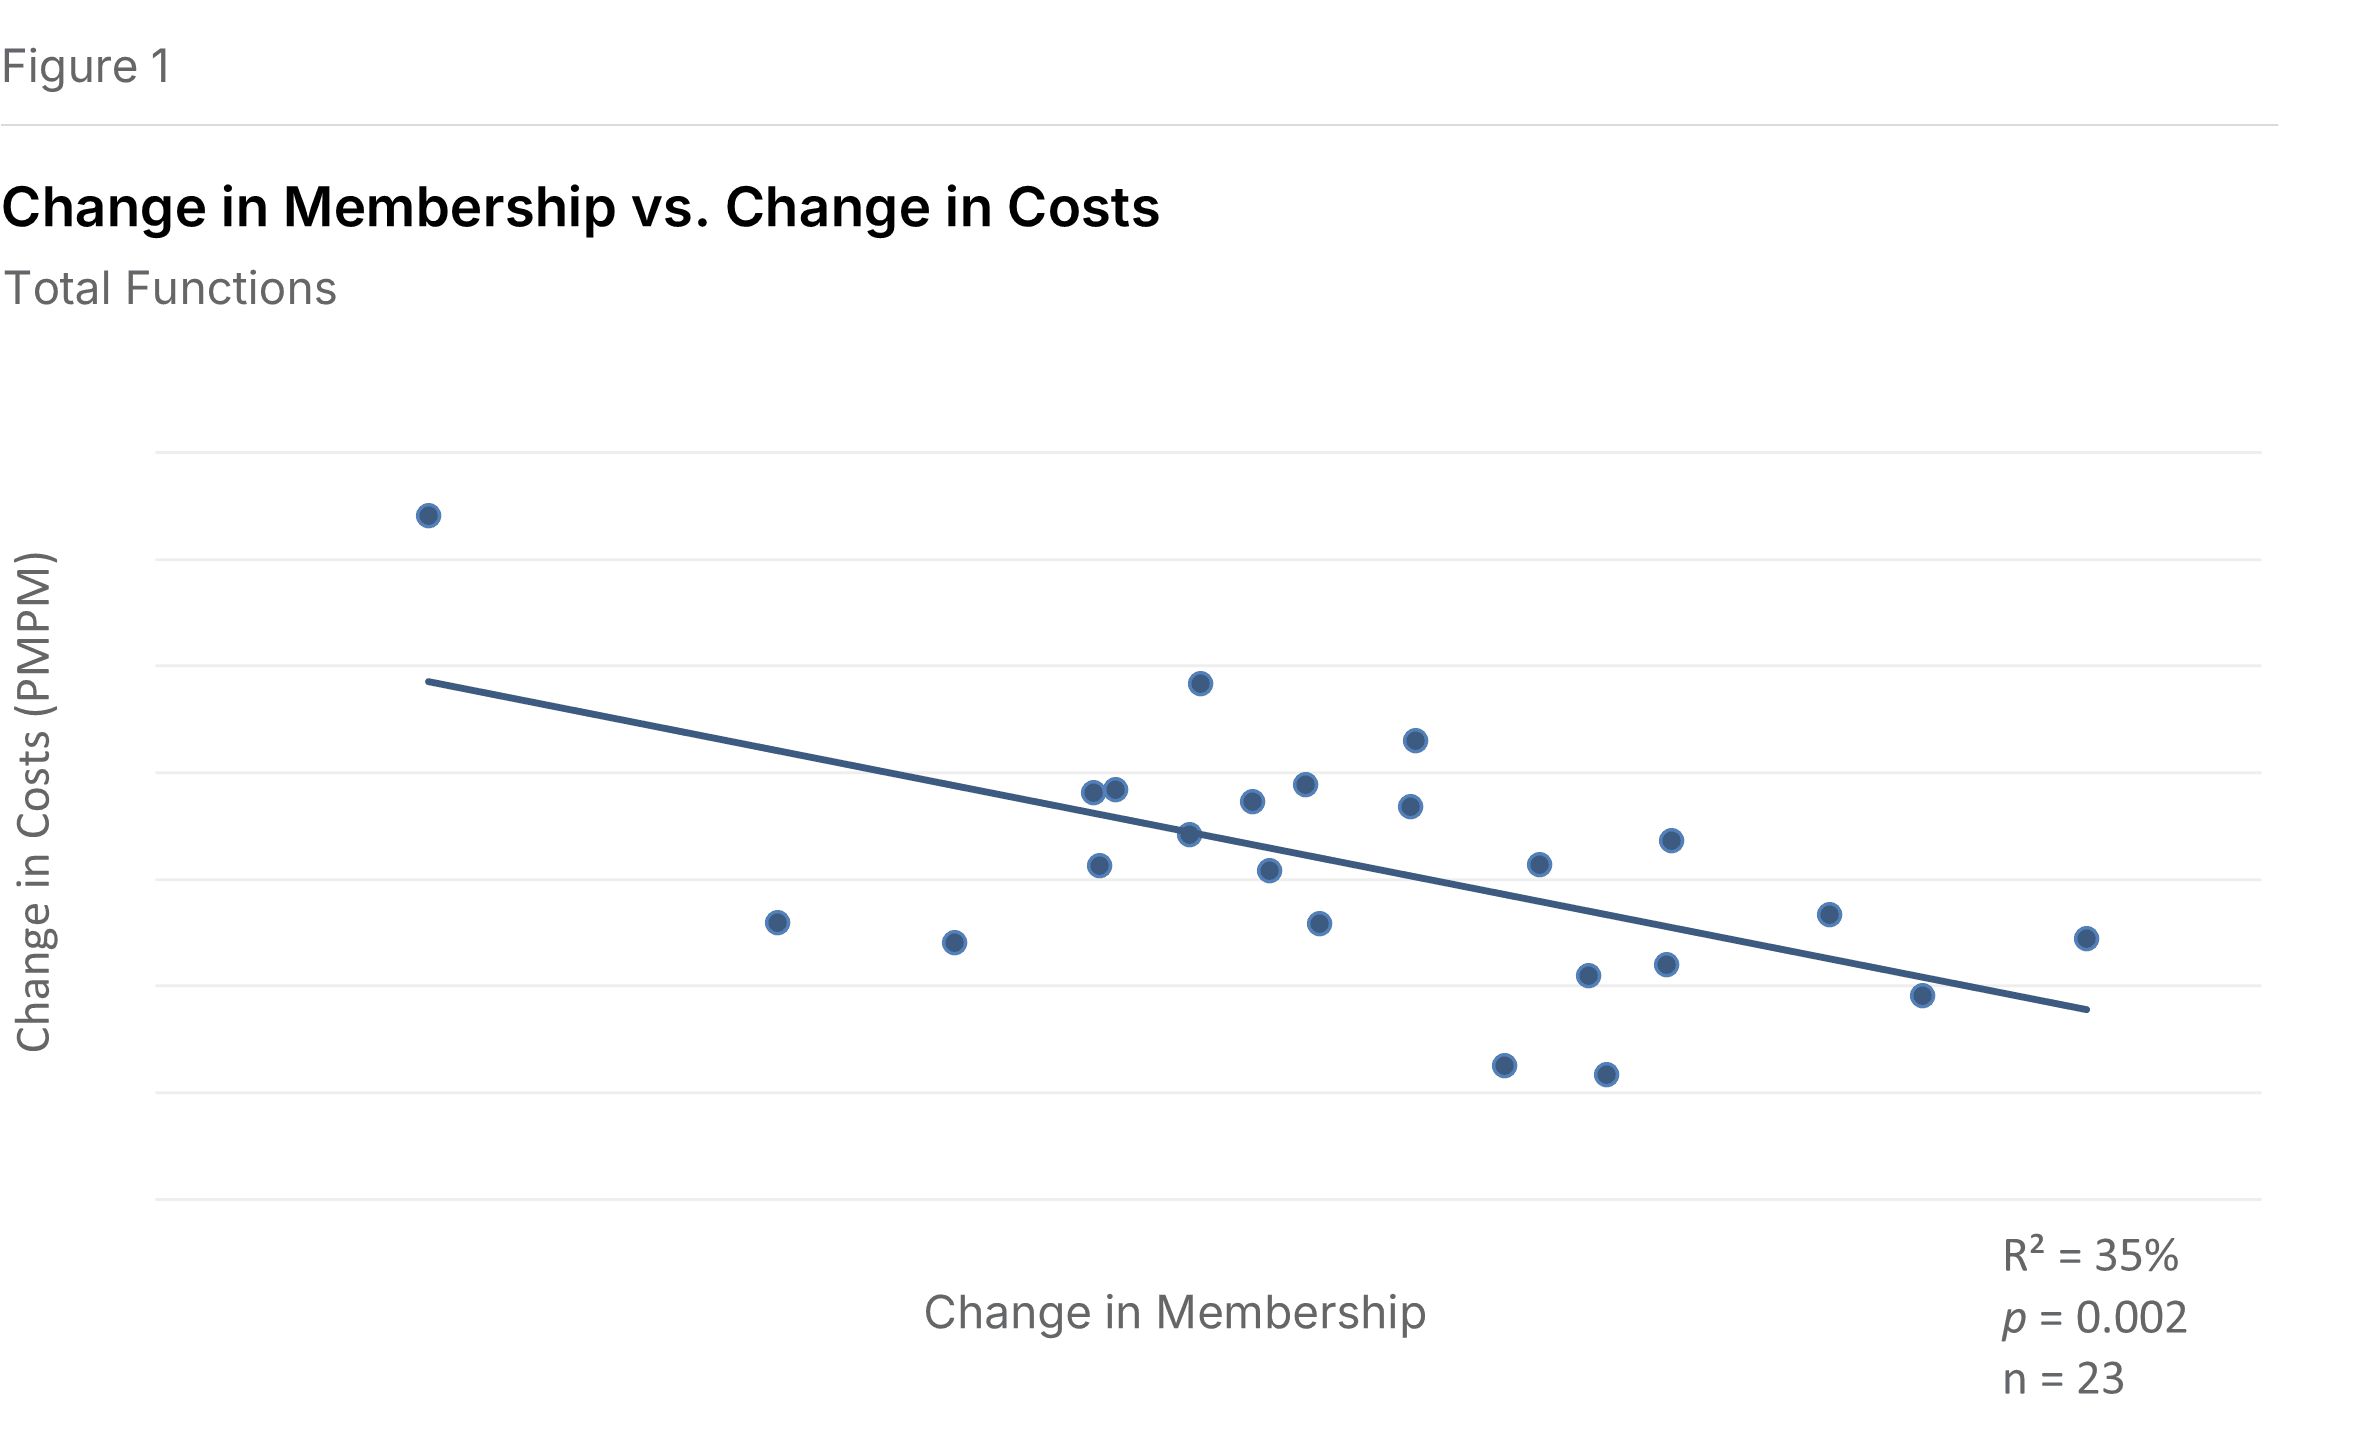
To illustrate: a plan with $50.00 PMPM costs and flat membership that then experiences 1% membership growth would expect costs to decline to roughly $49.55 PMPM, calculated as $50.00 × (1 + (0.01 − 0.00) × −0.89). More generally: PMPMY2 = PMPMY1 × (1 + (RateY2 − RateY1) × Slope).
Not All Functions Respond Equally
Administrative expenses group into four clusters. Two clusters showed statistically significant short-term scale effects; two did not. Figure 2 summarizes these relationships.
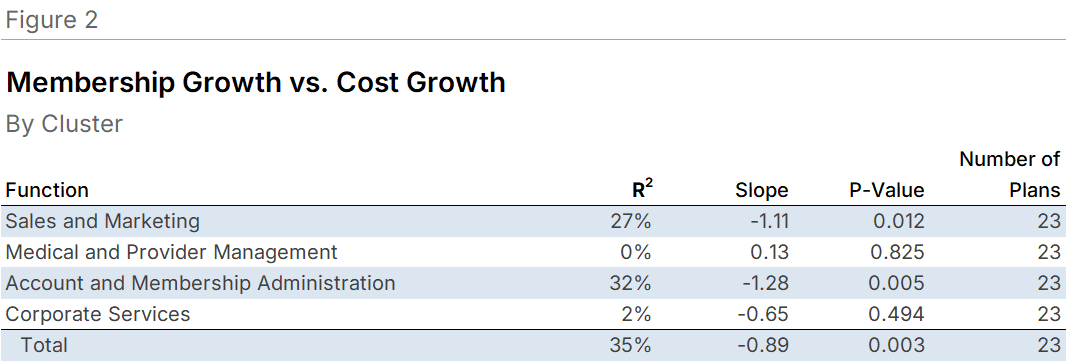
Account and Membership Administration showed the strongest effect (P=0.005, R²=32.3%). This cluster, which includes Enrollment/Membership/Billing, Customer Services, Claims, and Information Systems, exhibited a slope of negative 1.28: a 1 percentage point increase in membership growth corresponded to a 1.28 percentage point decline in expense growth. Customer Services and Information Systems drove the significance within this cluster.
Sales and Marketing followed (P=0.012, R²=26.6%), with a slope of negative 1.11. Marketing, Sales, and External Broker Commissions all contributed significant individual relationships.
Corporate Services had a negative slope of 0.65 but was not statistically significant (P=0.494, R²=2.3%). Medical and Provider Management showed essentially no relationship (P=0.825, R²=0.2%), with costs actually increasing slightly (slope of positive 0.13) as membership grew.
Five Functions with Significant Effects
Of sixteen functional areas analyzed, five showed statistically significant relationships with membership growth: Marketing, Sales, External Broker Commissions, Customer Services, and Information Systems. Figure 3 summarizes all function-level results.
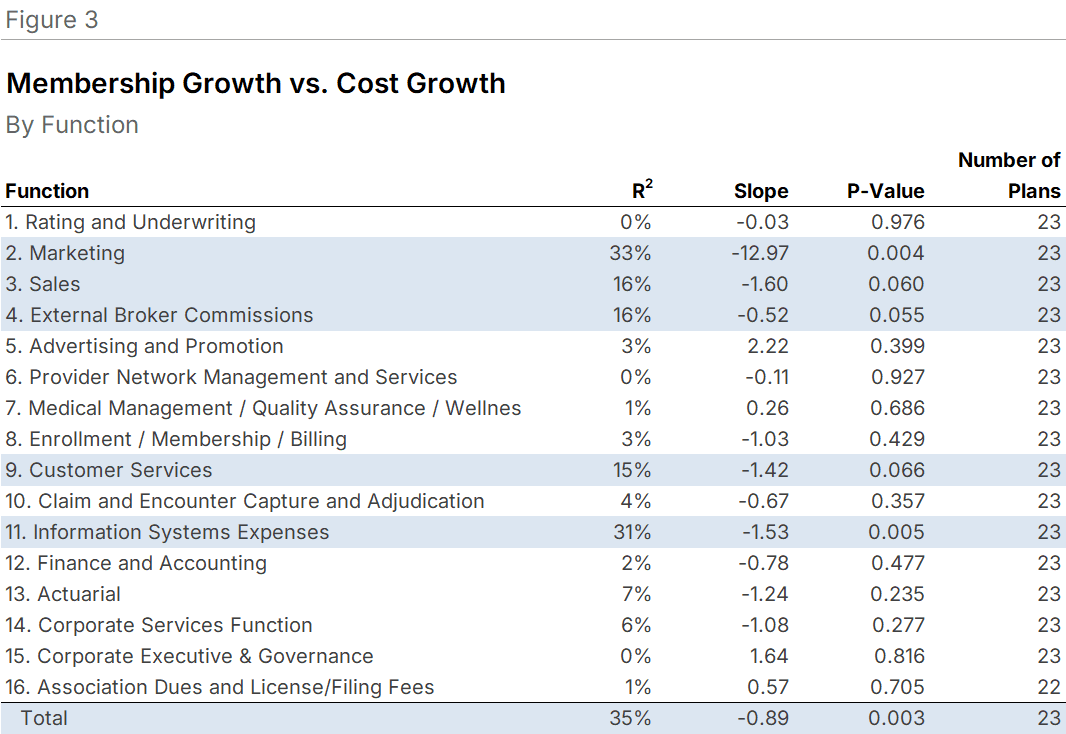
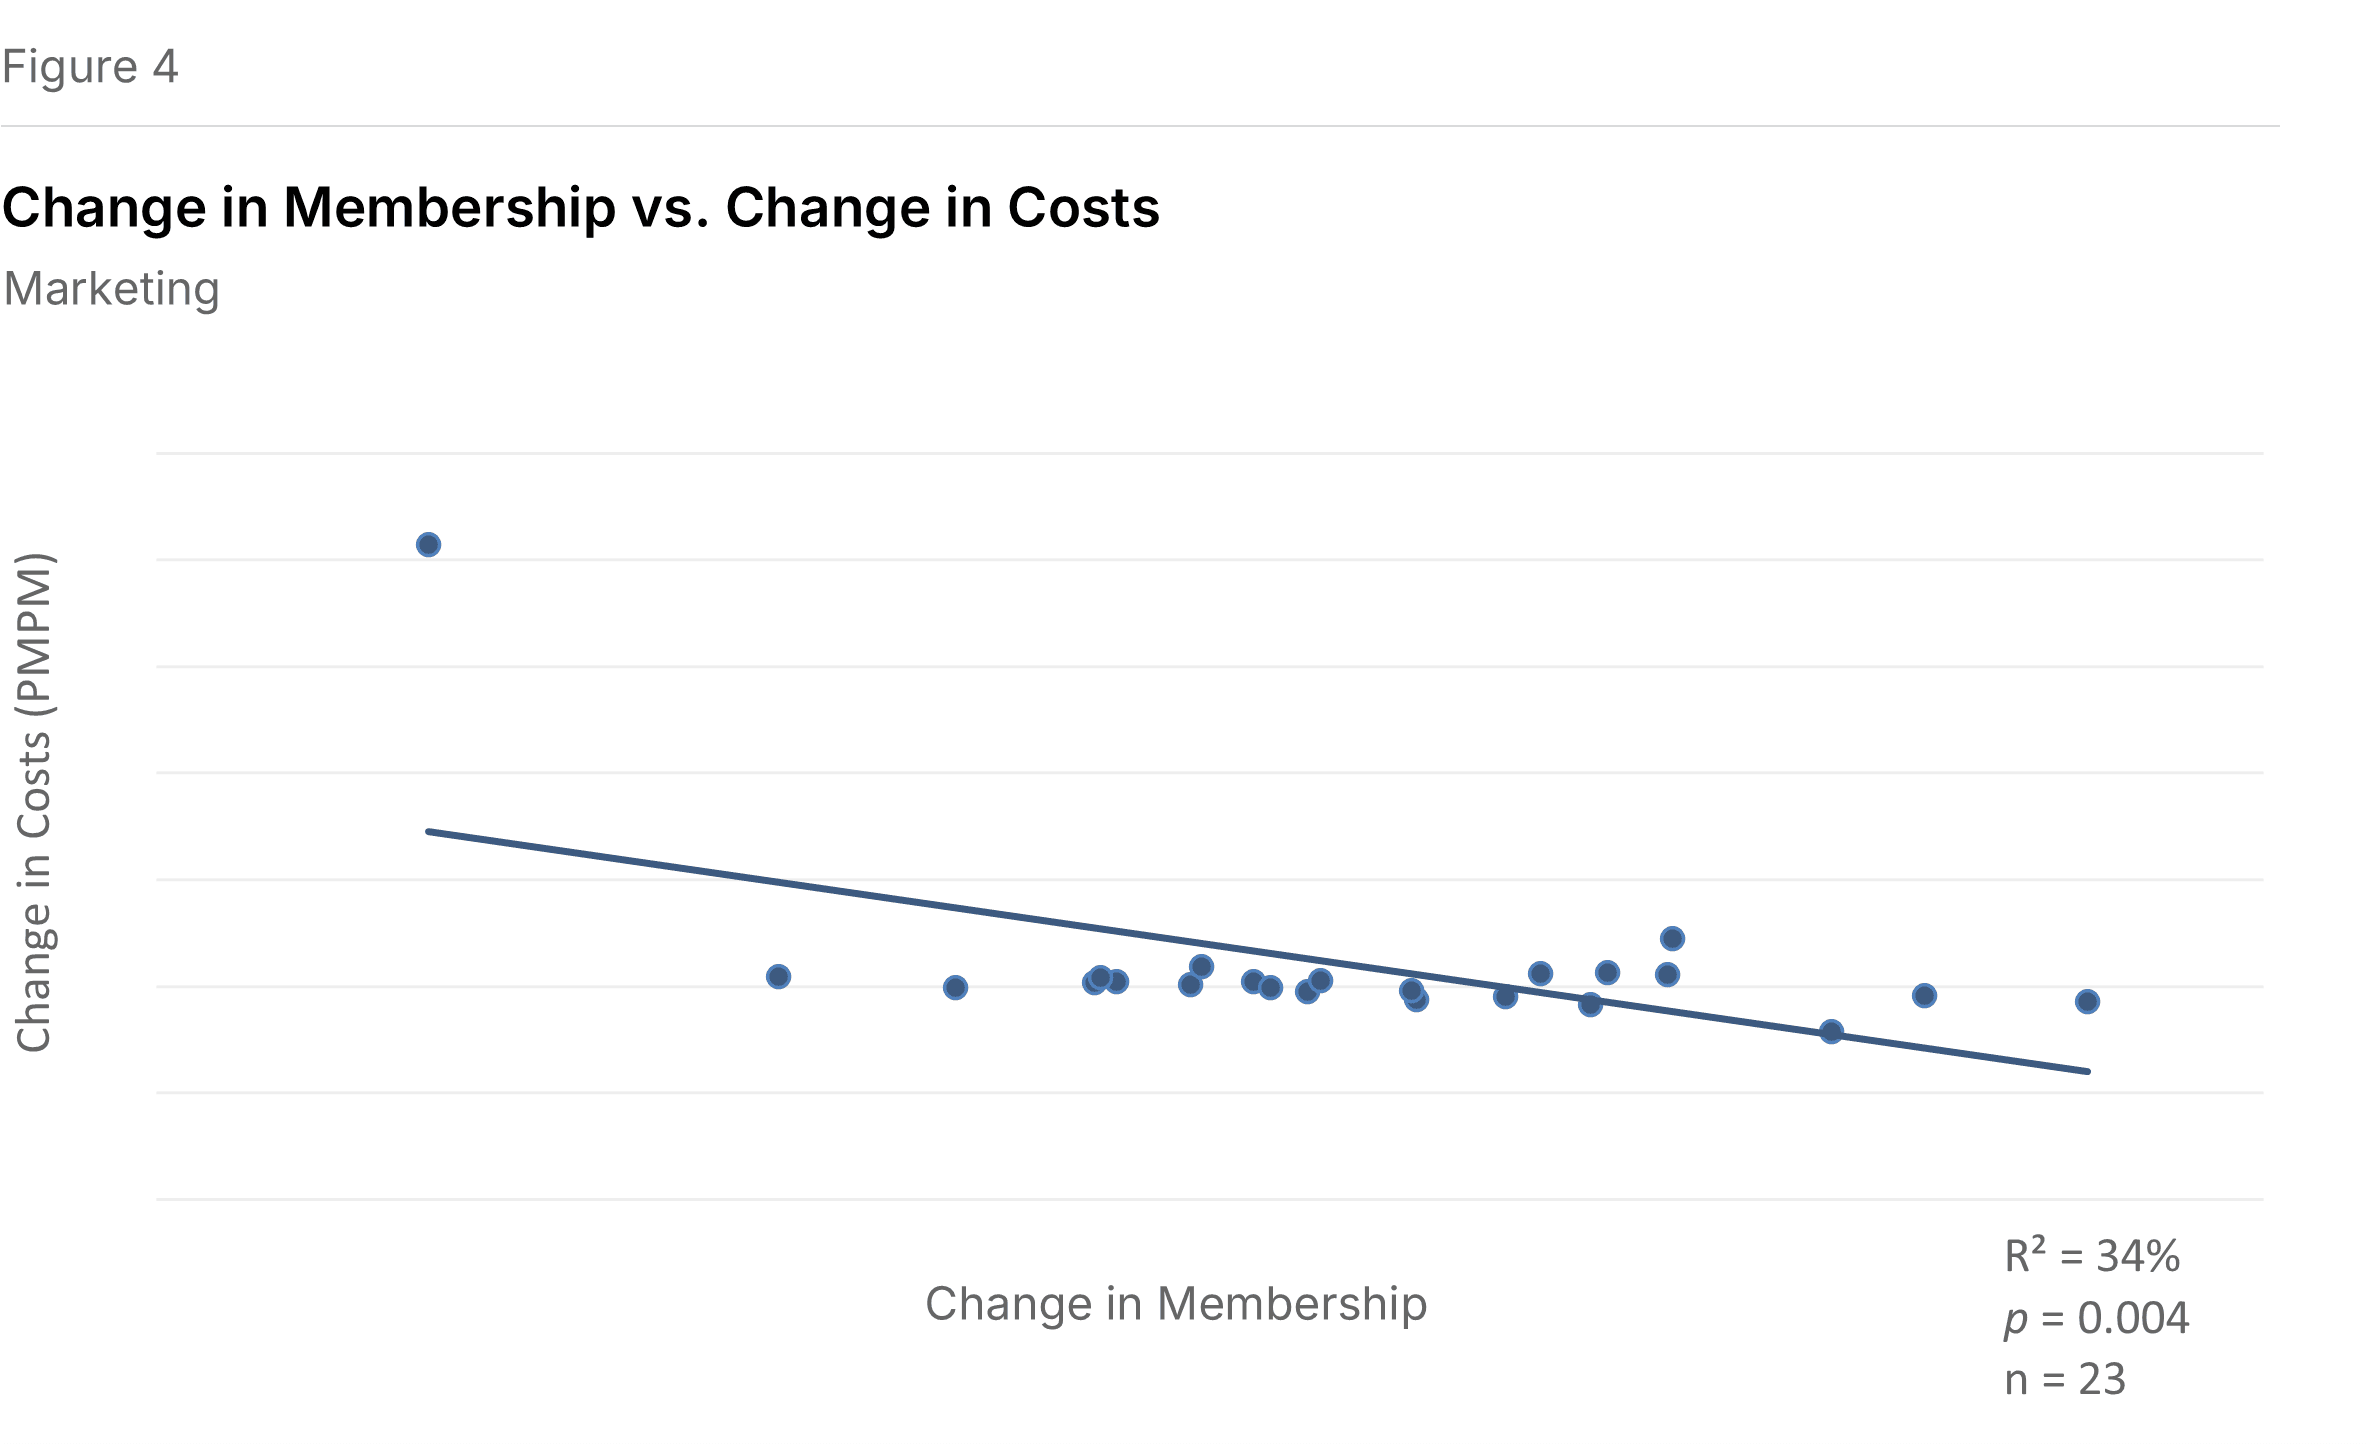
Marketing showed the strongest function-level relationship (P=0.004, R²=33.5%), with a slope of negative 12.97. This unusually steep slope reflects the narrow range of cost changes observed; the relationship remains significant when three outliers are removed. See Figure 4.
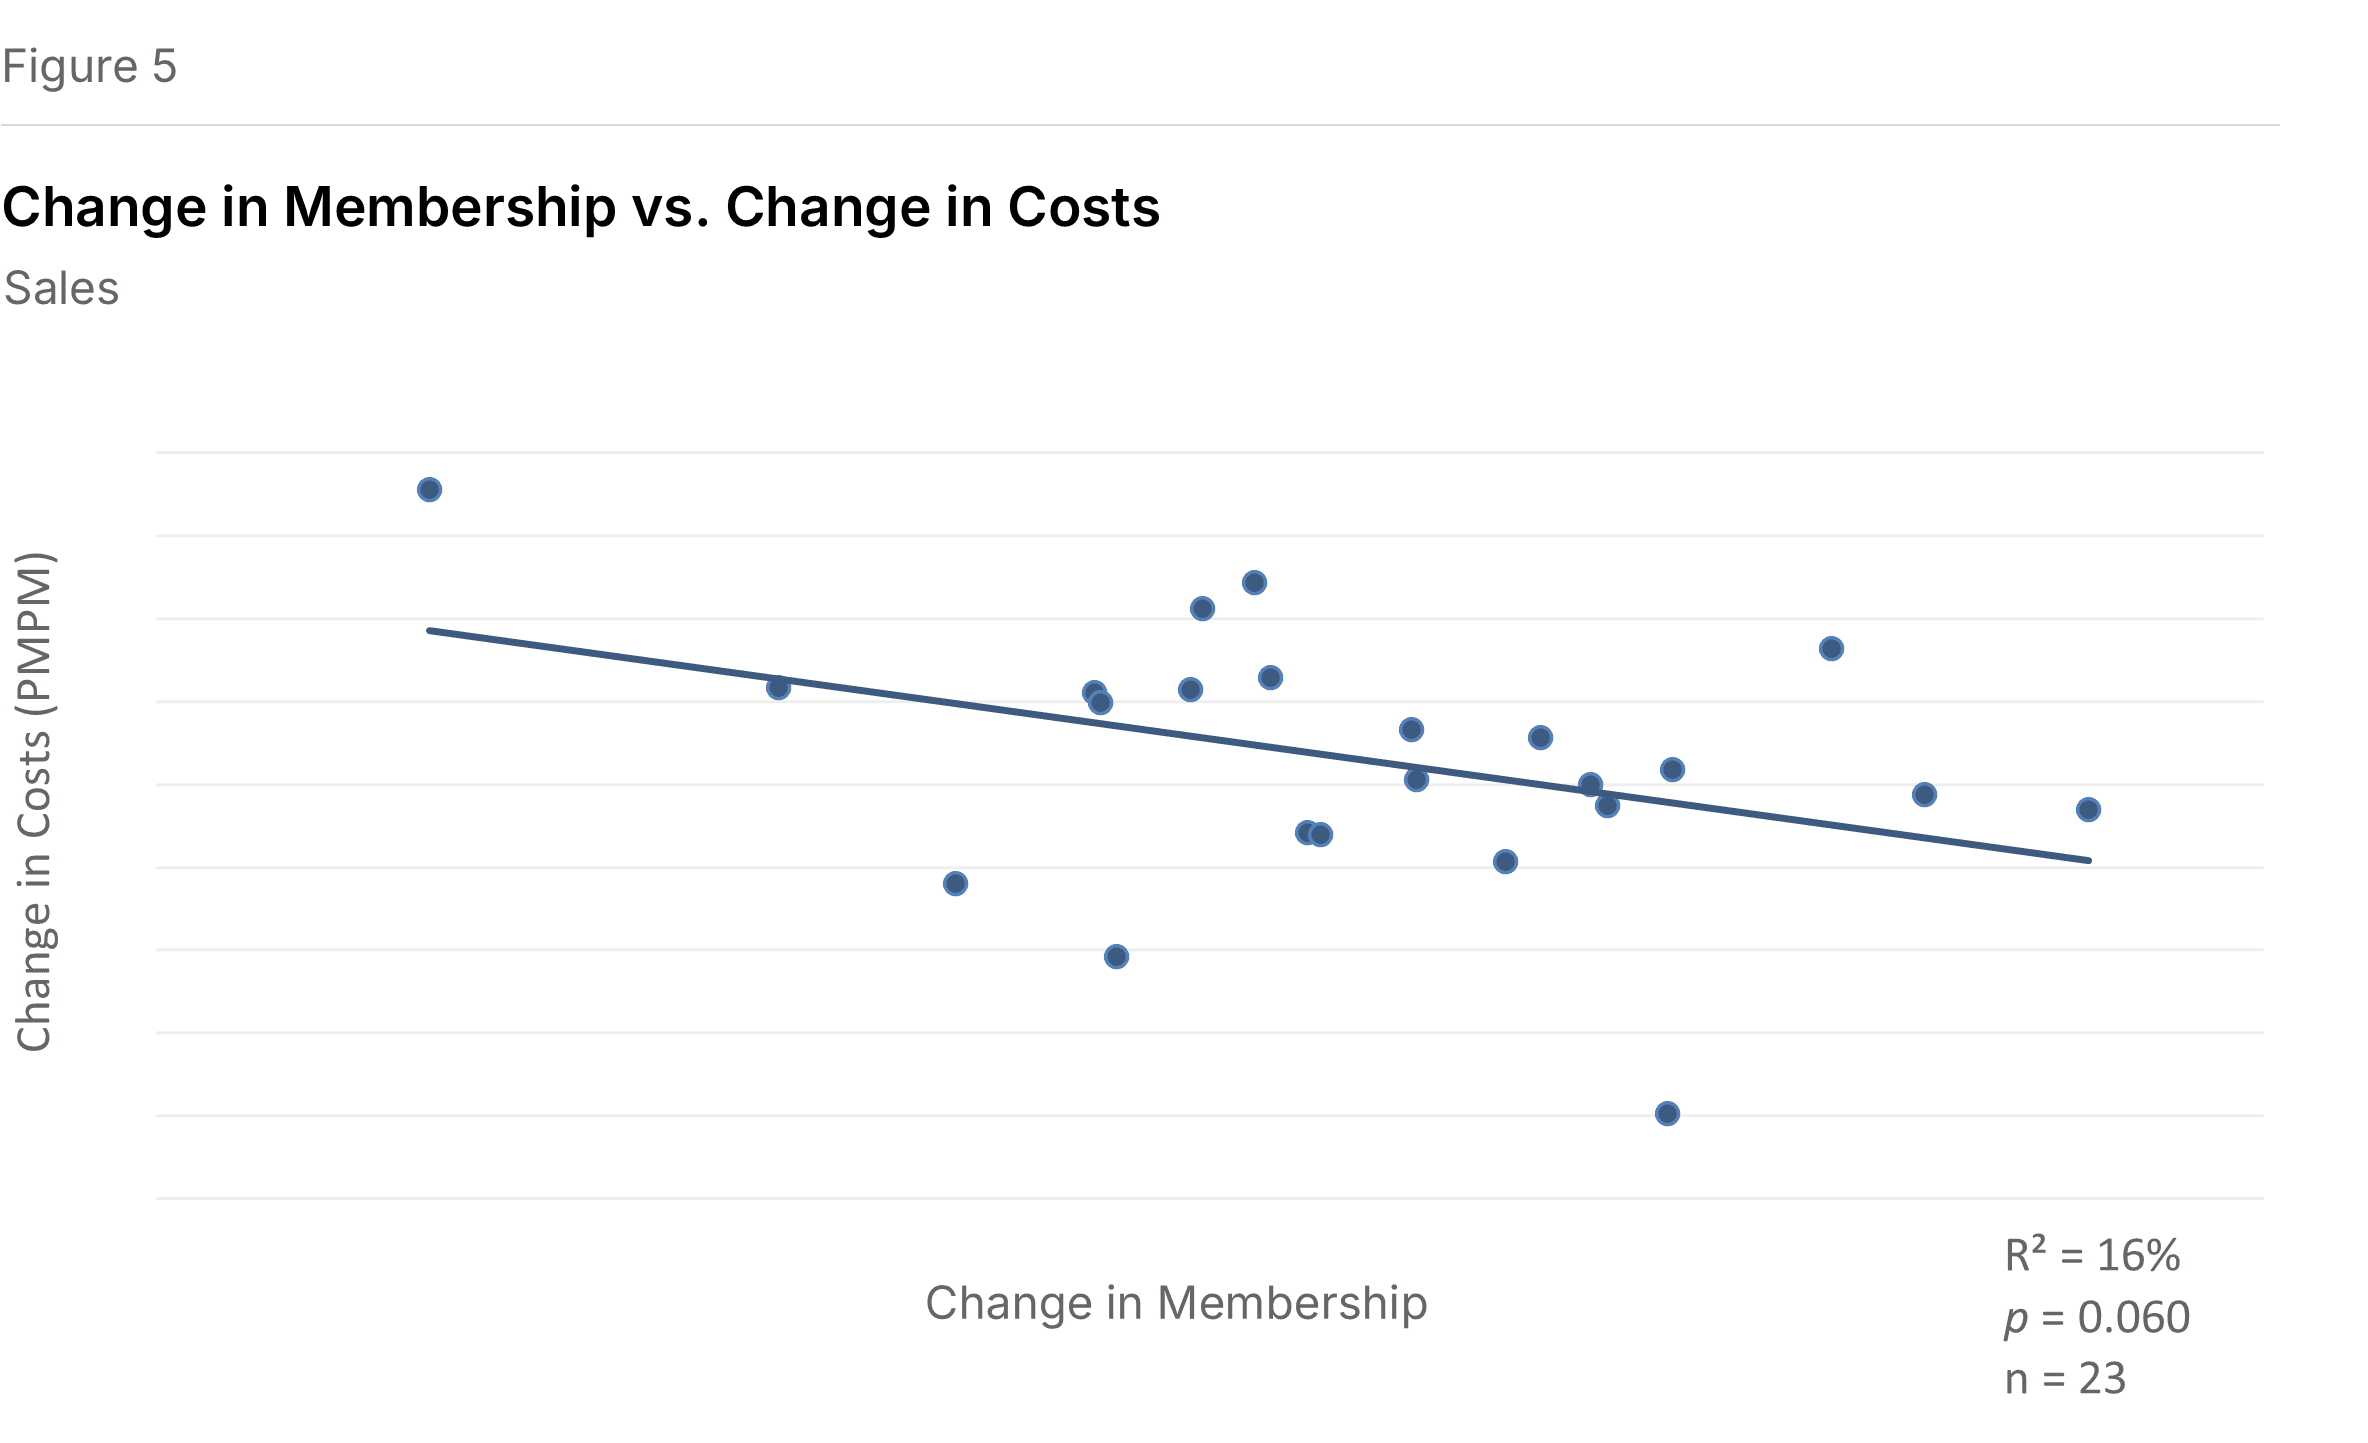
Sales exhibited a slope of negative 1.60 (P=0.060, R²=15.8%), meaning cost growth declined by 1.60 percentage points for each percentage point increase in membership growth. See Figure 5.
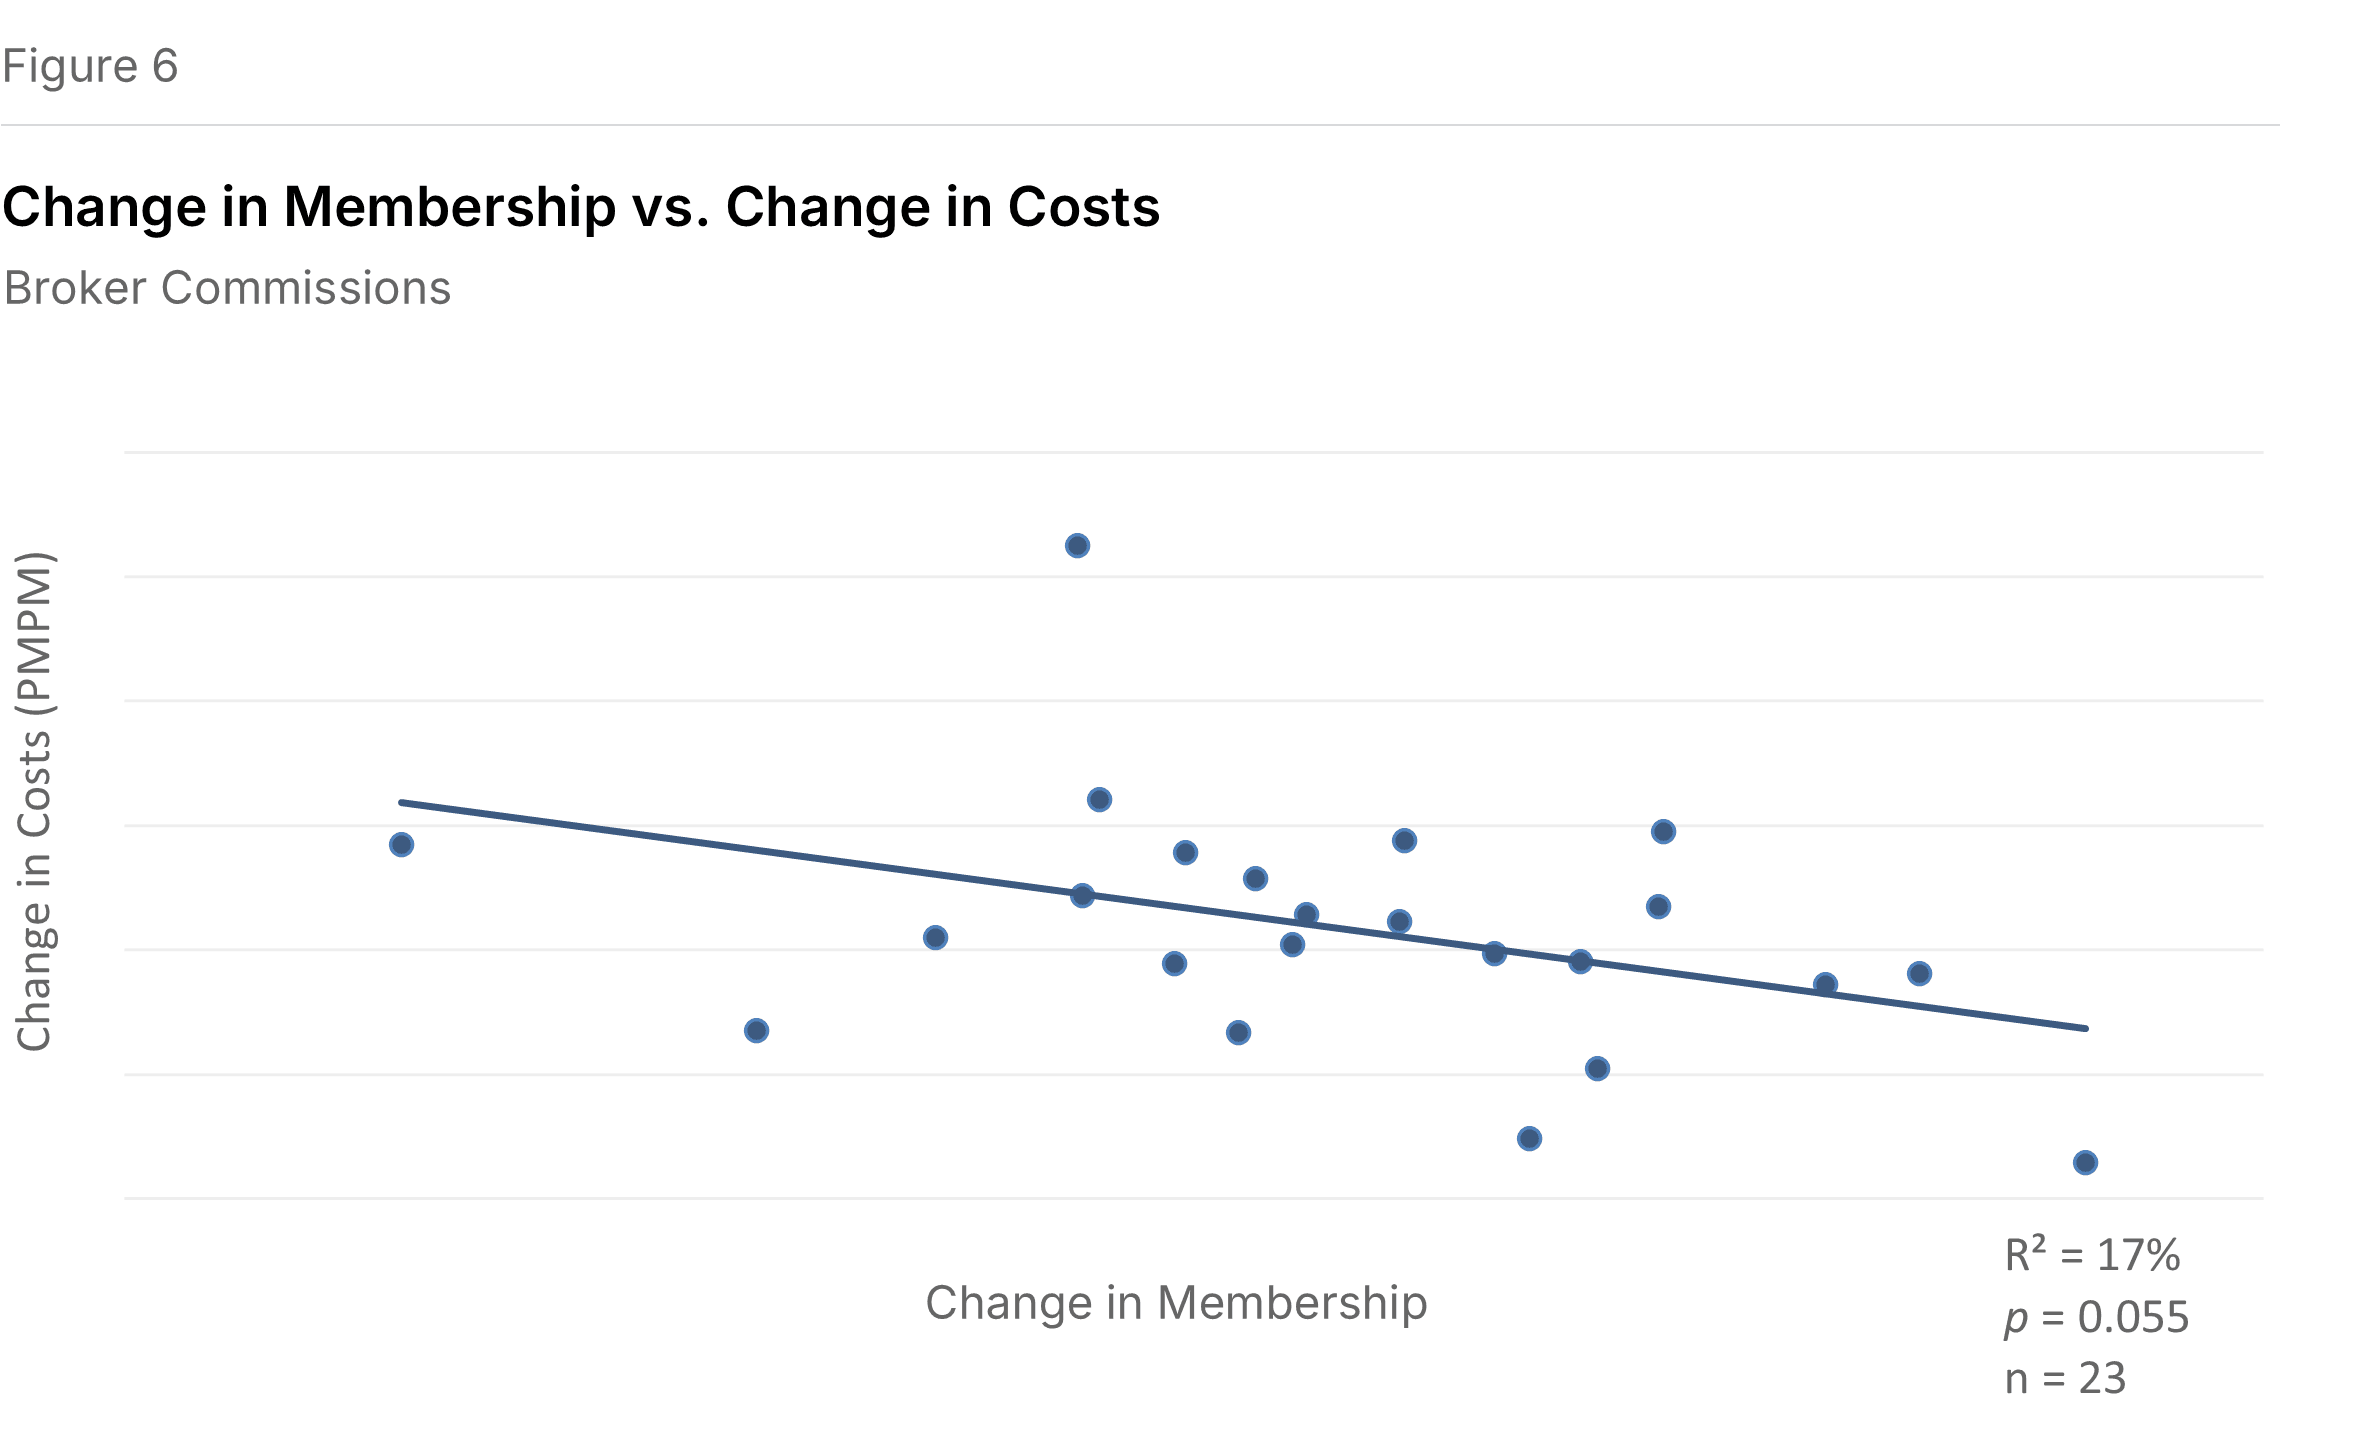
External Broker Commissions had a slope of negative 0.52 (P=0.055, R²=16.5%). See Figure 6.
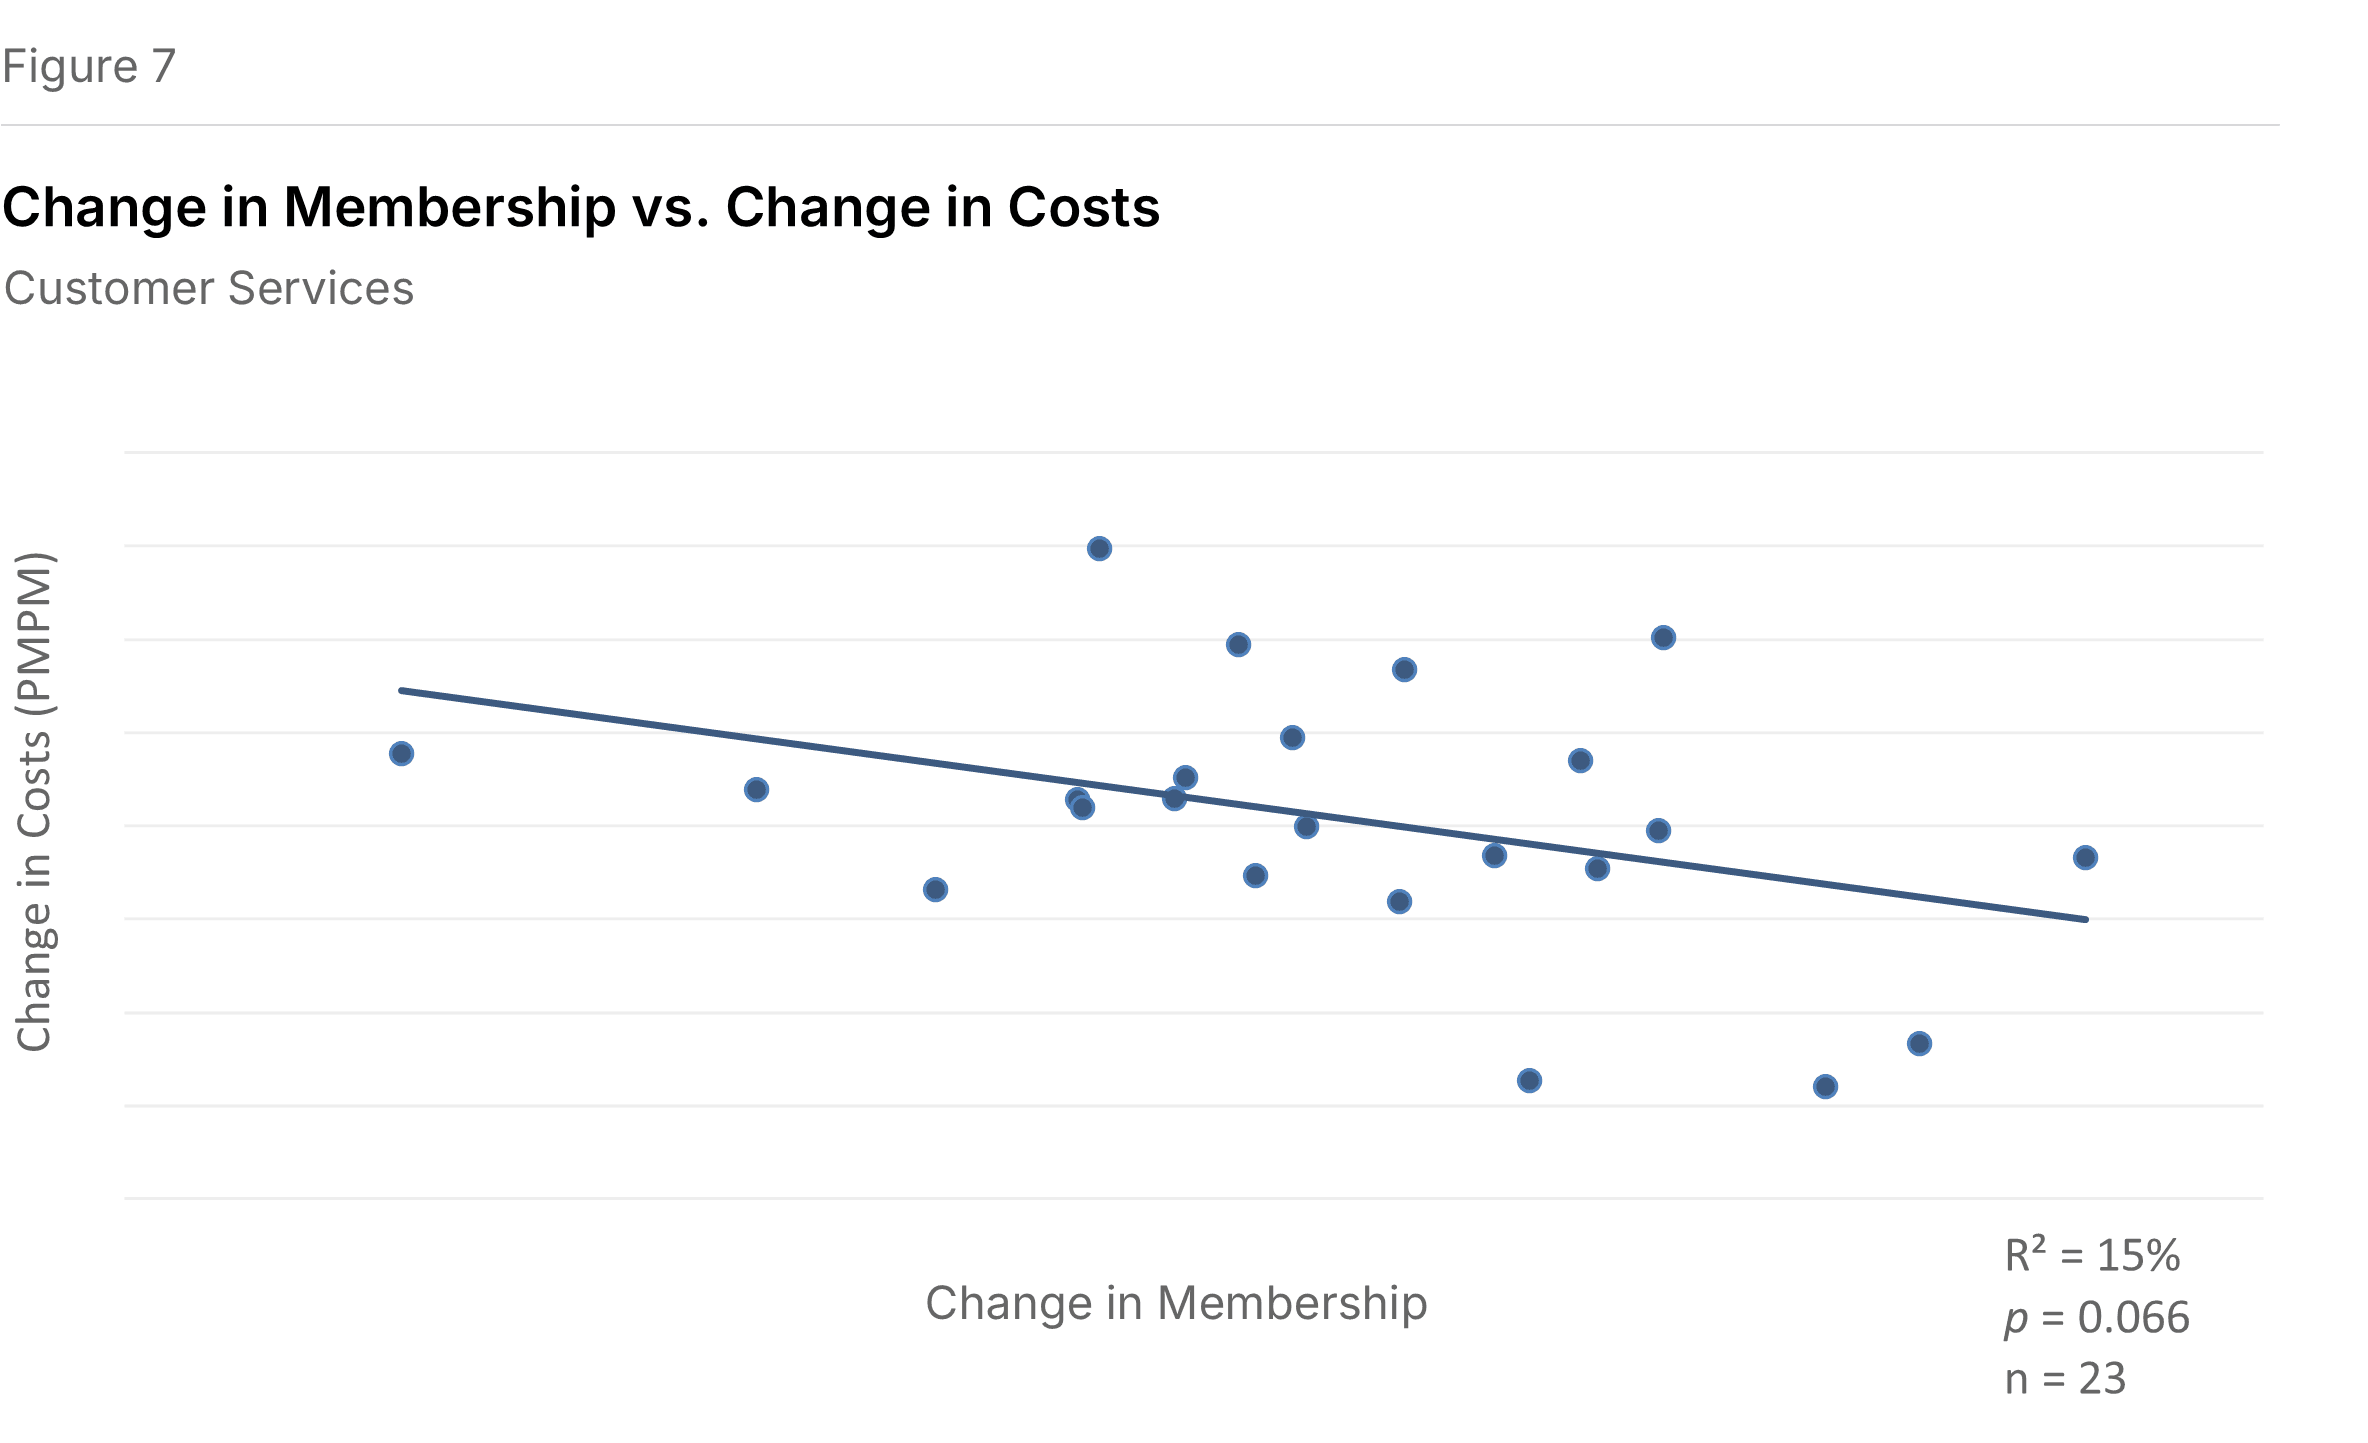
Customer Services showed a slope of negative 1.42 (P=0.066, R²=15.2%). See Figure 7.
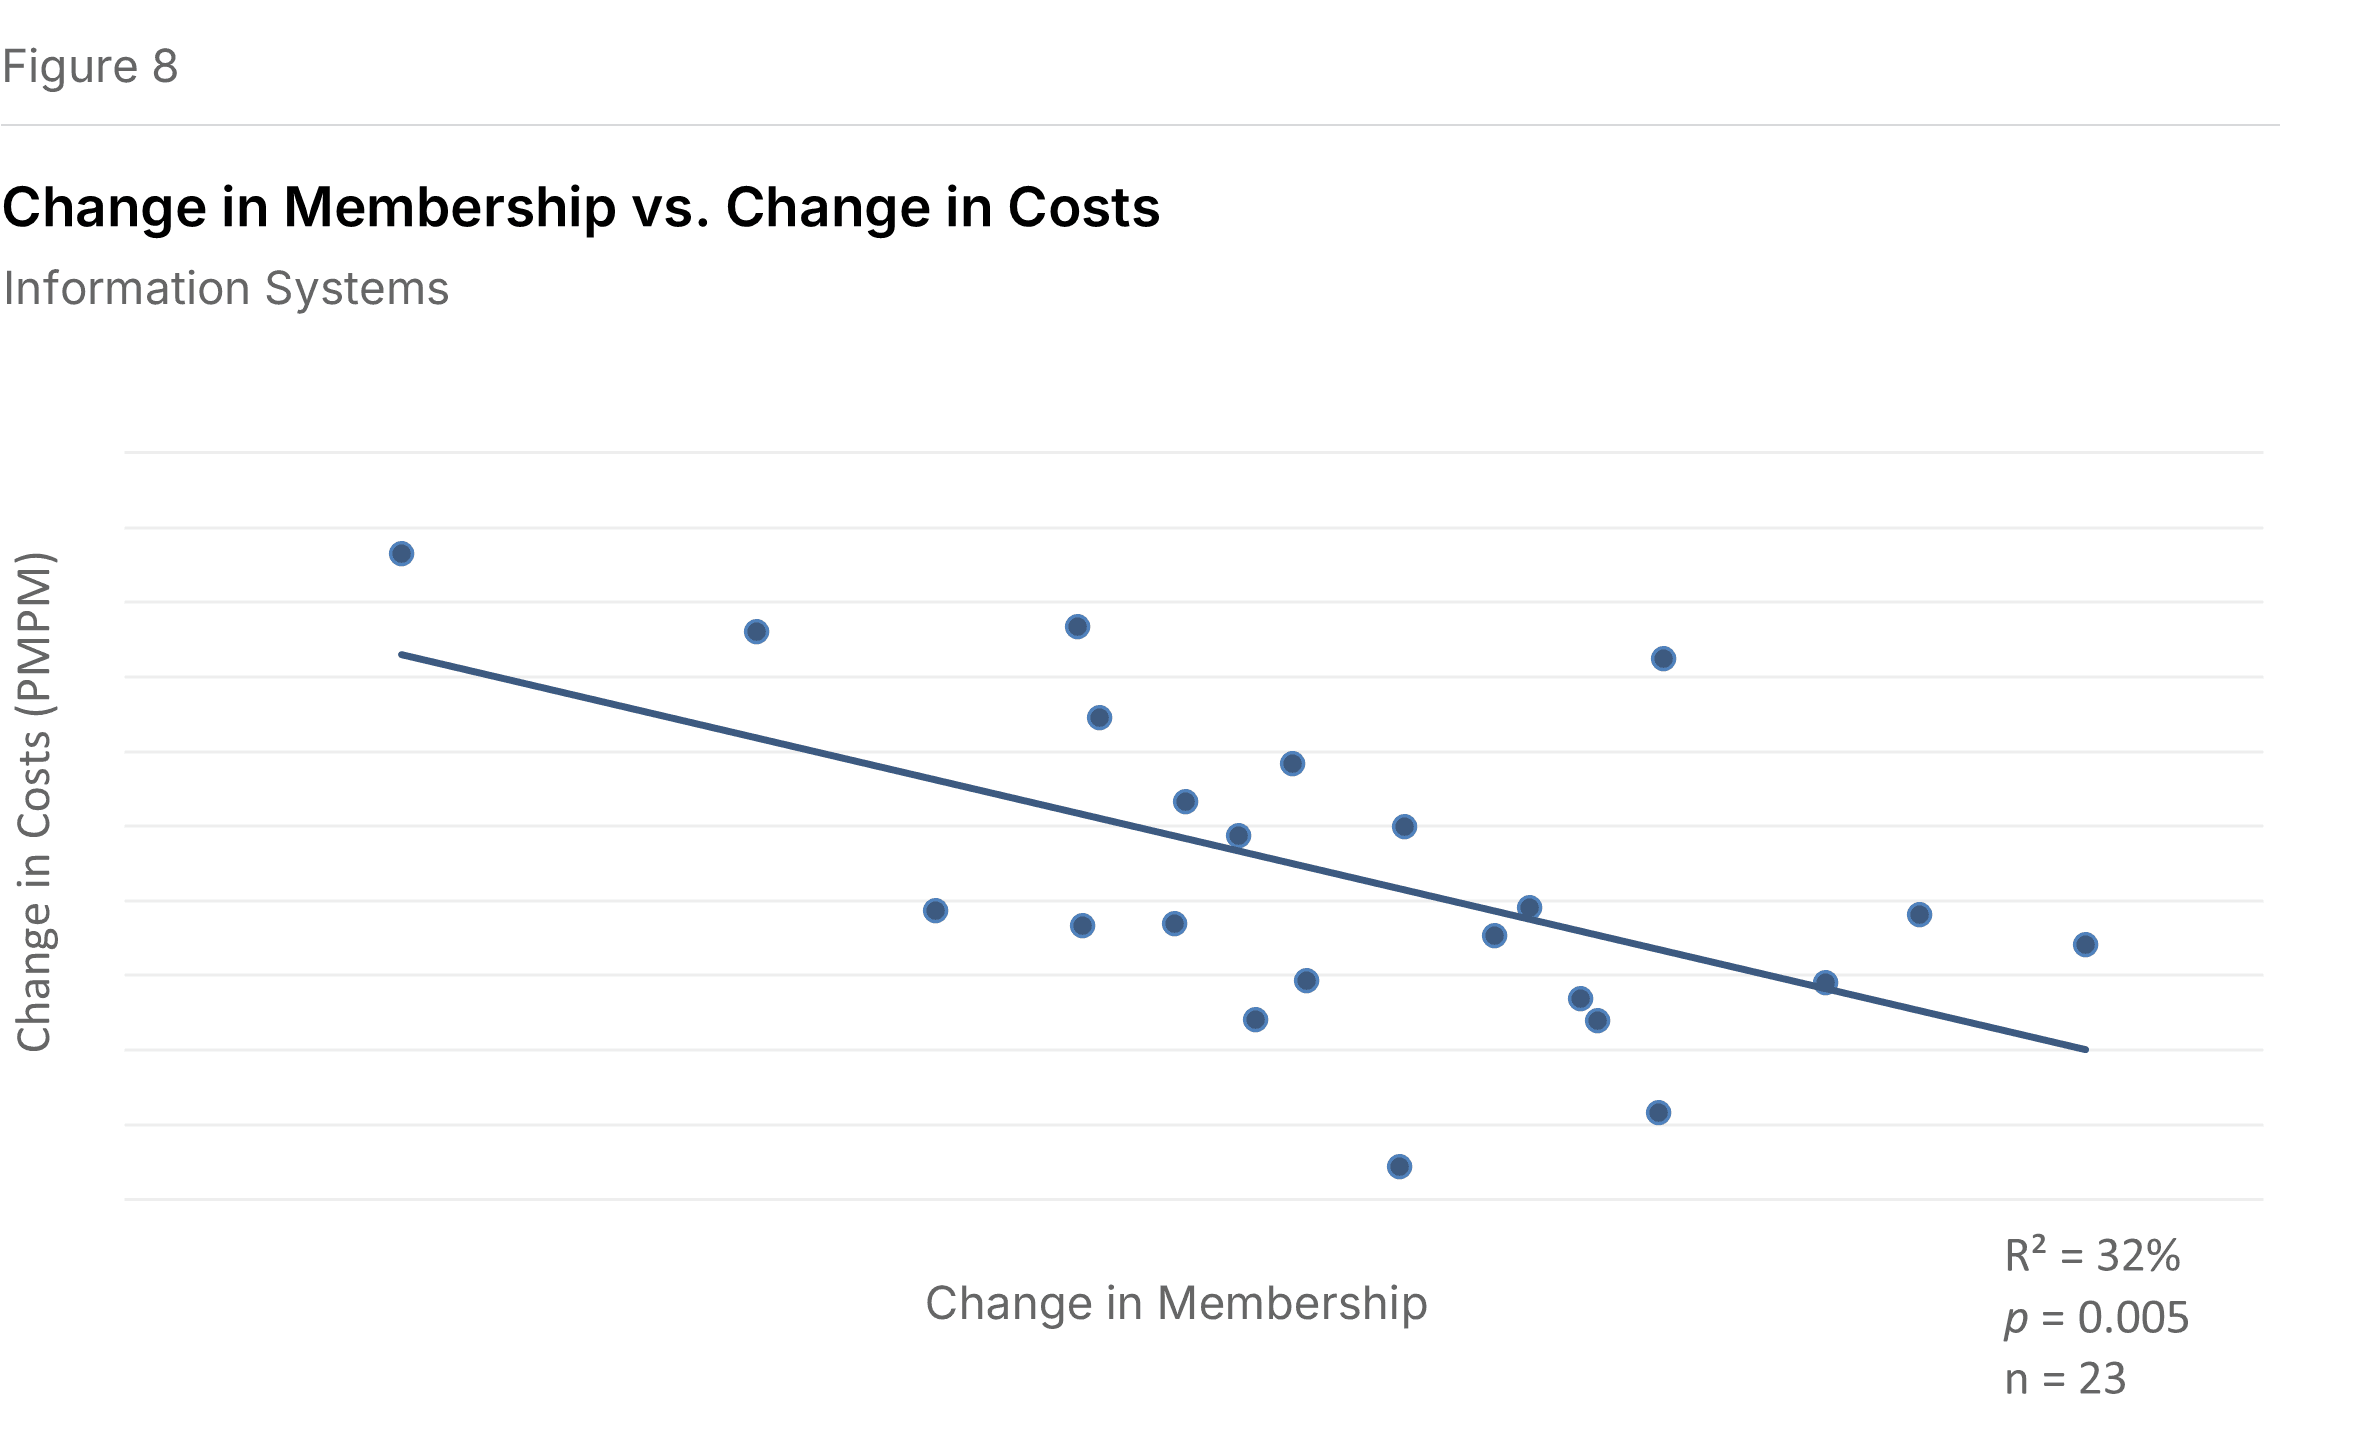
Information Systems had the second-strongest function-level relationship (P=0.005, R²=31.5%), with a slope of negative 1.53. See Figure 8.
Several functions showed negative slopes that did not reach statistical significance, including Rating and Underwriting, Provider Network, Enrollment, Claims, Finance and Accounting, Actuarial, and Corporate Services. A few functions showed positive slopes (costs rising with membership growth): Advertising and Promotion, Medical Management, Corporate Executive & Governance, and Association Dues and License Filing Fees. None of these positive relationships were significant.
What This Means for Plans
For plans experiencing rapid membership growth, particularly through acquisition or market expansion, these findings suggest that administrative cost efficiencies can materialize quickly. The Account and Membership Administration cluster, which includes some of the most operationally intensive functions, showed the largest scale benefit. Plans may gain breathing room to integrate operations and pursue longer-term efficiencies.
Conversely, plans experiencing membership decline face the reverse dynamic: per-member costs tend to rise as fixed costs spread over fewer members. The Medicaid redetermination-driven declines of 12% to 15% would, by this model, translate to meaningful upward pressure on per-member administrative costs.
The absence of significant effects in Medical and Provider Management suggests that these functions do not yield short-term scale benefits. Health benefit cost management may require sustained investment regardless of membership fluctuations.
An online Short-Term Scale Calculator applying these relationships is available at sherlockco.com/sts-calculator.
Methodology
This is a time-series study of 23 health plans that participated in both the 2024 and 2025 Sherlock Benchmark cycles, drawn from the combined Blue Cross Blue Shield and Independent/Provider-Sponsored universes. We regressed one-year changes in per-member costs against one-year changes in membership for total costs, four expense clusters, and sixteen principal functions.
Plan sizes ranged from high tens of thousands to millions of members, excluding start-ups and their associated high costs and explosive growth. We use a 10% significance threshold (P<0.10) to cast a wide net for potential scale effects. The R² values reported here indicate how much of the variation in cost growth the membership-growth relationship explains; the remainder reflects other factors.
Unlike our long-term economies of scale studies, we did not adjust for product mix differences. While plans differ substantially in product mix, any given plan's mix changes modestly year-over-year, making adjustment less critical for this short-term analysis.
The sixteen functional areas group into four clusters as shown in Appendix A. Miscellaneous Business Taxes and sub-functions are excluded from this analysis.
1 Nancy Ochieng, Meredith Freed, Jeannie Fuglesten Biniek, Anthony Damico, and Tricia Neuman. "Medicare Advantage in 2025: Enrollment Update and Key Trends." KFF, August 11, 2025.