
Background
In this Plan Management Navigator, we explore possible administrative links in serving Medicaid, Commercial Insured and ACA products. Notwithstanding that health plans typically serve multiple lines of business, they are rarely organized to operate along these product lines. In other words, it is typically impractical for plans to operate separate claims, customer services, or enrollment functions strictly along product lines. However, for the Sherlock Benchmarks, they do segment administrative costs by product, employing an activity-based cost methodology, such as allocating costs by claims volumes, customer service inquiries and so forth. For that reason, we know that Provider Network Management and Services costs per member are lower for Medicaid than for Commercial Insured but Medicaid had slightly higher costs for Medical Management.
There also appears to be a difference in model design between the products reflected in the respective resource commitments since health care costs are vastly lower for Medicaid than Commercial Insured.
ACA products have health care costs per member that are slightly lower than Commercial Insured but higher than Medicaid. As with Commercial Insured, Medicaid had lower Provider Network costs than ACA but higher Medical Management expenses. The differences in administrative costs were dwarfed by the lower Medicaid health care cost differences.
When measured against the underlying health care costs, Medicaid is managed with greater intensity through Provider Network and Medical Management activities than ACA, which is in turn more aggressively managed than Commercial Insured.
This Navigator reports on our tests of whether administrative practices in one product, Medicaid, tend to bleed into other product lines within organizations. It is based on the 2024 Sherlock Benchmarks, which reflects data from year-ended 2023. There were 29 plans that participated across all universes. Two plans were excluded for being extreme outliers, while two plans did not serve the Commercial Insured population. Of these, thirteen of these plans further segmented expenses by function on products serving the healthcare exchanges, or Marketplace. We most frequently used "Medicaid Concentration" as the independent variable, which we define as the proportion of total plan members that are served by Medicaid.
We focused our analyses on the two functions in the Medical and Provider Management cluster. In the process of our analyses, we also analyzed the Account and Membership Administration clusters of expenses though had limited success in capturing meaningful relationships. We excluded the Sales and Marketing cluster since this area is subject to regulations that vary by state. We also excluded the Corporate Services Cluster due to distortions related to economies of scale.
The exception to this was we found that plans with a higher concentration of Medicaid also higher total administrative costs in their Exchange businesses.
Generally, we found that health plans with higher Medicaid concentration also reported higher Provider Network Management and Services administrative expenses for their Commercial Insured and ACA products. This relationship was also present for Medicaid concentration and Commercial Insured Provider Management staffing ratios.
We generously considered relationships to be significant if they had P-Values of 10% or less. The P-Value is the chance that the relationship described by the regression line could be the result of an unrepresentative sample. The R² describes the degree to which all the data points are found on the slope, that is, the degree to which the slope explains the relationship.
Medicaid Concentration and Commercial Insured Costs in the Medical and Provider Management Cluster
The results of Medicaid Concentration and Commercial Insured PMPM costs in Medical and Provider Management cluster. This cluster is comprised of the functional areas of Provider Network Management and Medical Management / Quality Assurance / Wellness. The results for the cluster as a whole was an insignificant relationship measured with a P-Value of 68.9% and R² of 0.7%.
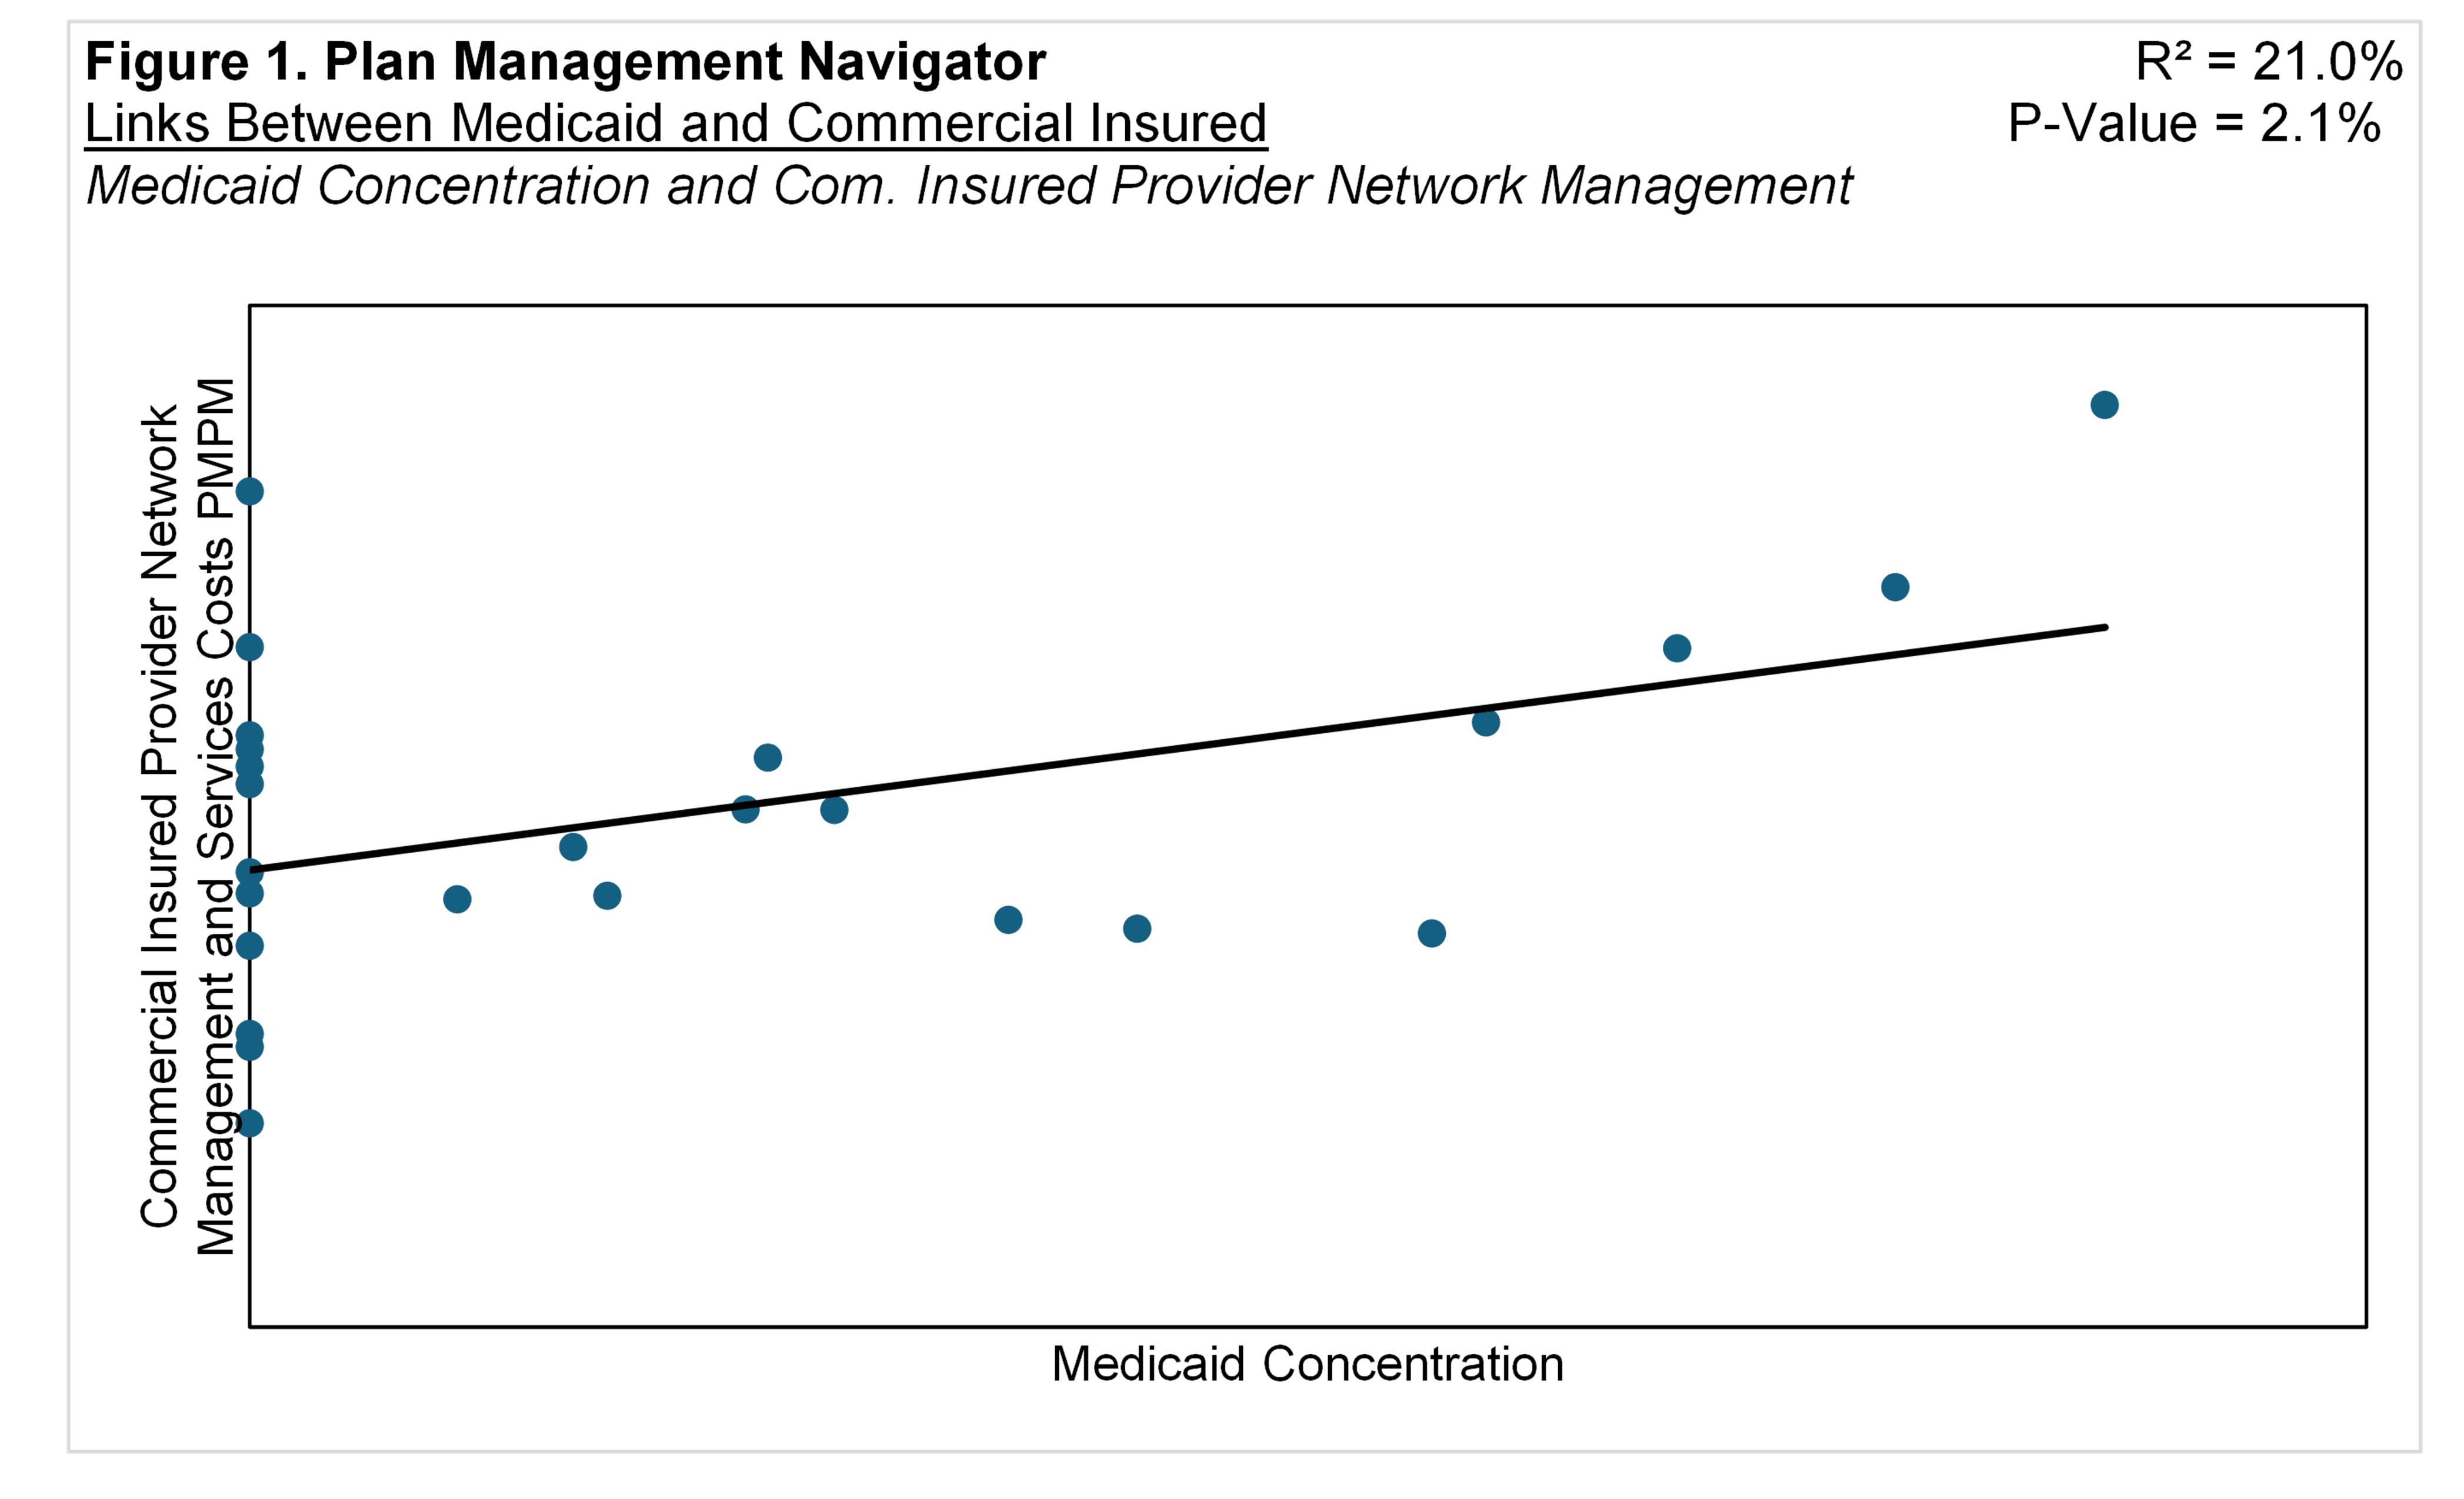
We then tested Medicaid Concentration against the Commercial Insured expenses in the cluster's subfunctions, Provider Network Management and Services and Medical Management. Medicaid Concentration and Medical Management costs PMPM failed to achieve significance, with a P-Value of 42.6% and R² of 2.8%. However, Medicaid Concentration and Provider Network Management expenses PMPM resulted in a significant relationship, with a P-Value of 2.1% and R² of 21.0%, shown in Figure 1.
The positive relationship between the variables suggests that, for Commercial Insured products, the higher proportion in Medicaid is associated with higher PMPM costs in Provider Network Management and Services.
Medicaid Concentration and Commercial Insured Staffing Ratios in Medical and Provider Management
We also analyzed the relationship between the proportion of members in Medicaid and Staffing Ratios for Commercial Insured in the Medical and Provider Management Cluster. (Staffing Ratios are inferred by dividing Commercial Insured costs by total costs per FTE.) For most health plan activities, staffing ratios are closely related to per member costs, so we focused on those inferred staffing ratios. Staffing ratios include the effects of outsourcing.
The analysis of the proportion of Medicaid members and the Commercial Insured Staffing Ratios for the Medical and Provider Management cluster resulted in an insignificant correlation with a P-Value of 75.3% and a R² of 0.4%, not unlike PMPM expenses.
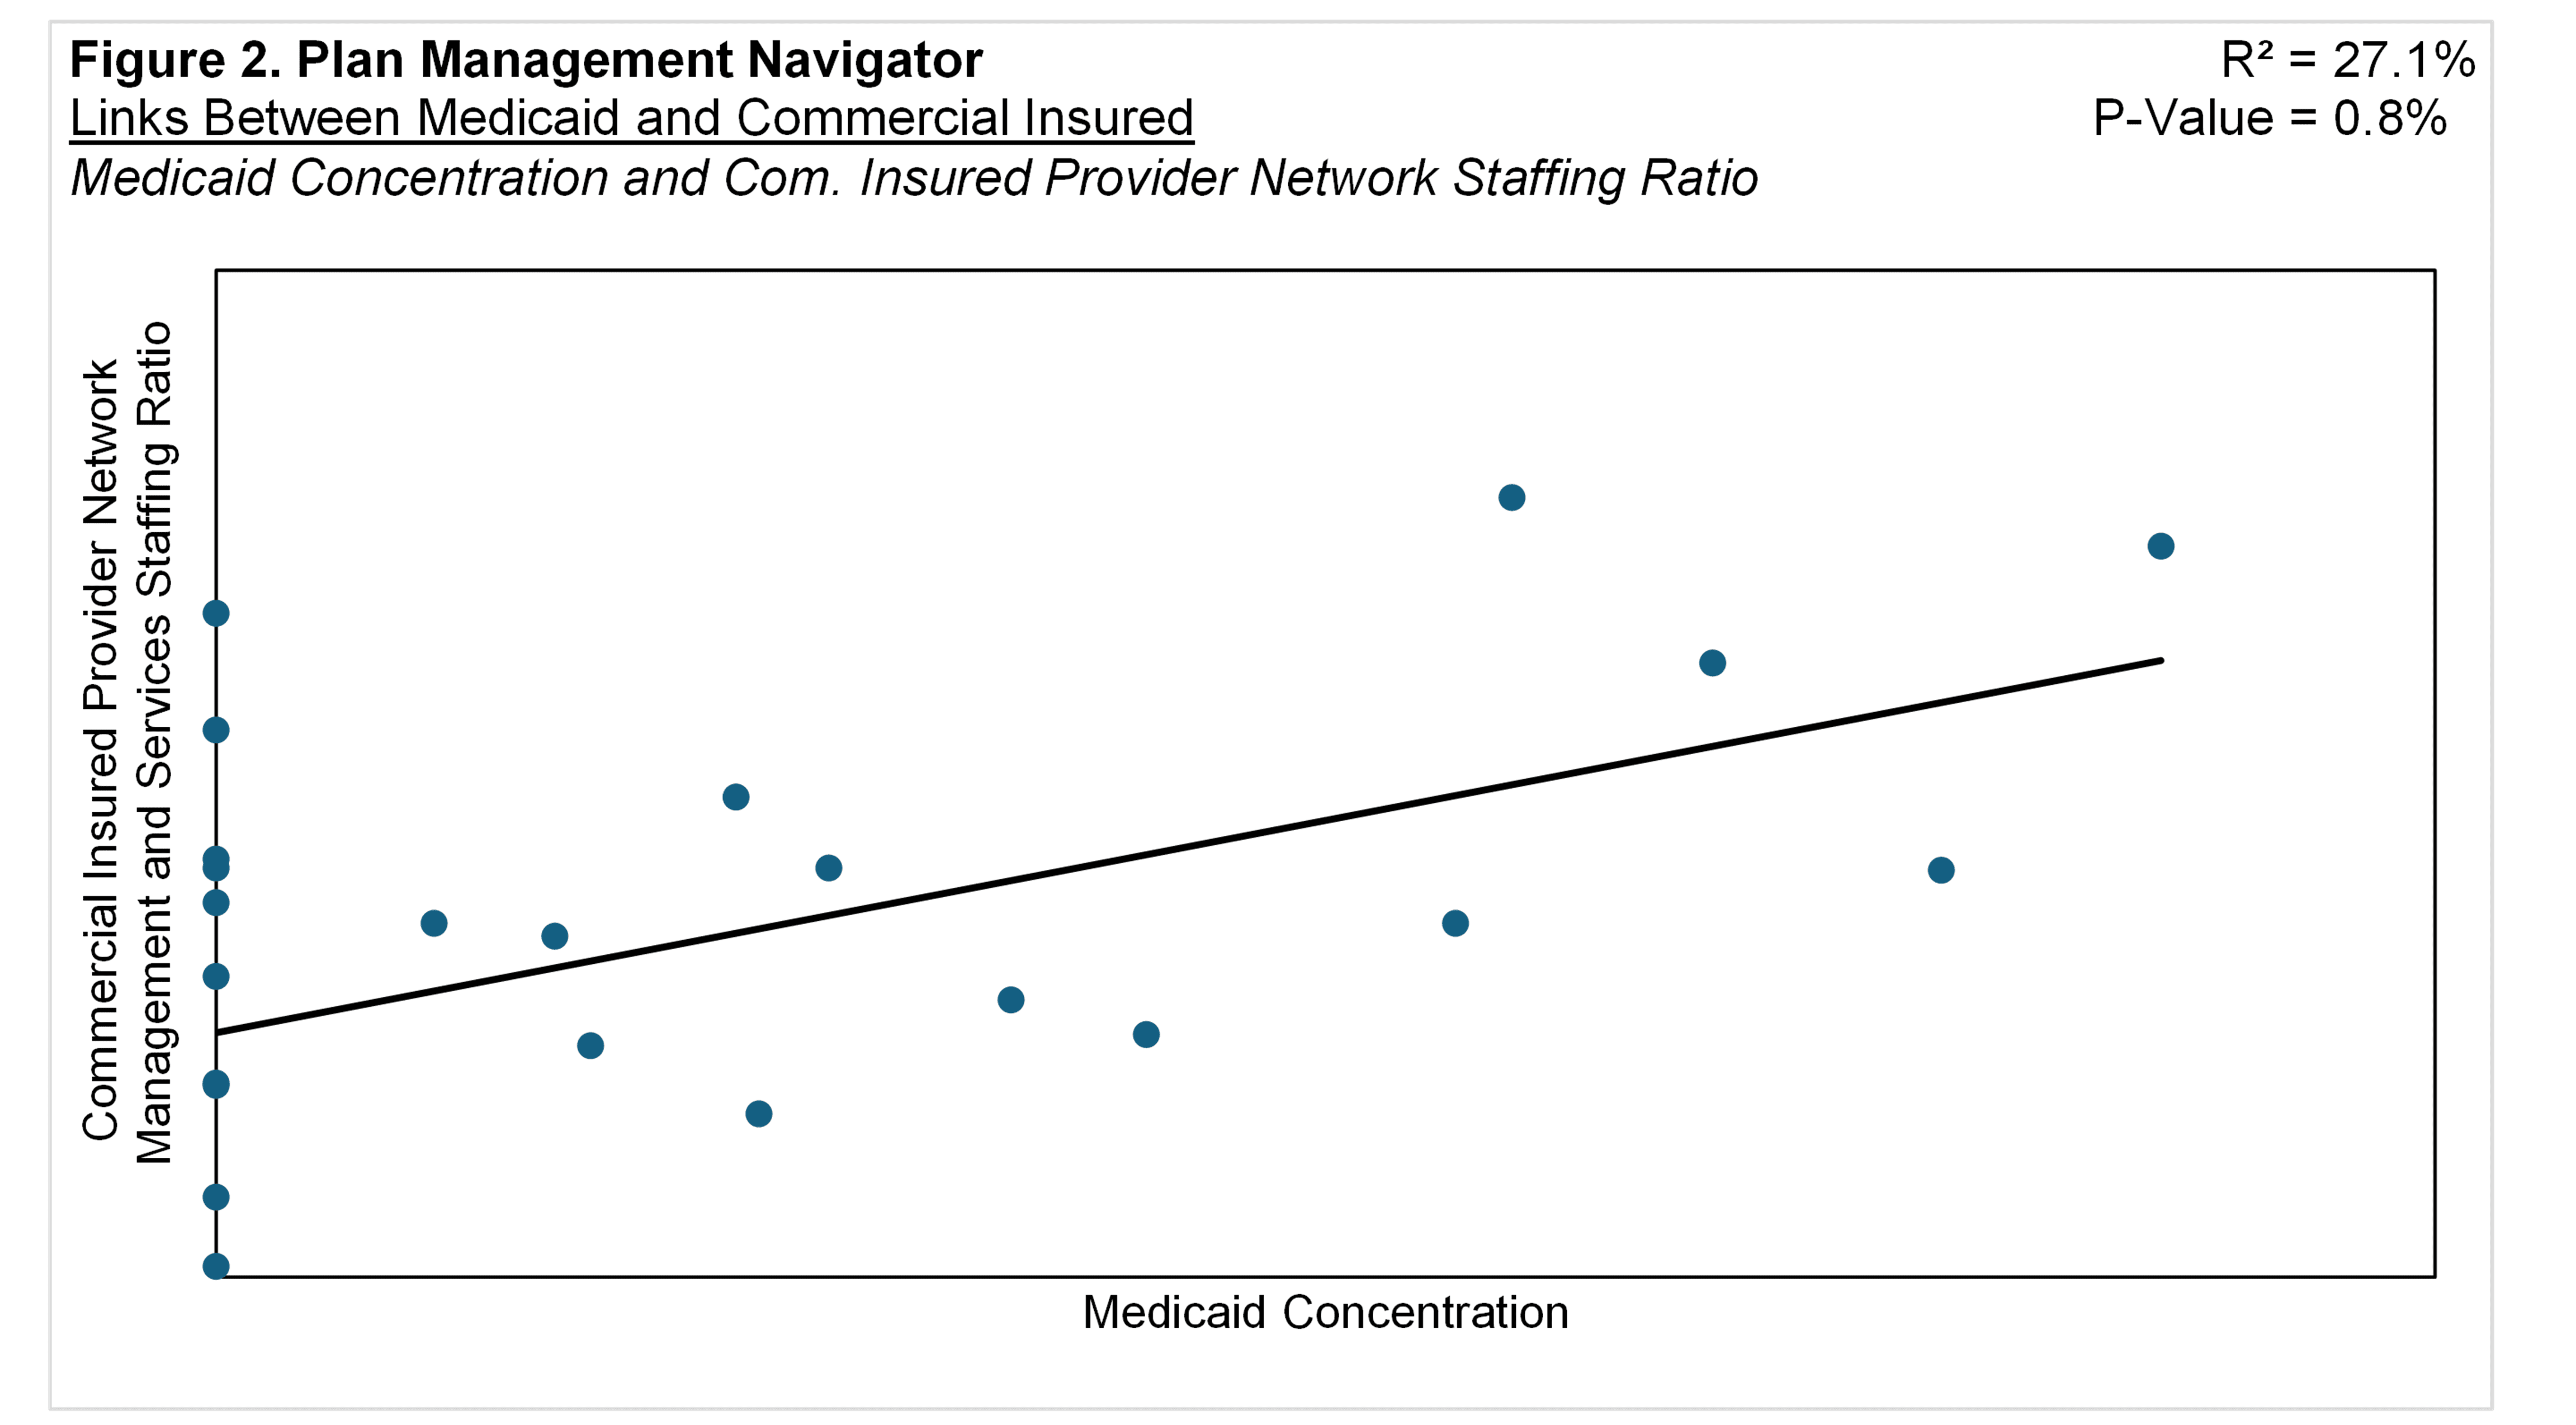
However, within the cluster's functional areas, Medicaid Concentration displayed a significant and positive association with Provider Network Management and Services. In Figure 2, we show that the higher the focus on Medicaid, the higher the Staffing Ratios in Provider Network Management function for Commercial Insured. The R² was 27.1% and the P-Value was 0.8%.
The Commercial Insured Staffing Ratio in the Medical Management function did not yield a significant relationship with Medicaid Concentration with a P-Value of 62.4% and R² of 1.1%. The analogous cost analysis also did not achieve our significance threshold.
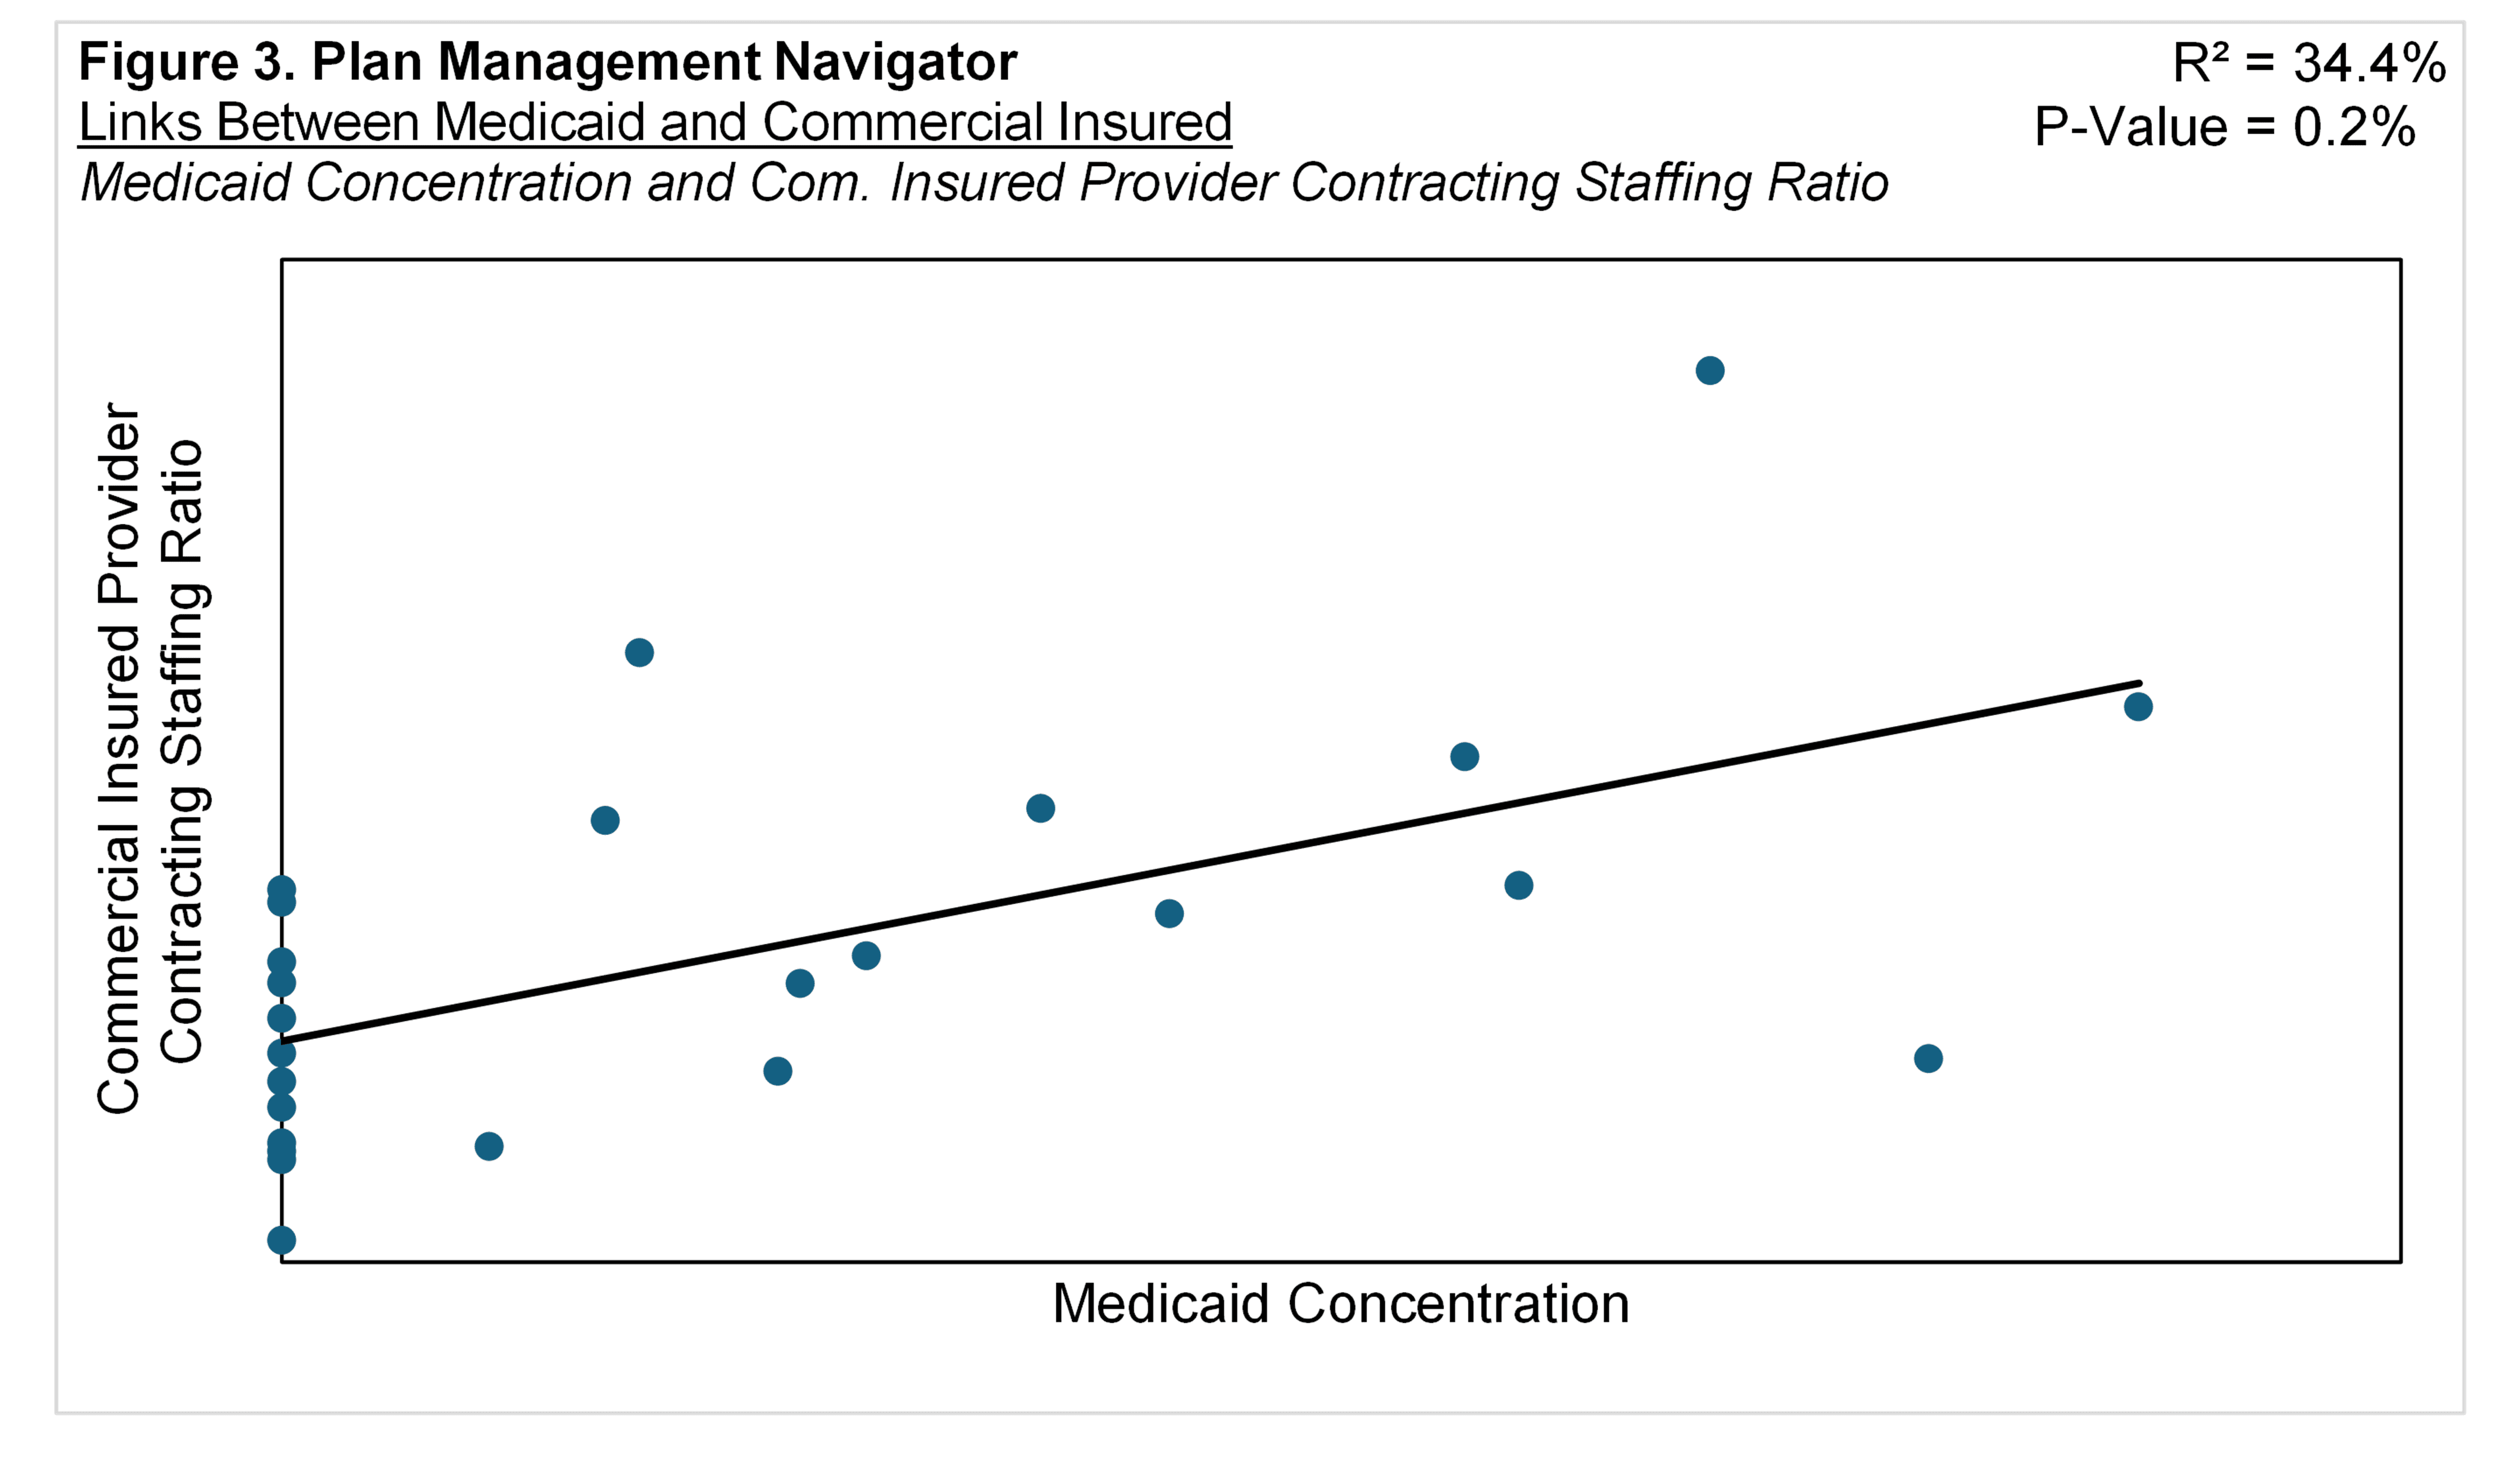
We also tested the subfunctions within Provider Network Management and Medical Management. Figure 3 shows the significant link between Medicaid Concentration and Provider Contracting sub-function, with a P-Value of 0.2% and R² of 34.4%. This suggests that the higher the mix of Medicaid members is associated with higher Commercial Insured Staffing Ratios with the Provider Contracting sub-function. Both Provider Relations Services and Other Provider Network Management and Services staffing for Commercial Insured displayed near significant, positive relationships with Medicaid concentration.
Medicaid Concentration and ACA Under 65 Exchange Costs
A subset of Sherlock Benchmark participants that served both the Medicaid and Commercial Insured products also detailed expenses in their Exchange or Marketplace products. For example, nearly all Blue Plans served the Individual Market, which composes a median of 23% and a mean of 26% of their Commercial Insured Membership. Of the Plans that provided their Exchange expense data, about 80% of their individual members are enrolled in their ACA product.
Medicaid Concentration exhibited significant links with Exchange-related Account and Membership Administration Cluster costs and Provider Network Functional Area costs.
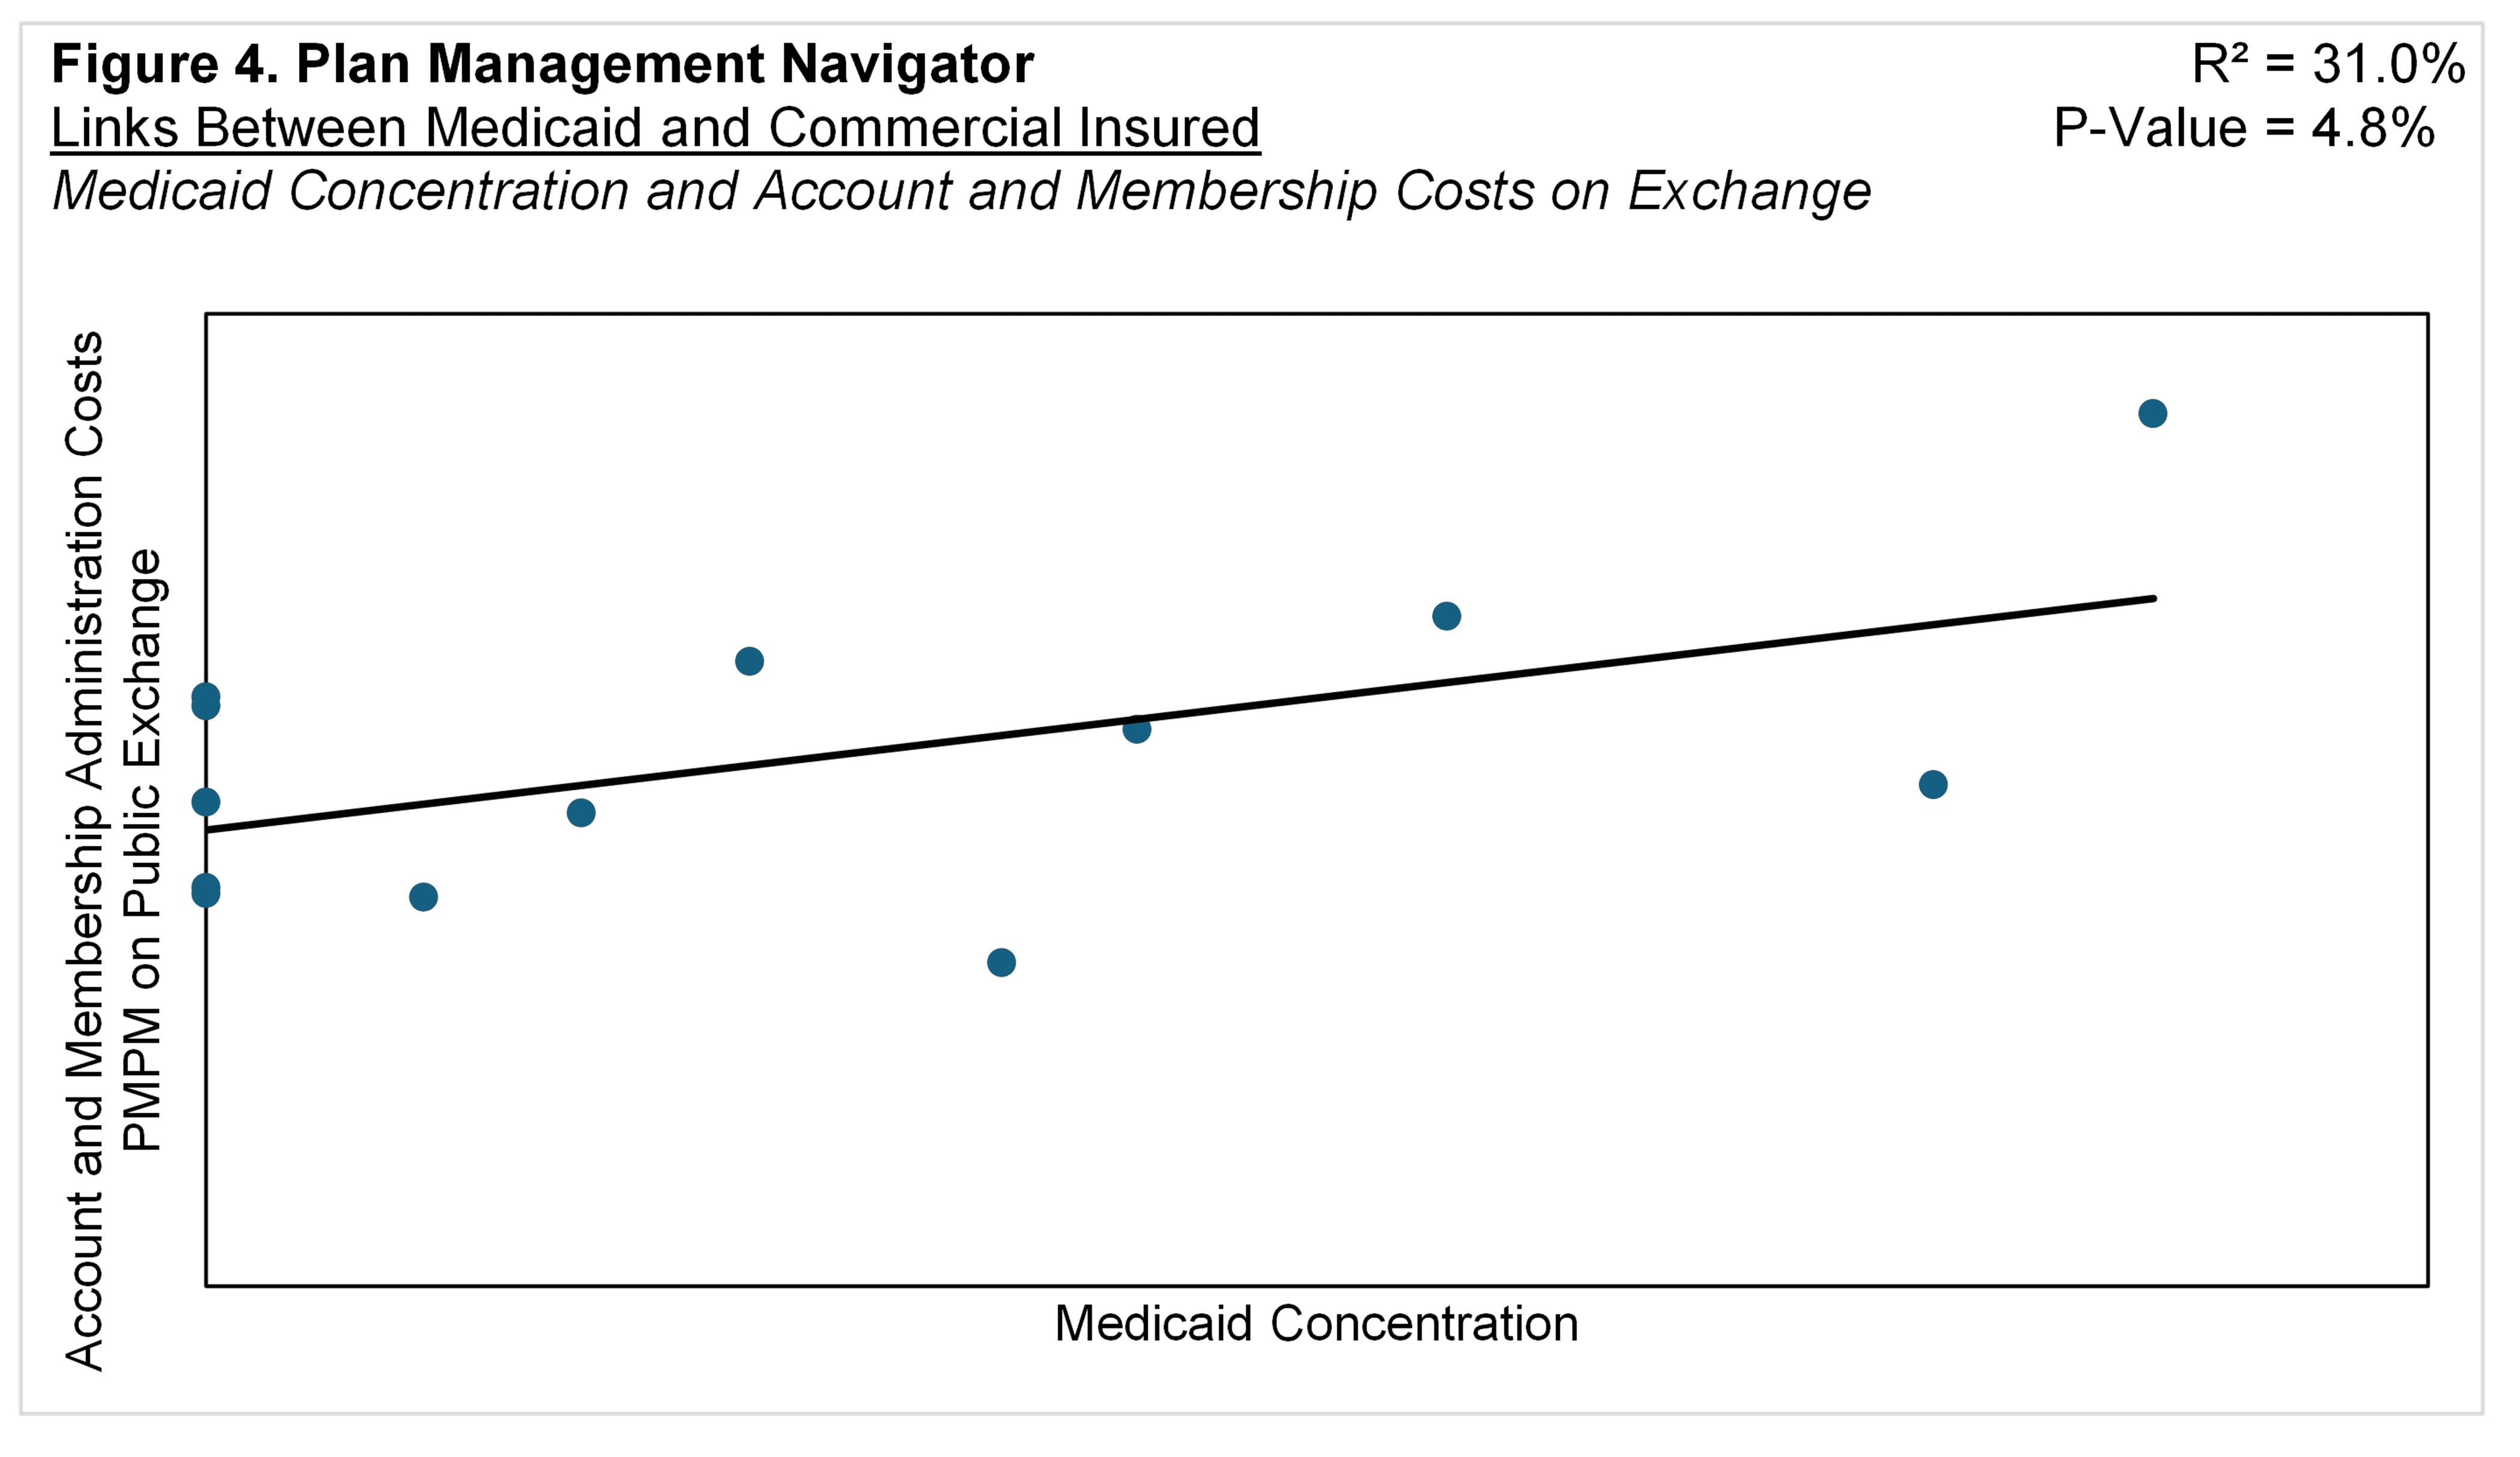
Figure 4 displays the relationship between Medicaid Concentration and PMPM cluster of costs for Account and Membership Administration. (We did not endeavor to estimate staffing by market segment.) The positive slope suggests that the higher the proportion of Medicaid members the higher the PMPM costs in Account and Membership Administration for the Exchange product. The P-Value was 4.8% and R² was 31.0%. (The Account and Membership Administration cluster is comprised of activities central to health plan operations, Information Systems, Claims, Customer Services, and Enrollment.)
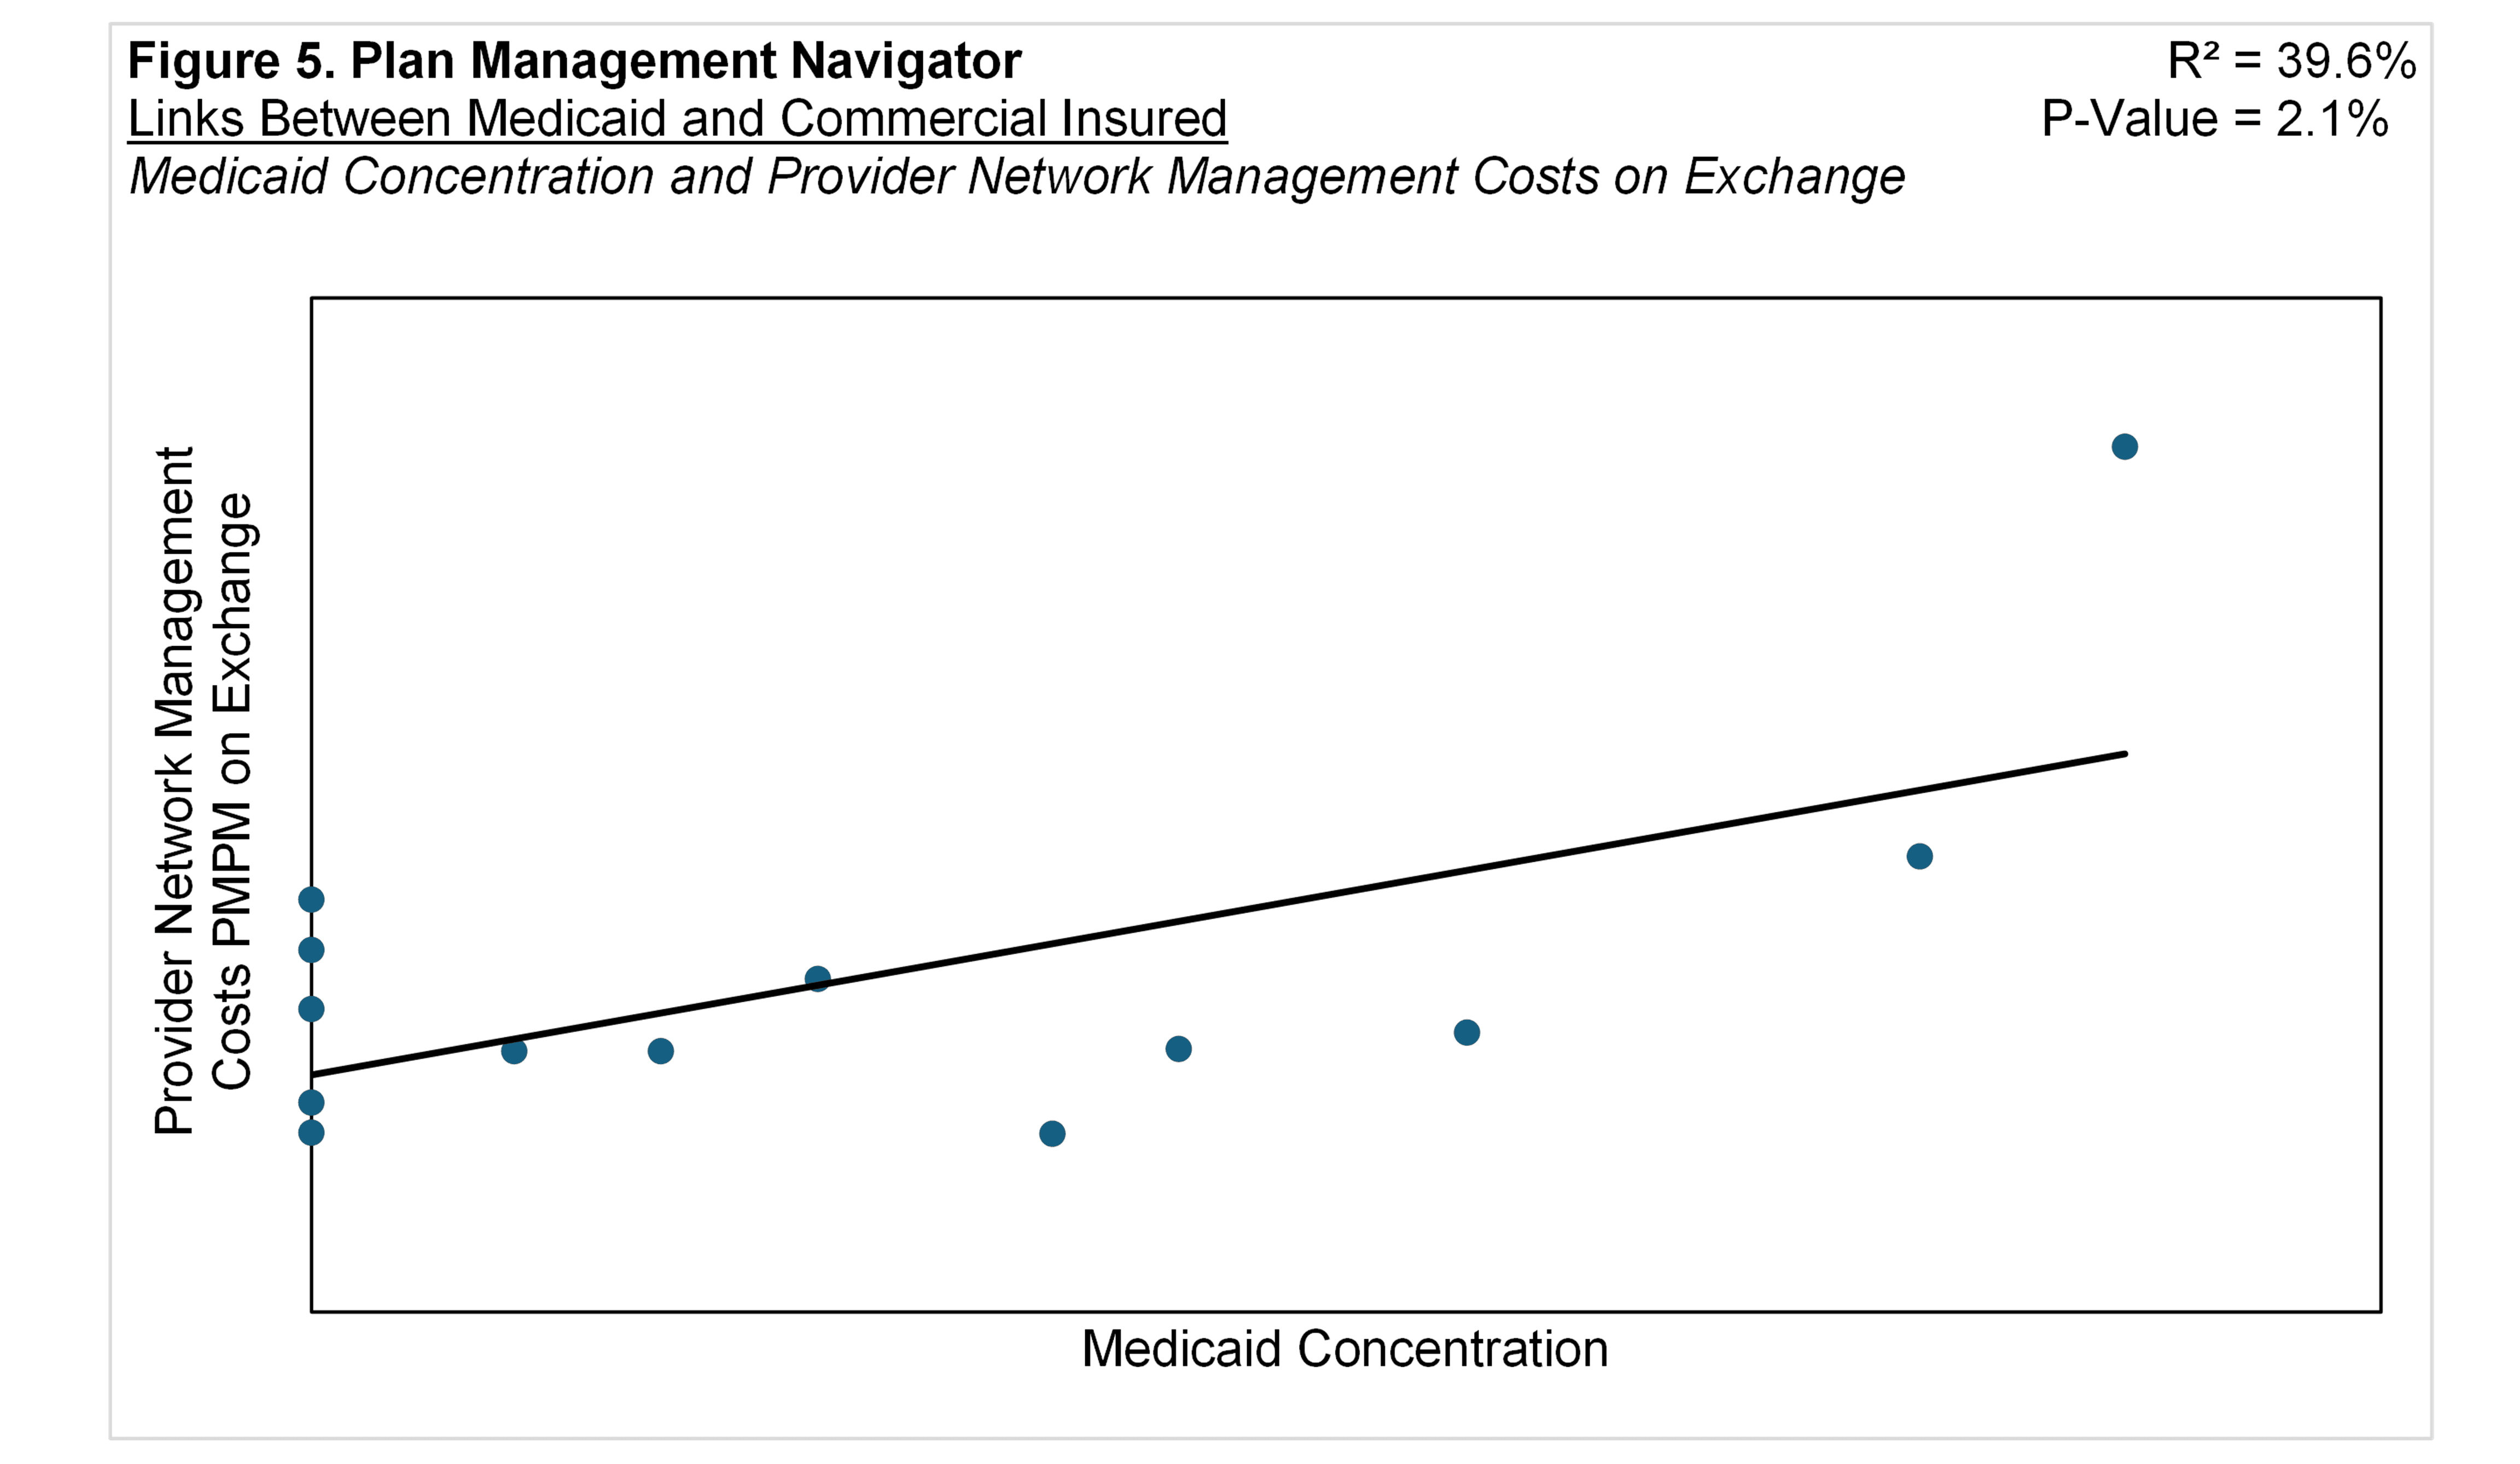
The relationship between Medicaid Concentration and the cluster of Medical and Provider Management PMPM expenses on Exchange yielded an insignificant link with a P-Value of 72.5% and R² of 1.2%. However, within the Medical and Provider Management cluster, Medicaid Concentration exhibited a significant relationship with the PMPM costs of the Provider Network Management function. Seen in Figure 5, the relationship was a P-Value of 2.1% and R² of 39.6%. The positive slope indicates that the higher the Medicaid Concentration, the higher the per member Provider Network expenses for the Exchange product. Exchange-related Medical Management PMPM expenses were also tested, but yielded insignificant results at a P-Value of 36.1% and R² of 7.6%.
Conclusion
There appear to be meaningful links between a health plan's emphasis on Medicaid and its resource commitments in healthcare management for Commercial Insured and ACA Exchange products. These links are reflected in both administrative costs and staffing ratios.
While the direction of causality is unclear, the possibilities are noteworthy. For instance, these modeled relationships could occur among organizations with a prior commitment to Medicaid, with the attendant commitment to intensively managing networks and care for Commercial Insured and ACA members who alternate between the two benefit plan sponsors. Or perhaps organizations disposed to care management in Commercial Insured and ACA products are drawn to serve the Medicaid market where this need is especially acute.
This analysis is based on the 2024 Sherlock Benchmarks, reflecting data from the year ended 2023. Our focus was on statistically significant correlations primarily within the Medical and Provider Management cluster. Generally, the focus of the functions within this cluster tend to support long-term objectives like reducing healthcare costs. As a result, investments in this area may not generate immediate savings but may deliver returns over subsequent years.