
The Analysis
Larger health plans employ fewer people per member but pay them more. These two effects partially cancel out, which helps explain why economies of scale in health insurance are real but modest. In our Late October 2025 analysis, we found that 31% of administrative costs were subject to scale, with a doubling of plan size associated with costs falling to only 87% of their pre-doubling value. This Navigator examines why the effect isn't larger.
Staffing costs account for 54% of total costs at Blue Cross Blue Shield Plans and 49% at Independent/Provider-Sponsored Plans. When we decompose staffing costs into headcount (FTEs per member) and compensation (cost per FTE), a consistent pattern emerges: larger plans achieve lower staffing ratios but offset some of that savings through higher wages. The degree of offset varies by plan type and function.
Blue Cross Blue Shield Plans
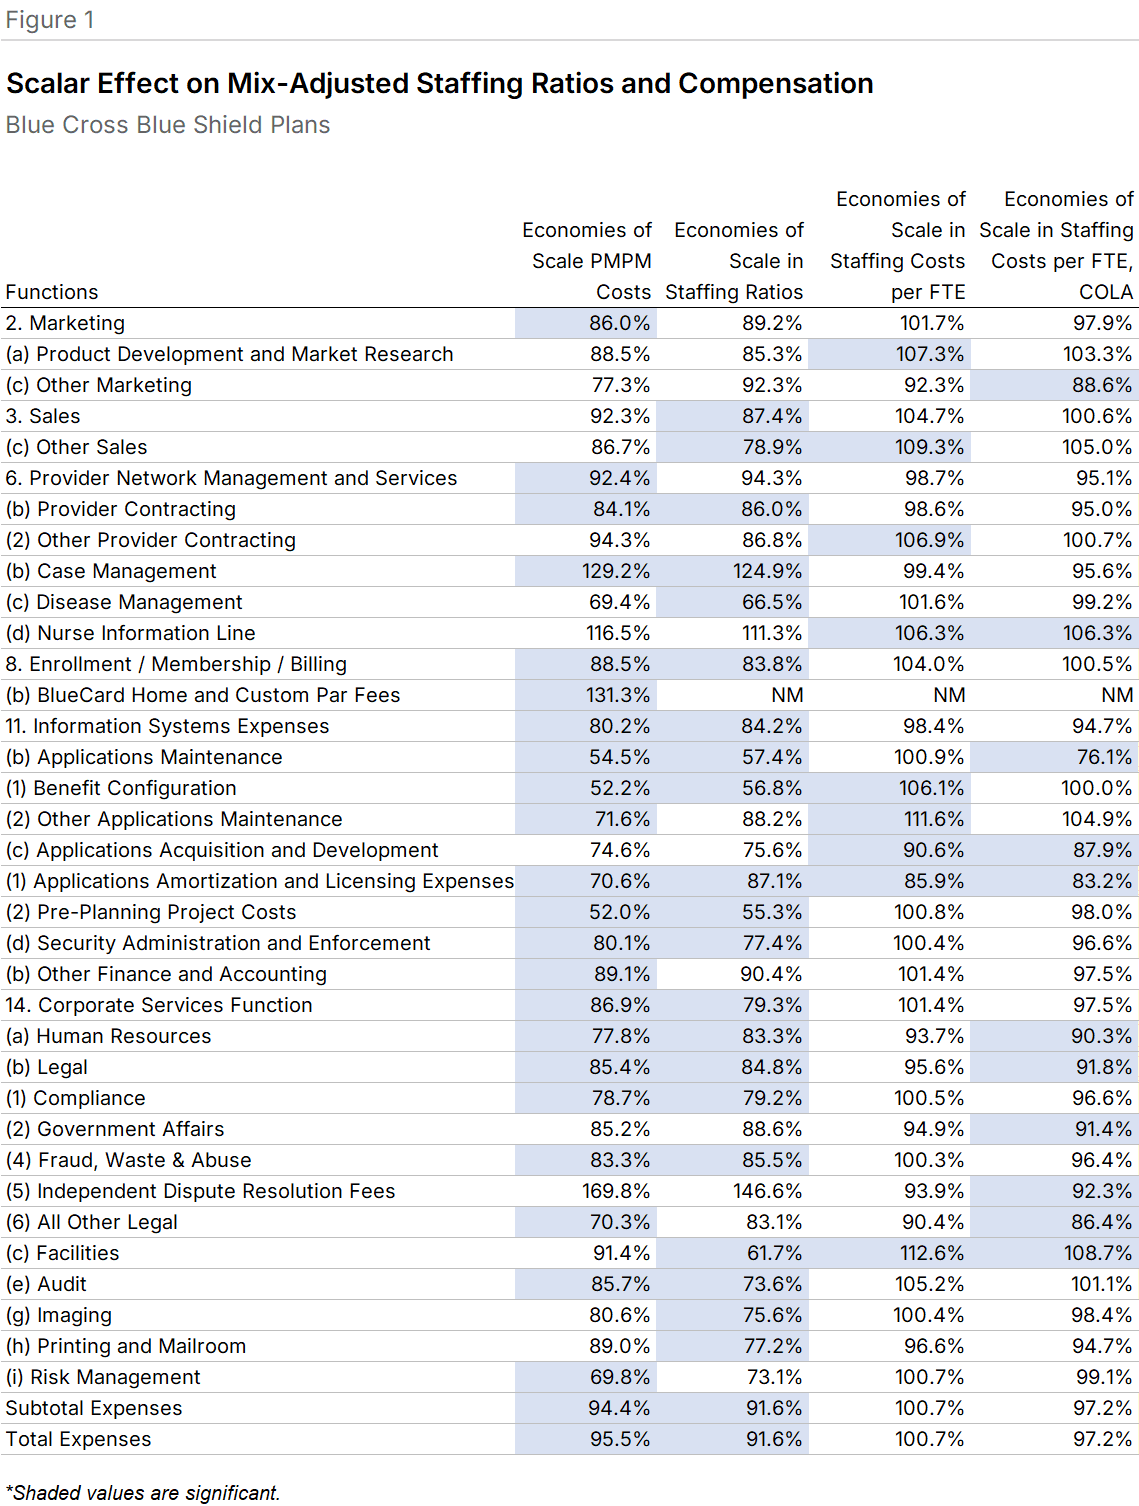
Fewer staff, higher pay. Among Blue Plans, 24 functional areas showed significant scale effects in staffing ratios, compared to 23 in PMPM costs. The staffing ratio slopes were generally steeper: Total staffing ratios had a BCG slope of 91.6% versus 95.5% for PMPM costs. Of the 24 functions with scale effects in PMPM costs, 17 (70.8%) also showed scale effects in staffing ratios (Figure 1).
Compensation moved in the opposite direction. Larger Blue plans paid higher wages in nearly every function, though the relationship was significant in only 9 cases. The pattern was clear in areas like Facilities, where doubling plan size was associated with per-FTE compensation rising to 112.6% of the pre-doubling value. Of the 9 significant compensation relationships, 7 had positive slopes.
Cost-of-living explains part of it. When we adjusted for local cost-of-living differences using CMS hospital payment indices, the positive relationship between scale and compensation weakened. The number of significant positive-slope relationships fell from 7 to 2. For the 7 functions showing compensation diseconomies without adjustment, 6 had shallower slopes after adjustment. Facilities dropped from 112.6% to 108.7%.
Independent/Provider-Sponsored Plans
Fewer scale effects overall. IPS plans showed significant scale relationships in fewer functional areas than Blue plans. Only 10 IPS functions displayed significant PMPM cost relationships with scale, compared to 24 for Blue plans. The median unadjusted staffing cost per FTE was 11% lower for IPS plans than for Blue plans.
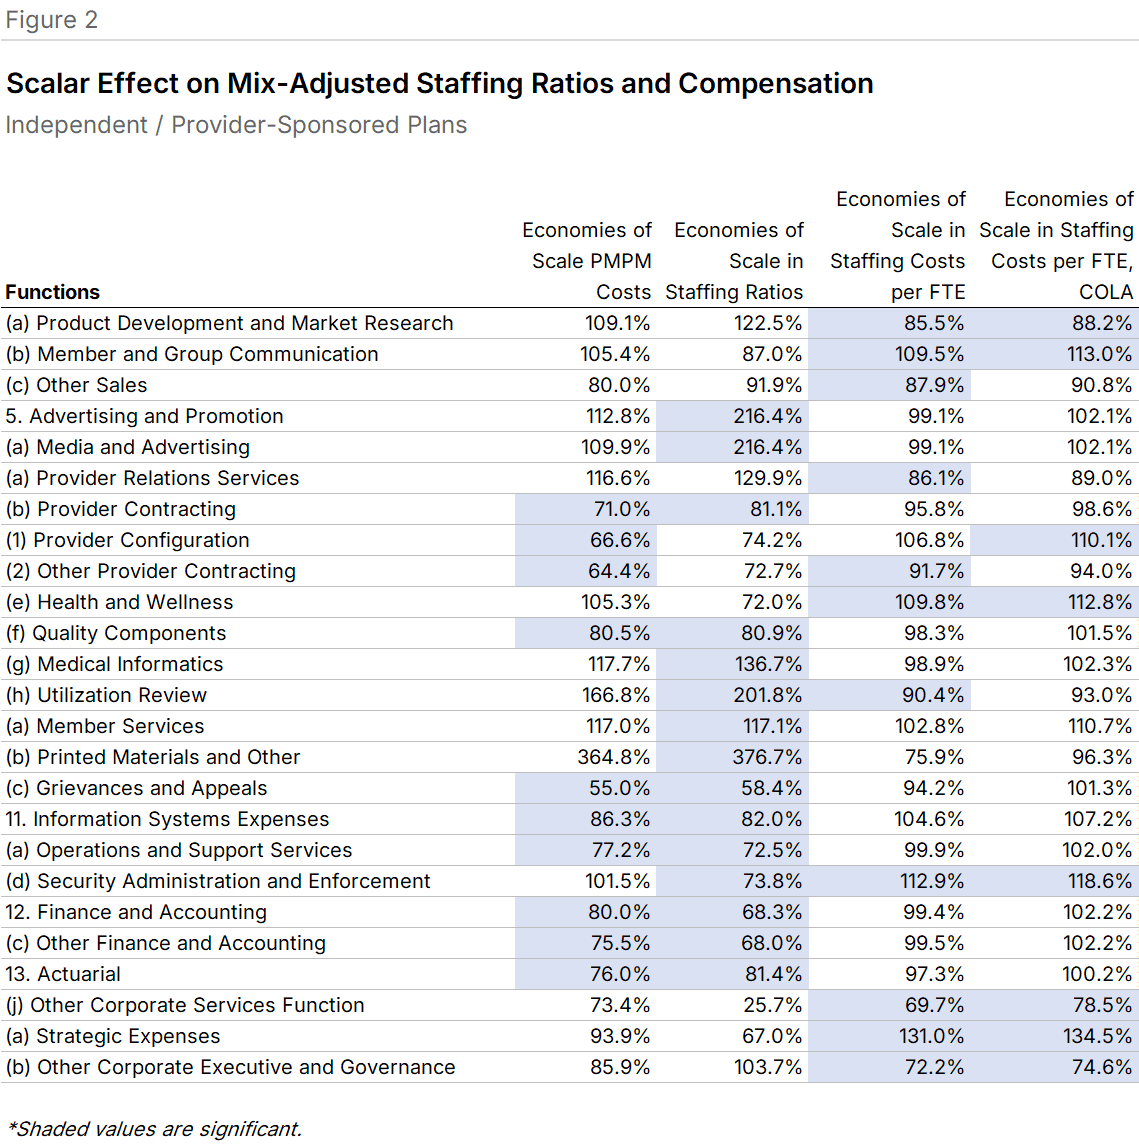
Where scale effects appeared, staffing ratios showed steeper declines than PMPM costs. Finance and Accounting had a BCG slope of 68.3% for staffing ratios versus 80.0% for PMPM costs. Fifteen functions displayed scale effects for staffing (9 with negative slopes), while 10 showed effects for costs (all negative). Eight functions exhibited significant effects in both measures (Figure 2).
Larger IPS plans pay less. Unlike Blue plans, larger IPS plans generally had lower per-FTE staffing costs. In Product Development and Market Research, doubling plan size was associated with compensation falling to 85.5% of the pre-doubling value. This reversal from the Blue pattern may reflect the smaller absolute size of even the largest IPS plans.
Cost-of-living adjustment amplified rather than dampened these effects. Every significant relationship with a BCG slope over 100% became steeper after adjustment (Member and Group Communication rose from 109.5% to 113.0%), and every slope below 100% became shallower (Product Development fell from 85.5% to 88.2%).
Combined Universe
More diversity, more signal. The combined set of 26 Blue and IPS plans showed more significant relationships between scale and per-FTE compensation than either group alone. This likely reflects the broader range of plan sizes and geographies in the combined sample.
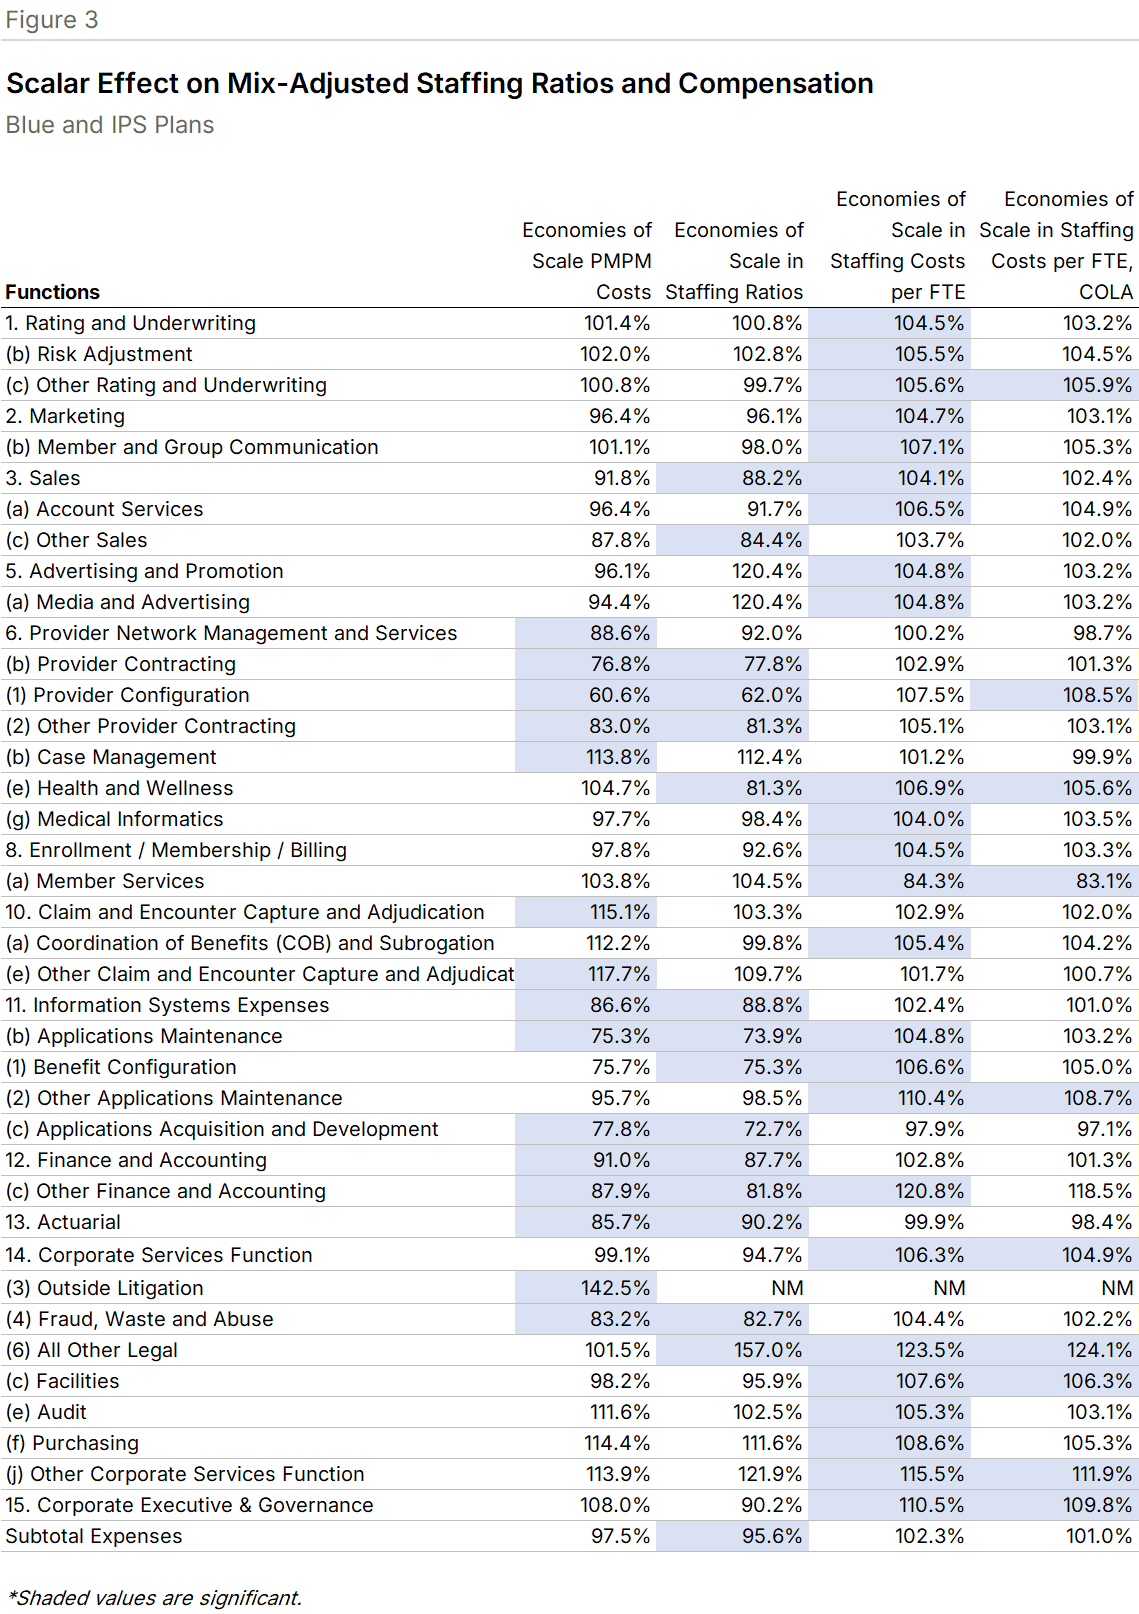
The combined universe had 15 significant scale/cost relationships, with 11 showing negative slopes (economies of scale). Sixteen functions showed significant staffing ratio relationships, 15 with negative slopes. Of these 16, 10 also displayed significant cost relationships, all negative. Staffing ratio slopes were generally steeper than cost slopes: Applications Maintenance had a BCG slope of 73.9% for staffing ratios versus 75.3% for PMPM costs (Figure 3).
Compensation offsets persist. The scale/compensation relationships were almost universally positive. All significant functions but one had BCG slopes above 100%. Corporate Executive and Governance showed that doubling plan size was associated with per-FTE costs rising to 110.5% of the pre-doubling value. A potential confound: the largest plans tend to be Blue Cross Blue Shield Plans, whose employees may have greater tenure.
After cost-of-living adjustment, slopes remained positive but fewer were significant. Corporate Services dropped from 106.3% to 104.9%.
What This Means for Plans
Plans pursuing scale-driven cost reduction should expect the benefits to come primarily through staffing ratios rather than compensation. The larger-plan premium on wages, whether driven by market positioning, employee tenure, or regional labor markets, represents a structural offset to headcount efficiencies. Plans evaluating merger or growth strategies should model both effects explicitly rather than assuming linear cost savings from membership growth.
Methodology
Data comes from the 2025 Sherlock Benchmarks, reflecting 2024 costs and staffing from surveys of 14 Blue Cross Blue Shield Plans and 12 Independent/Provider-Sponsored Plans. Relationships were estimated by regression analysis and considered significant at P < 0.1.
The BCG slope describes the effect of doubling membership: a value below 100% indicates economies of scale (negative slope), above 100% indicates diseconomies (positive slope). Staffing ratios include outsourced activities expressed as FTEs and are adjusted for product mix. Cost-of-living adjustments use CMS hospital payment indices.
Functions were included in each figure if they were significant in any regression within that universe. A fuller description of the BCG slope methodology appears in the Late October 2025 Plan Management Navigator.