
The participating plans collectively served 1.8 million Medicare Advantage members. These single state or regional plans differ sharply from Medicare-focused national plans by virtue of their relatively modest scale, lesser geographic diversification, and exclusion of Medicare Part D from their scopes.
Nine plans participated in both the 2024 and 2025 benchmarking cycles and the results of these were used for calculating same-plan trends.
The nine continuously participating plans served 1.7 million Medicare Advantage and Medicare SNP members. In addition, the continuous plans served 0.2 million Medicare Supplement members.
In comparison, including two new plans, the universe as a whole served over 1.9 million Medicare Advantage and Medicare SNP members and 0.5 million Medicare Supplement members.
Background on Medicare Advantage
Attractiveness of the Product
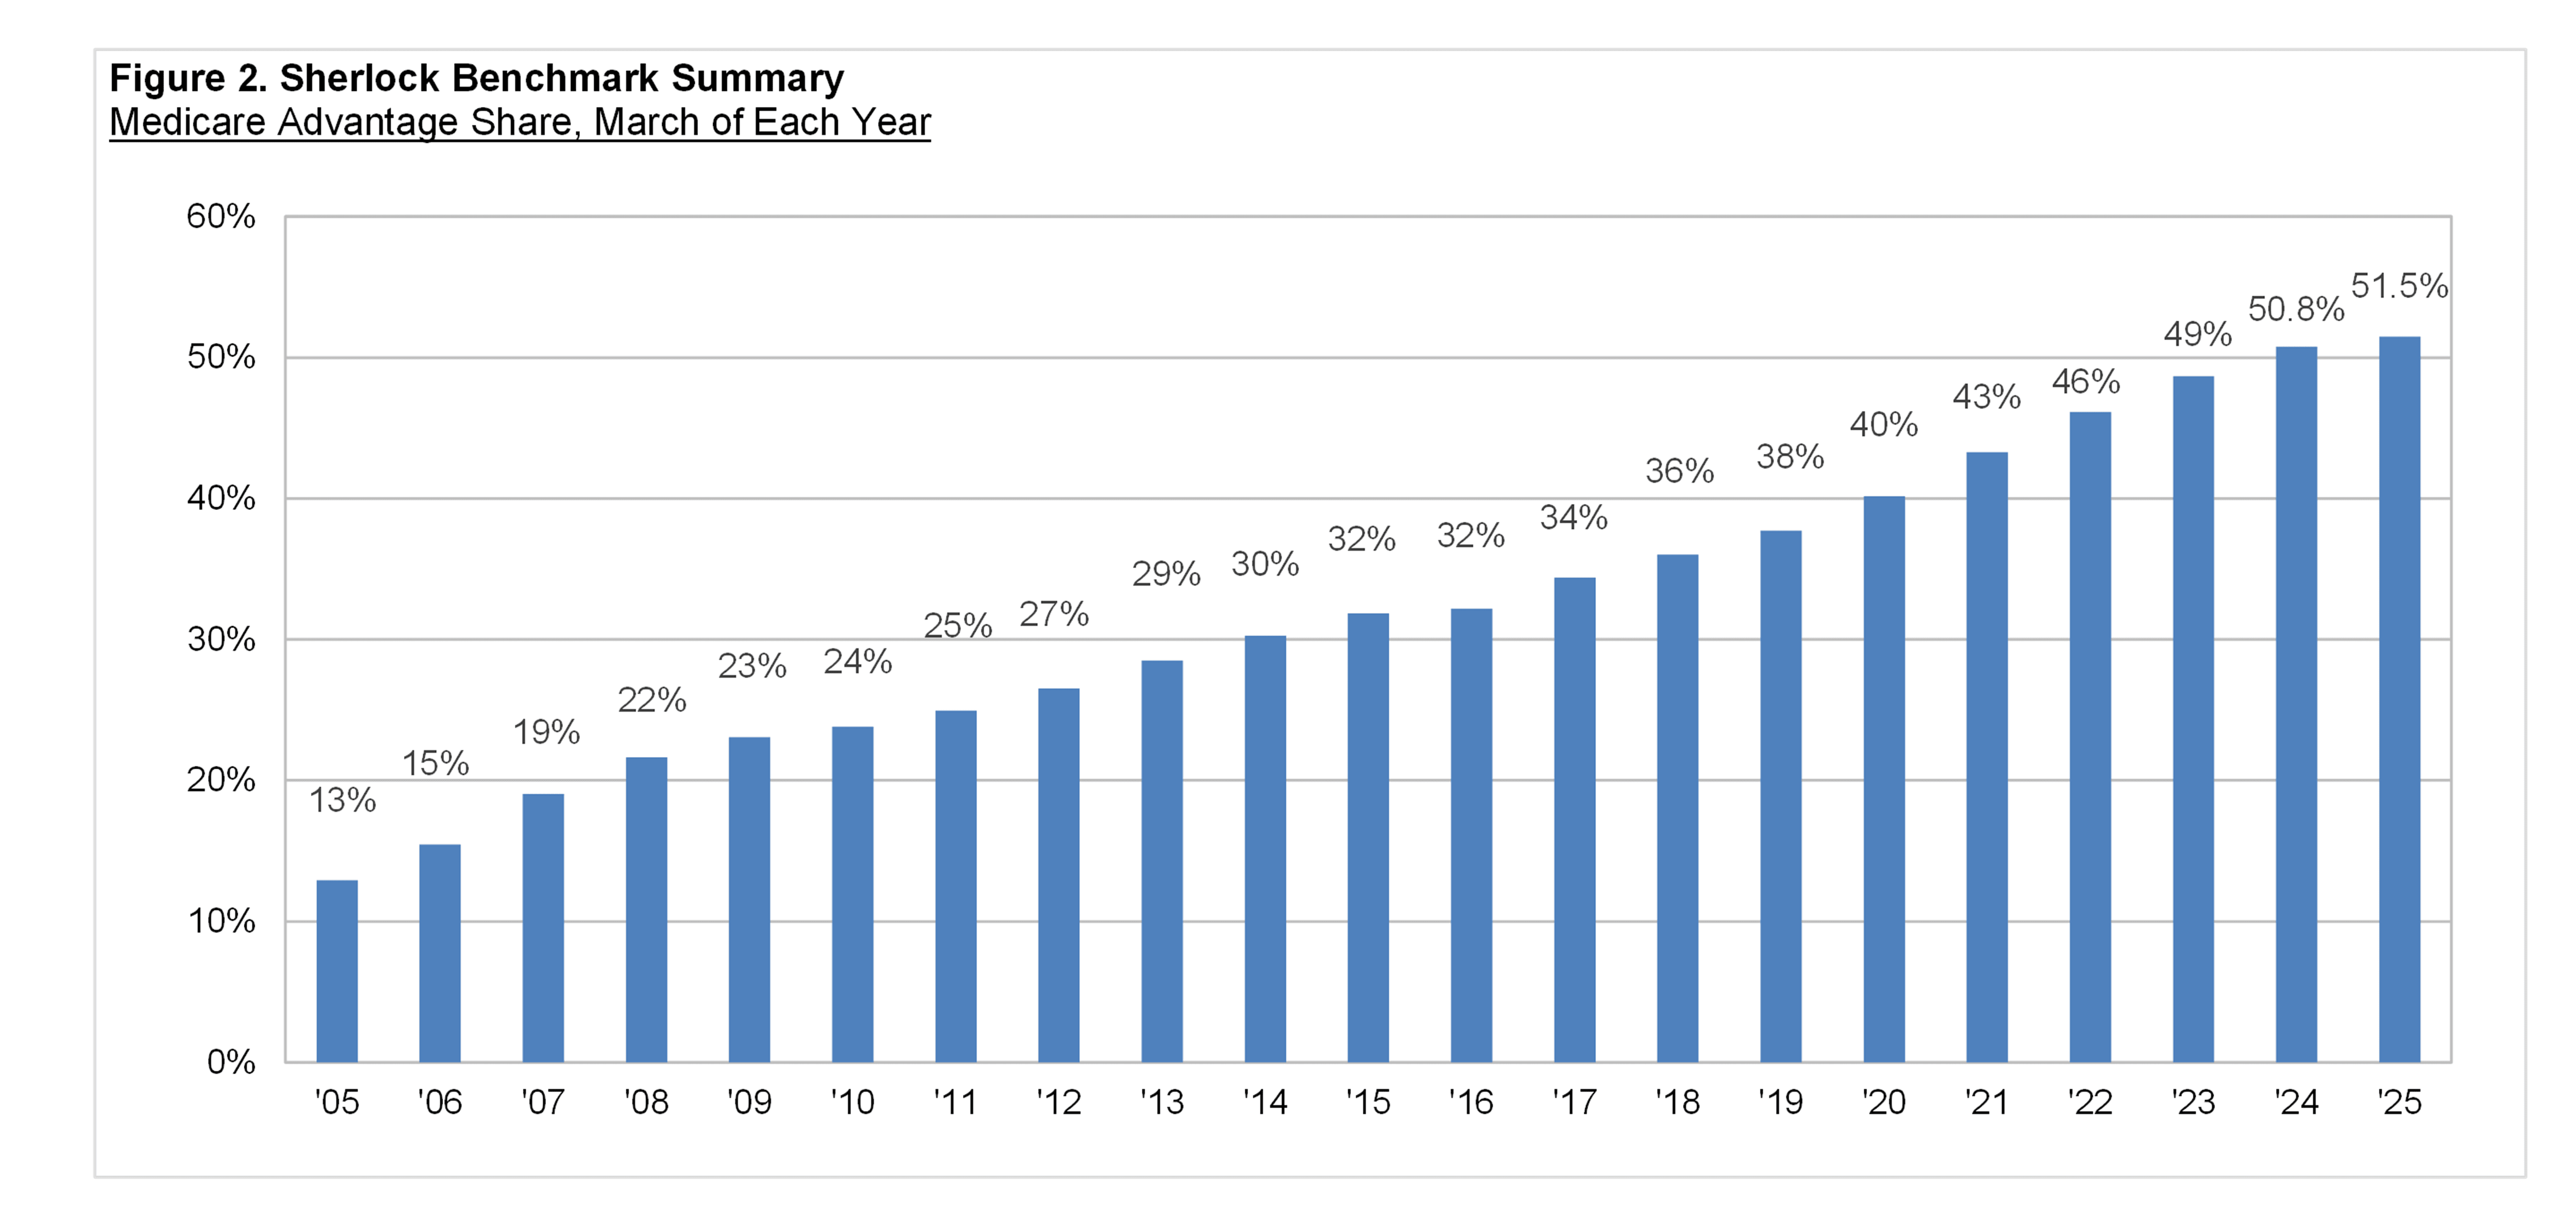
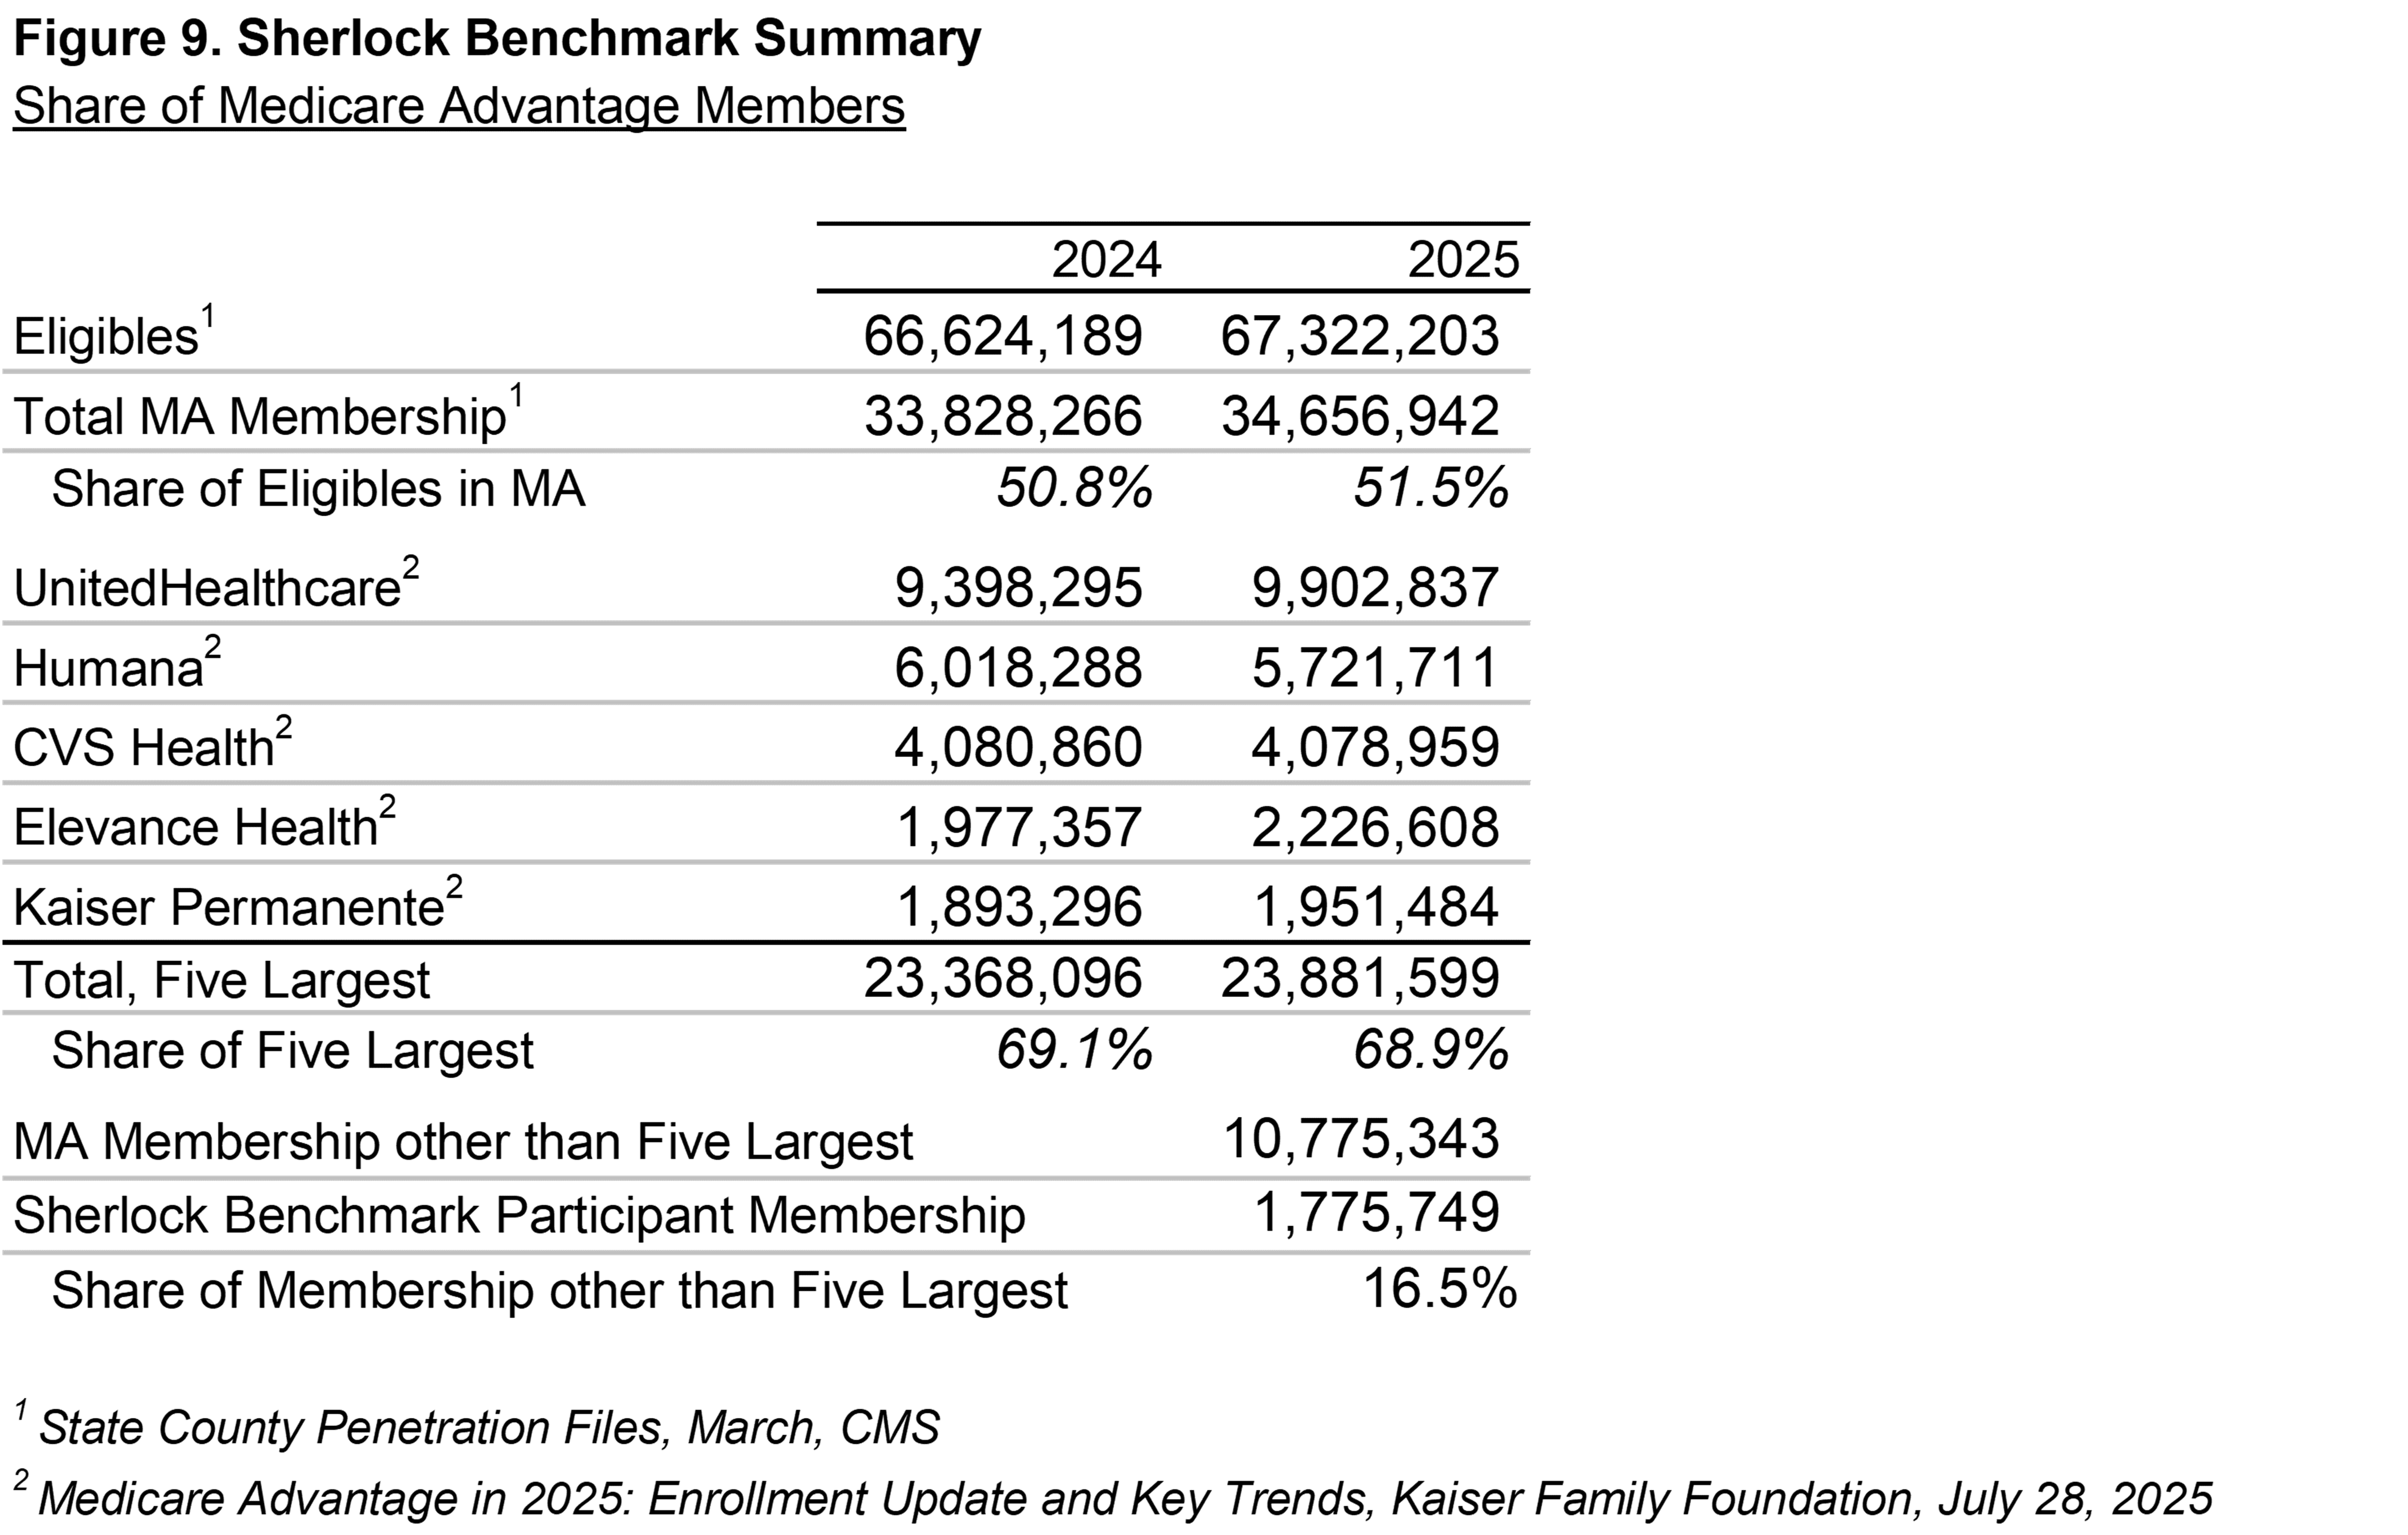
Medicare Advantage ("MA") is chosen by an increasing proportion of beneficiaries to replace regular FFS Medicare. MA supplanted FFS Medicare for 56.0% of beneficiaries in March 2025, the most recent period with published benchmarking data, versus 54.5% in the year-earlier period.
In March 2024, Medicare Advantage achieved a major milestone with the majority of Medicare beneficiaries choosing Medicare Advantage. As a point of reference, only one-quarter enrolled in Medicare Advantage plans in 2010.
Membership in the traditional Fee-For-Service ("FFS") program decreased by 0.4% during that March-ended year, versus the 5.4% increase for Medicare Advantage.
Taking the longer view, the total number of Medicare beneficiaries in 2025 increased by 24.0 million since 2005. Of those, 21.9 million chose Medicare Advantage, accounting for 91% of the growth.
Lanlan Xu, et al., traced this movement towards Medicare Advantage in a Health Affairs article published in September 2024.
Kaiser Family Foundation (January 30, 2024) believes several factors contributed to the growth in MA, including:
- Supplemental benefits in MA such as dental, vision, gym memberships, and Over-the-Counter allowance cards.
- Popularity of Zero Premium MA plans.
- MA offers annual out-of-pocket limits, while FFS does not have a cap.
- Broker commissions' structure that incentivizes MA over products complementary to FFS such as Medicare Supplement and Stand-Alone Part D.
- Employers providing retiree health benefits that increasingly emphasize MA plans.
The Lanlan Xu article also finds that "Healthier beneficiaries with no HCC diagnostic codes had modestly higher odds of choosing MA over FFS compared with less healthy beneficiaries."
Revenue Pressures
The KFF article also observed that the Medicare Payment Advisory Commission (MedPAC) made a change in its estimation methodology for its work on MA Overpayments.
According to MedPAC's March 2025 Report to the Congress: Medicare Payment Policy,
"We estimate that, because of differences between MA and FFS in coding intensity and (favorable) selection, Medicare spending on MA enrollees was about 22 percent higher in 2024 than spending would have been had those beneficiaries been in FFS."
MedPAC's estimation is intended to capture the degree to which "risk-standardized spending of MA enrollees would be lower than spending for beneficiaries remaining in FFS Medicare."
Health Benefit Cost Pressures
At the same time, many Medicare plans have reported elevated medical expenses for 2024. Humana reported that during its fourth quarter 2024 earnings call, "Our core Individual MA membership has stabilized, as demonstrated by our first time lower attrition in several years and improving new member acquisition."
Similarly, during its 2025 first quarter earnings call, UnitedHealth Group stated that it experienced an unexpected spike in inpatient care costs during the final quarter of 2024, a similar experience to those of other Medicare Advantage carriers.
For the participating plans in the Medicare universe of the Sherlock Benchmarks, the average health benefit ratio increased from 84.6% in 2023 to 87.9% in 2024, while gross margins as a percent of premiums compressed from 10.5% to 8.0%.
Reflective of the gross margin compression, CMS observed on September 26th that "the total number of available MA plans in 2025 declined, following two years of growth. There are now 3,832 MA plans nationwide in 2025, 500 fewer than 2024, a decrease of 12 percent."
Administrative Expense Trends
Revenue and health care cost trend pressures highlight the importance of Medicare plan administrative cost management.
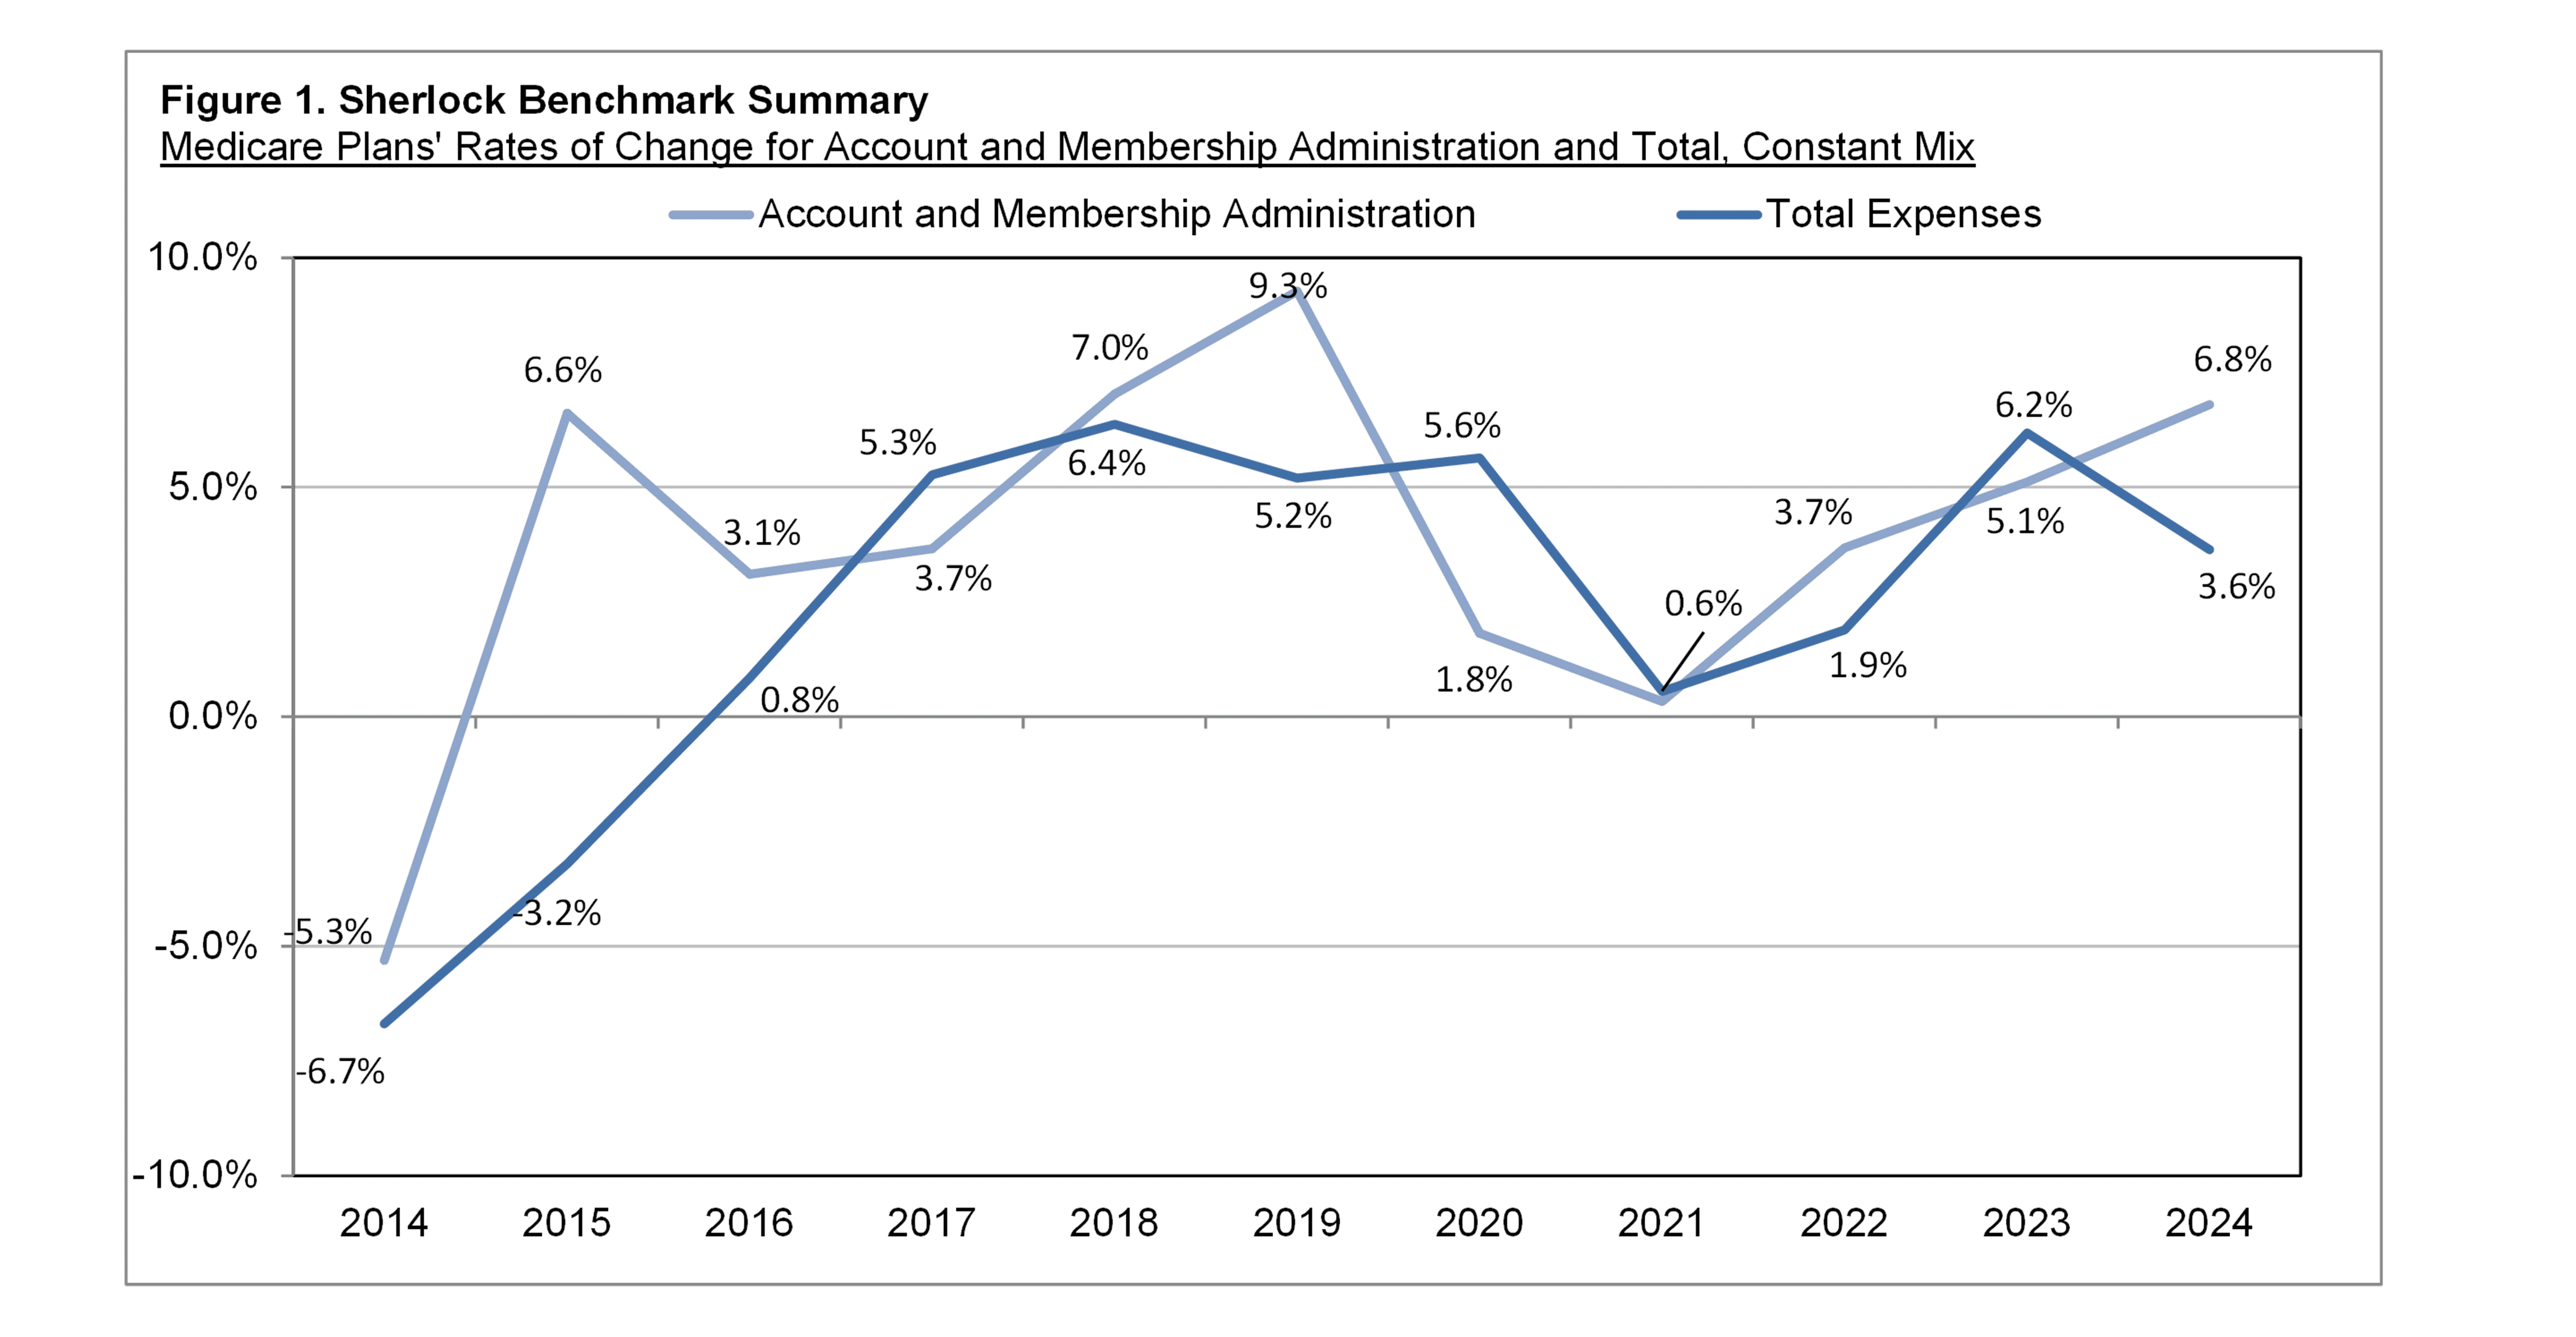
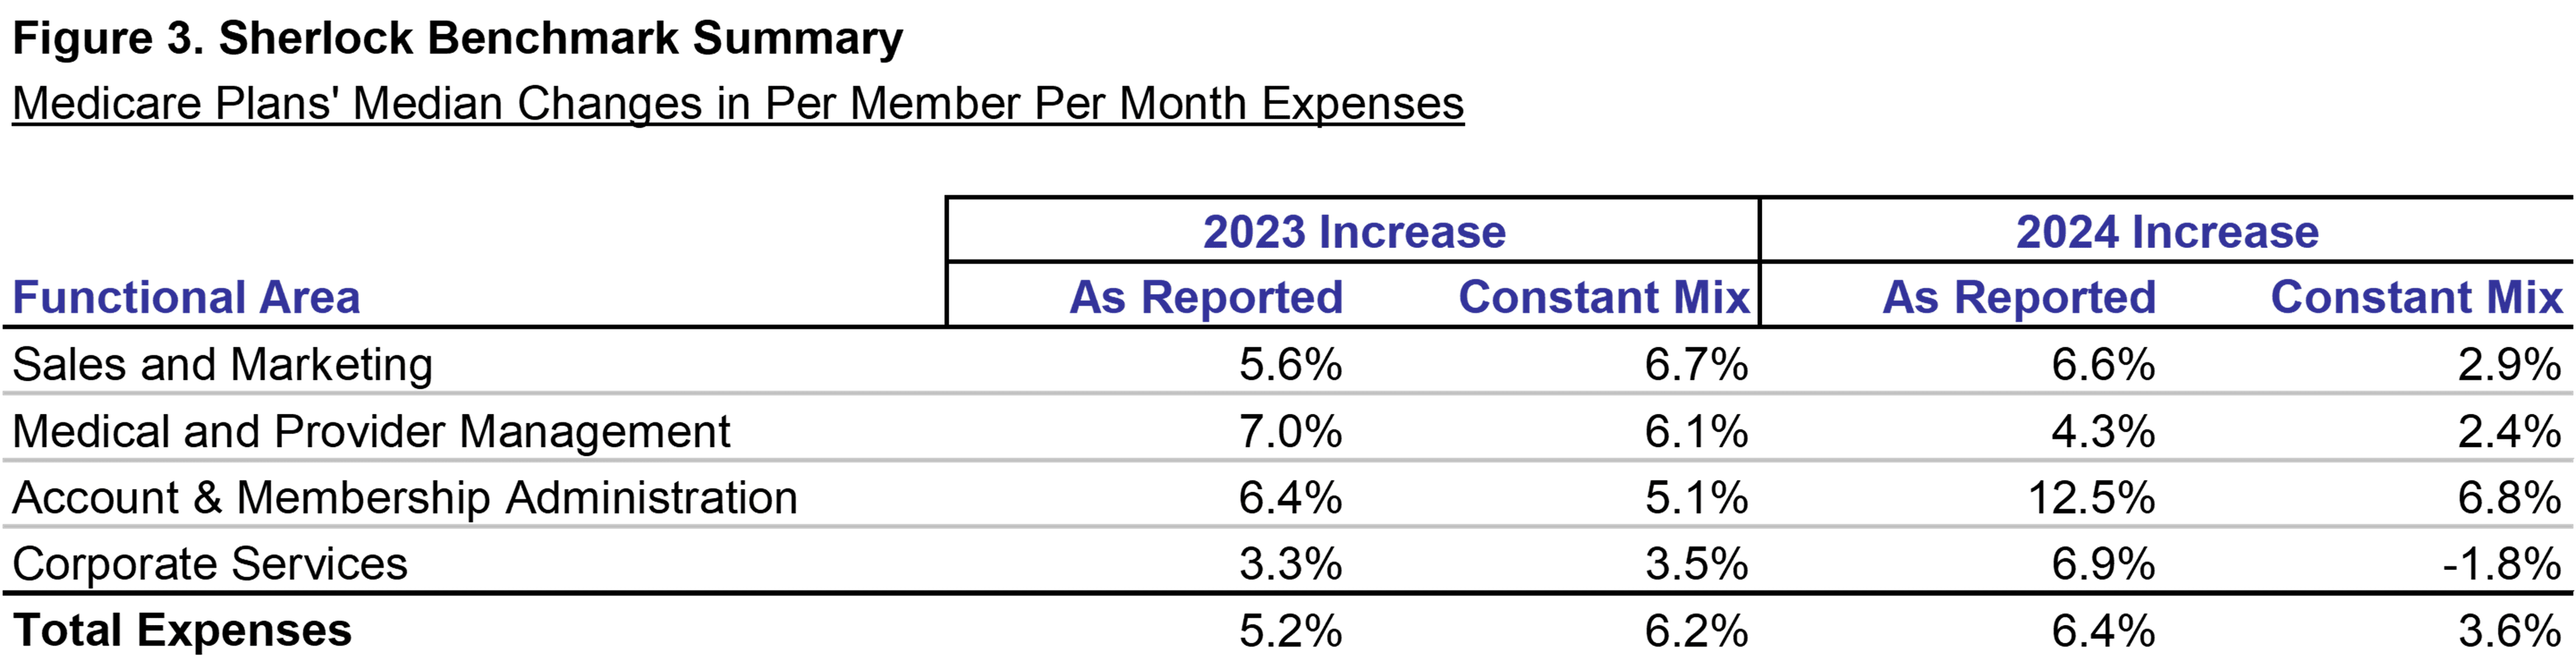
Figure 3 shows year-over-year trends on both an as-reported and constant-mix basis.
When the effect of mix changes is excluded, for the nine continuously participating plans, per member costs grew by 3.6% from 2023 to 2024.
Cost trends on an as-reported basis indicated a shift towards higher cost products: growth in lower cost Medicaid was sharply negative while Medicare as a whole was positive.
Membership in higher cost Medicare increased by a median rate of 4%. Medicare Advantage also grew by a median of 4%, while Medicare SNP was up 10% on a median basis.
Lower cost Medicaid fell sharply by a median of 14%, primarily due to the resumption of Medicaid redeterminations. CHIP member counts also fell by a median of 14%.
Commercial as a whole was flat on a median basis, but up by 7% on average. Commercial Insured fell by a median of 3% (but up by 7% on an average basis), while Commercial ASO increased by 3% on a median basis.
Trends Holding Product Mix Constant
Trends that are free of the distortion of the impact of product mix changes are a more accurate representation of their underlying administrative cost trends.
Functions with the greatest cost increases, that is percent trends weighted by their dollar values, were Claims, External Broker Commissions, and Customer Services.
Account and Membership Administration
This cluster of expenses had a PMPM cost increase of 6.8% on higher Compensation per FTE and Non-Labor Costs per FTE. Four of its five functions increased, offset by a decline in Enrollment / Membership / Billing.
Customer Services was the fastest growing function in this cluster and overall. Compensation was responsible for this function's growth on higher Staffing Ratio and Compensation per FTE. The increase in staffing ratio could be attributable to a Medicare Advantage shift towards more expensive SNP products, consistent with the 10% median growth rate in that product.
Claims and Encounter Capture and Adjudication was the most important source of this cluster's growth. Expense growth was on higher Compensation per FTE and Non-Labor Costs per FTE offsetting a decline in Staffing Ratio.
Information Systems was up on higher Compensation per FTE. The IS sub-functions of Operations and Support Services and Applications Development posted the highest rates of growth.
Expenses for Enrollment / Membership / Billing decreased from the prior year, primarily on lower Staffing Ratio, and is attributed to a decline in Medicaid.
Sales and Marketing
The Sales and Marketing cluster's costs grew by 2.9% as Staffing Costs per FTE increased.
External Broker Commissions was the cluster's fastest and most important source of growth and the most important overall. We estimate that non-labor costs were the main contributors to this function's growth. Commission structures for some plans provide for lower rates as members age, and that factor was not fully offset by the net inflow of membership.
The Rating and Underwriting function was the second fastest growing function in this cluster and followed in importance after External Broker Commissions.
Sales expenses increased at a low single digit rate. The sub-functions of Account Services and Other Sales were key drivers.
Marketing costs per member declined by less than 1%. The decline in Member and Group Communication more than offset the increase in Market Research / Customer Analytics.
Advertising and Promotion expenses posted the largest rate of change, falling at a rate in the low teens, chiefly on a lower staffing ratio.
Medical and Provider Management
The Medical and Provider Management cluster had a PMPM increase of 2.4% with higher Compensation per FTE being key. The majority of the functions posted increases.
Medical Management was up on Staffing Costs per FTE. Sub-functions that posted year-over-year growth were led by Medical Policy Development and Oversight, Disease Management, and Case Management.
Provider Network Management and Services declined at a low single-digit rate with lower Non-Labor Costs central to the decline.
Corporate Services
The Corporate Services cluster was the only cluster to decline, falling by 1.8%. The cluster's Medicare Staffing Ratio also declined.
While the median rate of change for Corporate Executive and Governance is a slight year-over-year increase, its average fell. Among the three participants whose expenses increased, two experienced increases in non-labor costs.
The Finance and Accounting function costs were lower by low a single digit rate due to reductions in Staffing Ratio and Non-Labor Costs.
Actuarial was higher at a high single digit rate. Meanwhile, Association Dues and Licensing Filing Fees was up at mid-single-digit rates.
As-Reported Trends
When a plan reports costs in sequential years, its per-member changes reflect both real changes and the effect of product mix variation.
The Corporate Services cluster experienced the largest variance between as-reported and constant-mix growth. The as-reported PMPM was 3.6% higher versus the constant-mix decrease of 1.8%.
Account and Membership cluster posted the largest increase on an as-reported basis, by 12.5% and compares to the constant-mix increase of 6.8%.
As previously noted, Account and Membership includes Pharmacy and Behavioral Health administration; administrative expenses for Pharmacy were the most affected by mix shifts.
Sales and Marketing as-reported PMPM costs grew by 6.6% and compares to the constant-mix increase of 2.9%. Marketing flipped from a decline to a positive growth on an as-reported basis. This cluster was heavily affected by mix changes because of the shift from lower cost Medicaid to other products.
Medical and Provider Management cluster grew at a faster rate on an as-reported basis, 4.3% versus the constant-mix increase of 2.4%.
Enterprise Cost Drivers
We think that it is helpful to understand enterprise expenses by their cost drivers. PMPM costs can be thought of as the product of Staffing Ratio times Staffing Costs per FTE, plus Non-Labor Costs per member.
The median compensation per FTE was approximately $113,000, 8.6% higher than last year's median. Compensation in 11 of the 14 functions increased from last year.
Medicare Advantage median staffing ratios were lower than last year. The median was 61 FTEs per 10,000 Medicare Advantage equivalents, down from 64 FTEs last year.
Of the 14 functional areas with staff, ten were lower than last year. Advertising and Promotion and Actuarial posted the greatest reductions in staffing ratios.
Median Non-Labor Costs per FTE were higher than last year among continuous plans, approximately $113,000 per FTE, up 11.6%.
We draw a distinction between non-labor and outsourcing activities in that the latter engages a vendor to supply services to supplement or supplant staffed activities.
Overall propensity to outsource was lower, to 10.8% of the total FTEs from 11.4% last year. Only one of the fourteen functions had a higher propensity to use outsourcing.
Costs of Medicare-focused Plans, by Cluster, PMPM
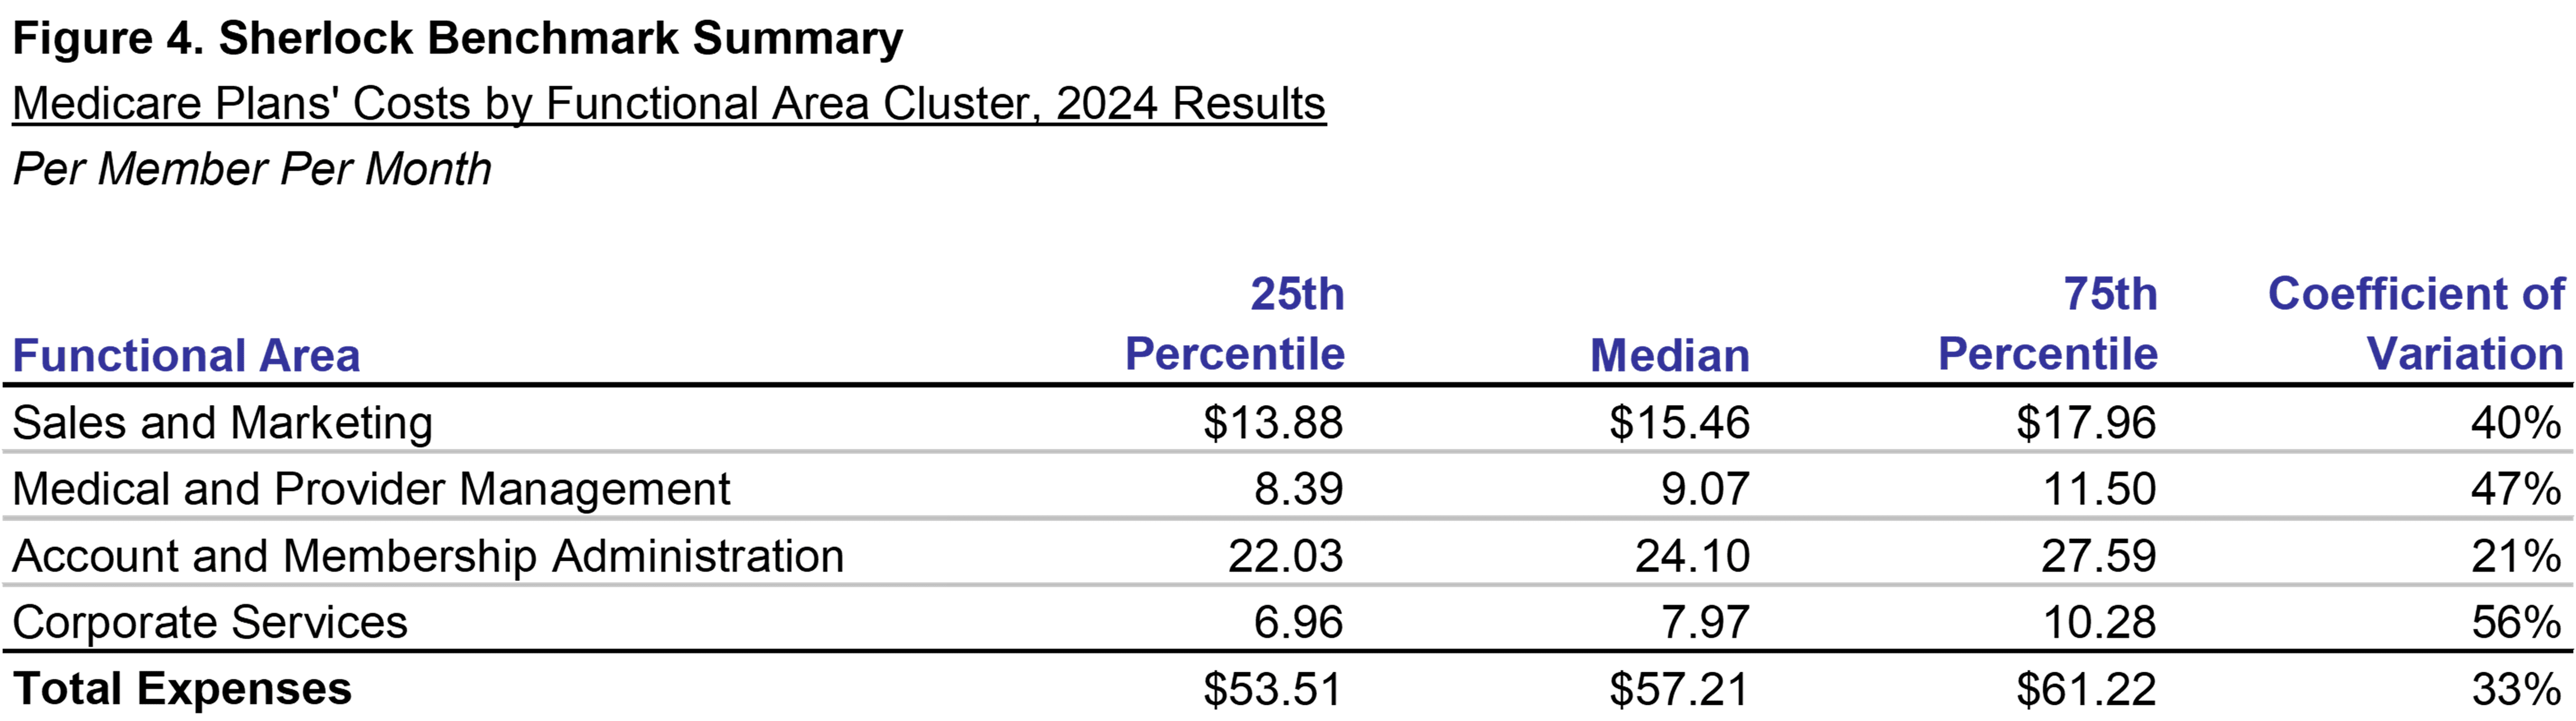
Figure 4 shows the values of administrative expense clusters for all 11 participating Medicare-focused plans. In this section, we shift our attention from the nine continuously participating plans to the entire universe of eleven plans.
The comparability limitations are that this universe of Medicare-focused plans differs from that of last year in composition, so the comments relating to last year's values are directional.
The product mix for all eleven plans in 2024 differed from the prior year's plans. There was more focus on Medicare Advantage and SNP and less focus on Medicaid.
The median total PMPM administrative expenses are $57.21, 8.9% higher than last year, shown in Appendix A. In comparison, the constant-mix continuous plans' costs increased by 3.6%.
The Sales and Marketing cluster was higher by 12.1% to a median $15.46, while up by 2.9% on a constant mix basis. The Corporate Services cluster was lower by 5.7%, a reversal from the increase of 1.8% on a constant mix basis.
The dispersion of expenses in 2024 was lower than in 2023. The Coefficient of Variation declined by 18 percentage points from 41% to 23%.
However, dispersion measured as the difference between 75th and 25th percentiles increased for 2024. In total, this metric increased by $6 PMPM to $26 PMPM.
Costs of Medicare-focused Plans, PMPM by Product
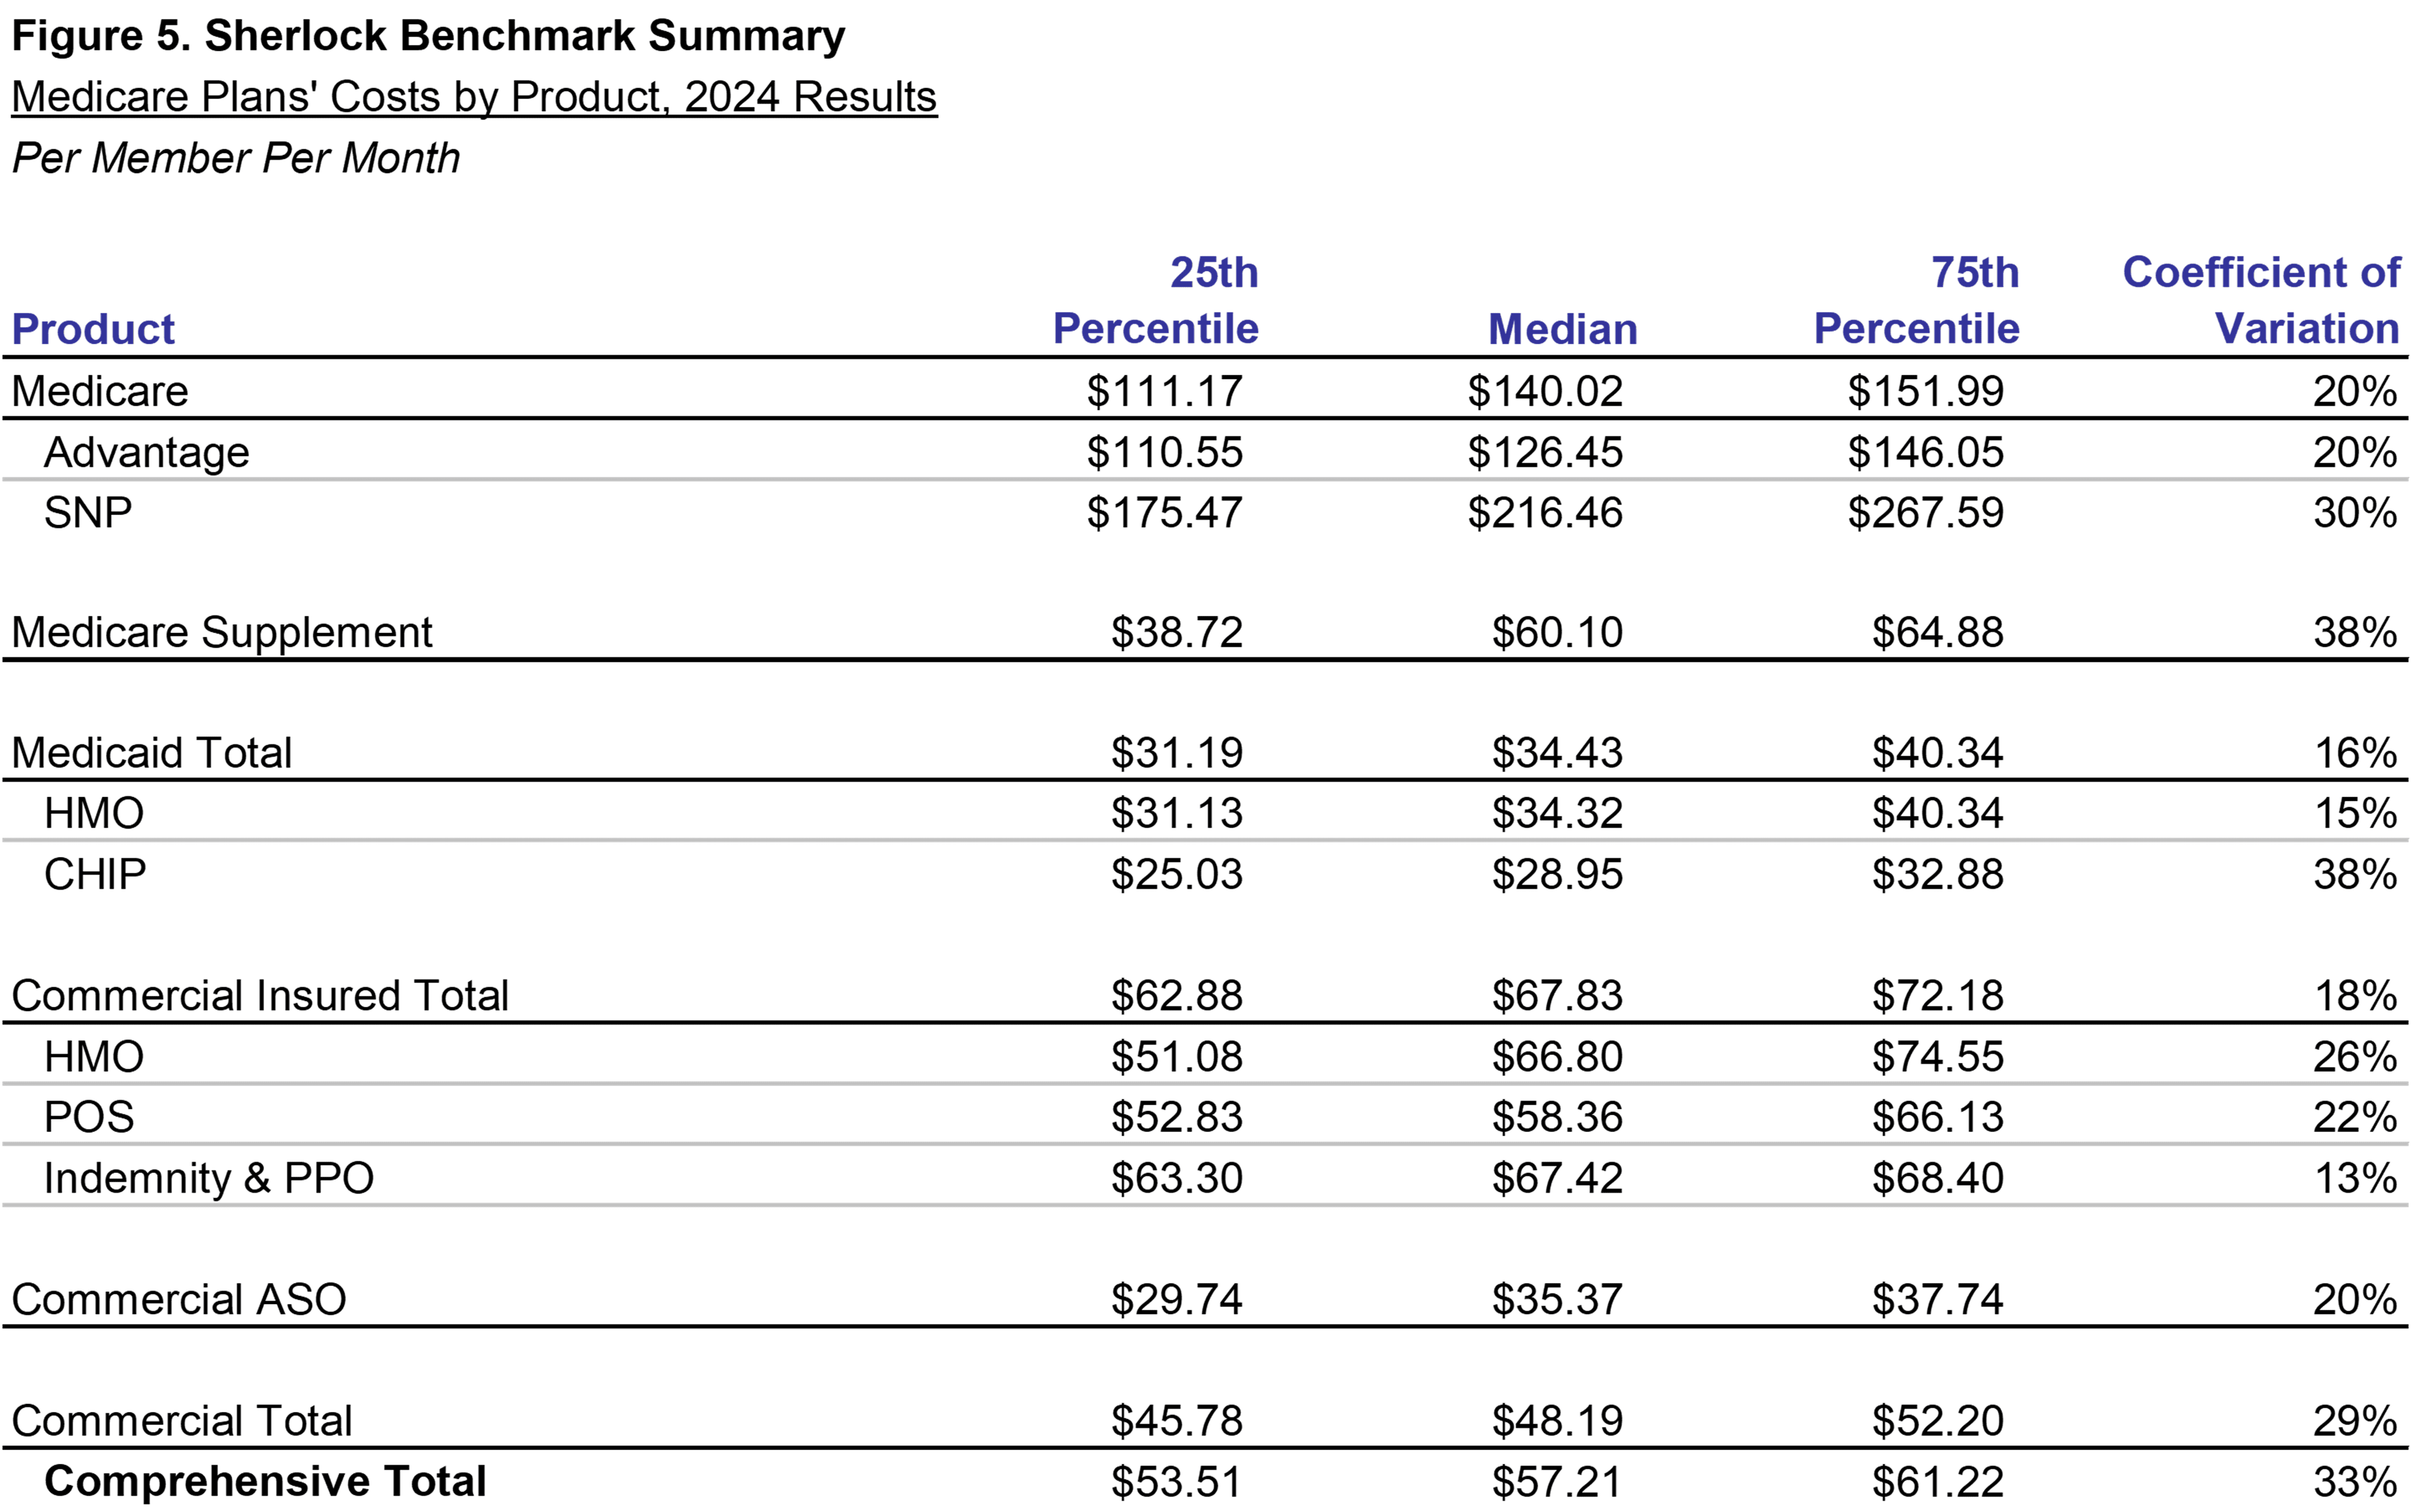
The importance of considering each product's costs in assessing performance is shown in Figure 5. The products vary greatly in their PMPM administration costs.
An example of the effect of mix is found in Figure 3. When comparing identical plans' cost trends in 2024, when they are reporting as-reported values, trends are 5.8%, but on a constant-mix basis, trends are 3.6%.
For the universe as a whole, Medicare products are relatively high cost at $126.45 and $216.46 PMPM for Medicare Advantage and Medicare SNP, respectively.
The high administrative costs for these products reflect the high health care needs of the population that they serve: members are on average older and require more care coordination and medical management.
The median PMPM administration for the Medicare Supplement product was $60.10 and was offered by nine of the plans. The median members covered under this supplemental product was 23% of each plan's Medicare Advantage membership.
Medicaid products, serving primarily qualified low-income beneficiaries, are generally the lowest cost to administer Comprehensive product offerings at $46.94 PMPM (excluding the higher cost Medicaid MLTSS product).
The mean mix of Commercial Insured products among Medicare plans in our universe was 30% of the membership and 37% of revenues. The Commercial HMO Insured PMPM was $62.56, near the median of all products.
Commercial ASO products represented a mean of 31% of Comprehensive members and 3% of revenues. While Insured Commercial has a relatively low PMPM, ASO is even lower at $18.66. But on a percent of premium basis, ASO has a higher relative cost.
Two of the continuously participating plans offered Medicaid Managed Long Term Services and Supports (MLTSS). These products have exceptionally high PMPM costs.
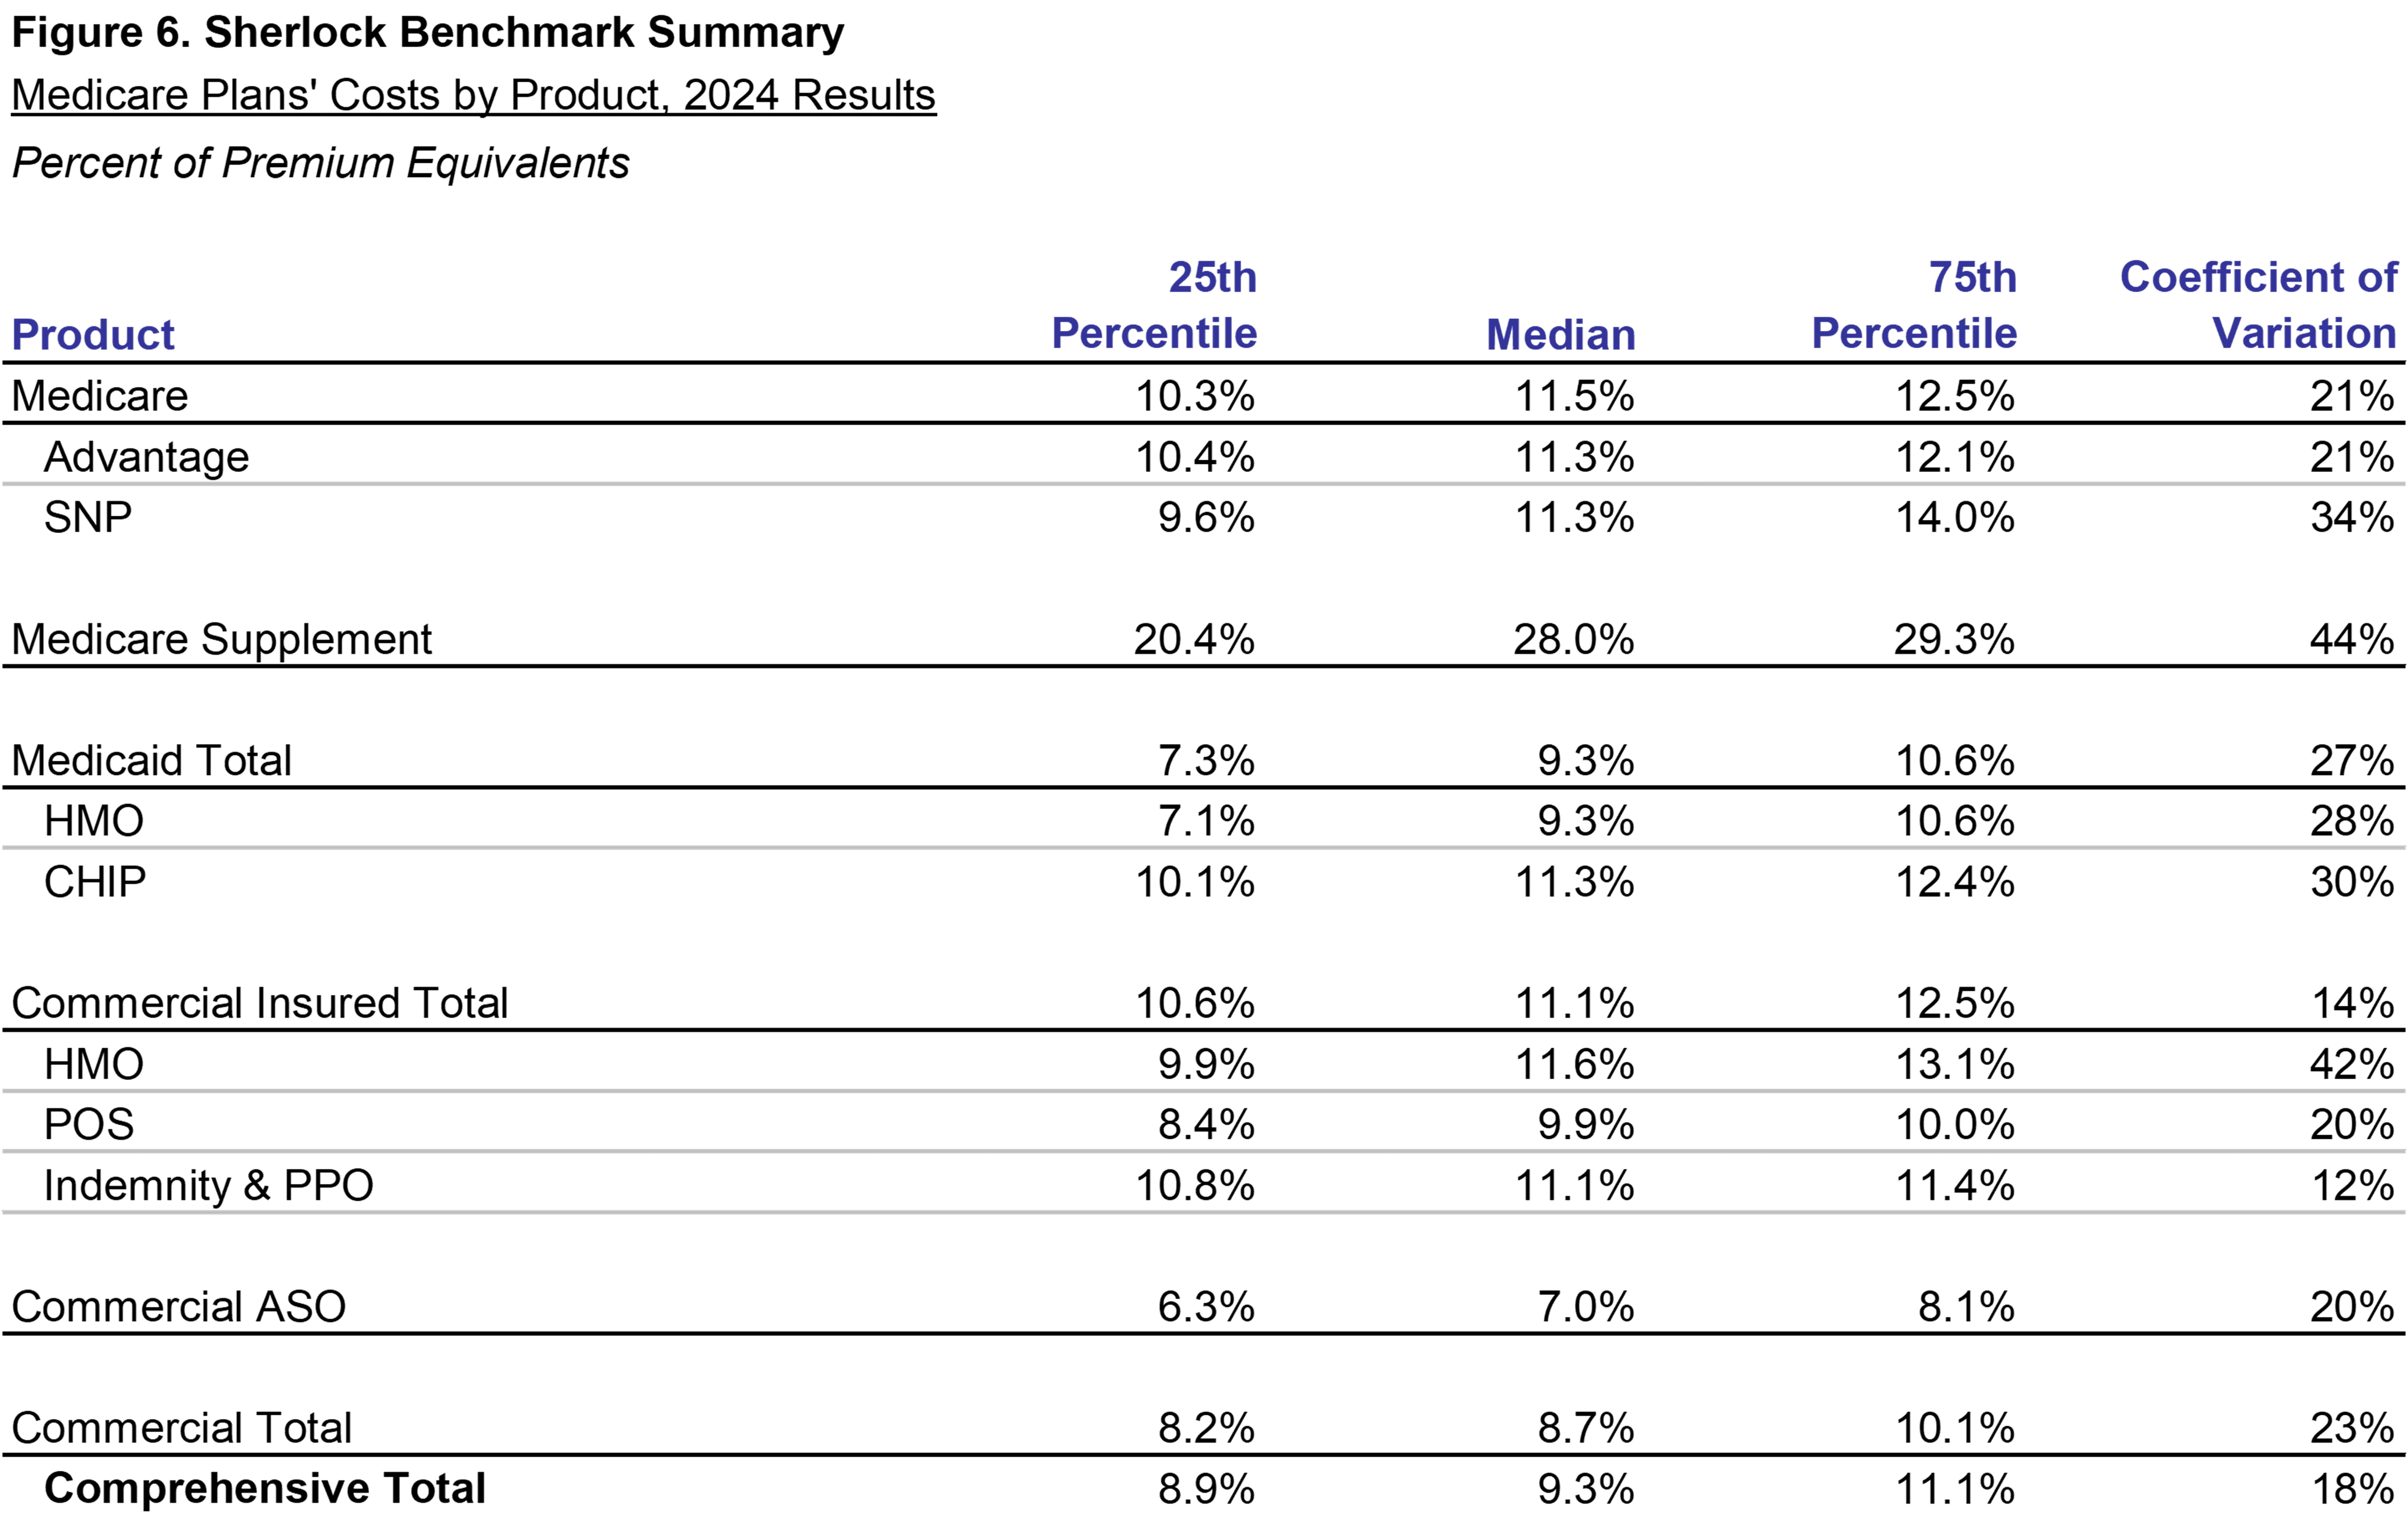
Costs of Medicare-focused Plans, Percent of Premiums by Product
When analyzing administrative expenses by percent of premiums, most of the differences diminished between the products except for the high cost Medicare Supplement, ASO, and Medicaid MLTSS.
Medicare SNP costs, which incurs over three times the PMPM costs of Commercial HMO Insured, is 11.3% of premiums, lower than Commercial's 13.0%.
Medicare Advantage costs, while almost twice as high as Commercial HMO Insured PMPM, is 11.3% of premiums, lower than Commercial's 13.0%.
Medicaid HMO was below average in PMPM costs and was, at 9.3%, equal to the median in percent of premiums. Sales and Marketing costs for Medicaid products are generally lower while Corporate Service cluster costs are higher.
The administrative expenses of Commercial ASO products are 7.0% of premium equivalents. It also operates at low costs PMPM, as shown in Figure 5.
While Medicare Supplement is higher than average cost when measured PMPM, at 28.0%, its cost ratio was the highest among products.
By contrast, Medicare Supplement and CHIP health care needs are more modest leading to a higher relative percents than relatively low PMPMs.
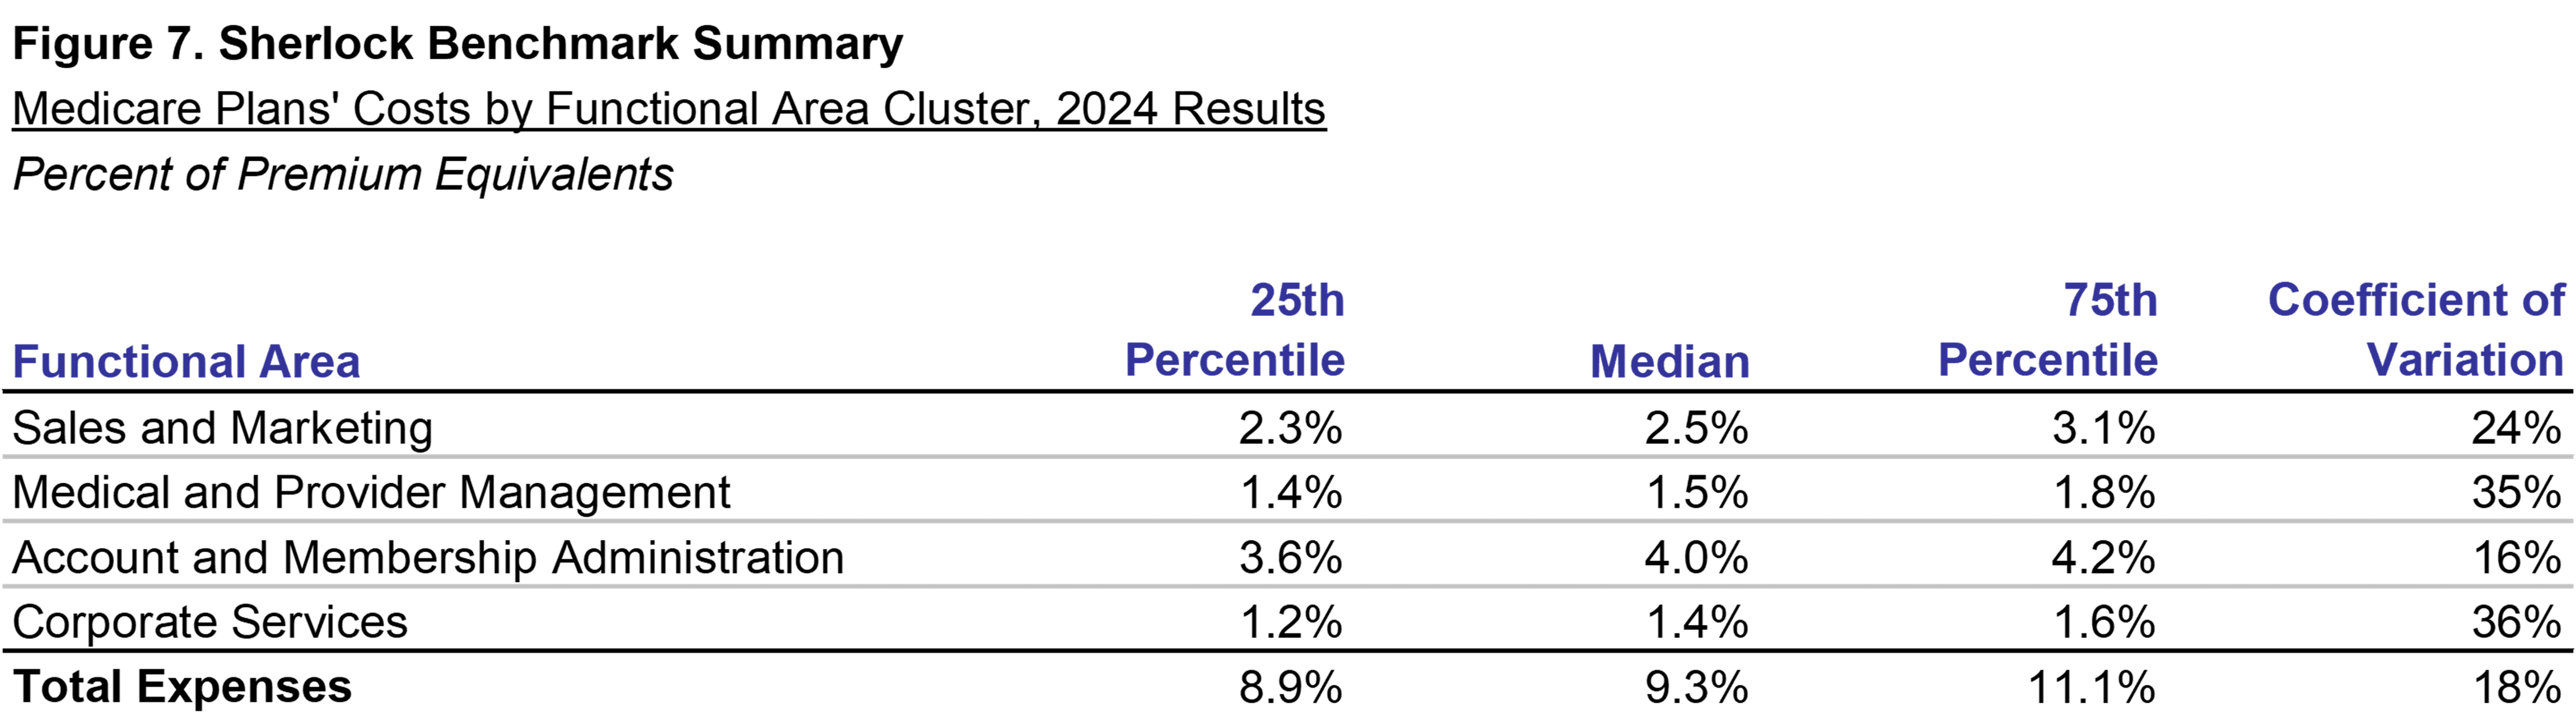
Costs of Medicare-focused Plans, Expense Clusters as Percent of Premium
Figure 7 shows the ratios of administrative expenses to premiums or equivalents. Administrative expenses had a median of 9.2% of premiums.
Sales and Marketing and Corporate Services Cluster were relatively unchanged at 2.5% and 1.4%, respectively. Account and Membership Administration as a cluster was at 3.4%, up from 3.1% last year and Medical and Provider Management was 1.9% up from 1.8%.
Dispersion, measured by the Coefficient of Variation, declined while the differences between 25th and 75th percentiles increased.
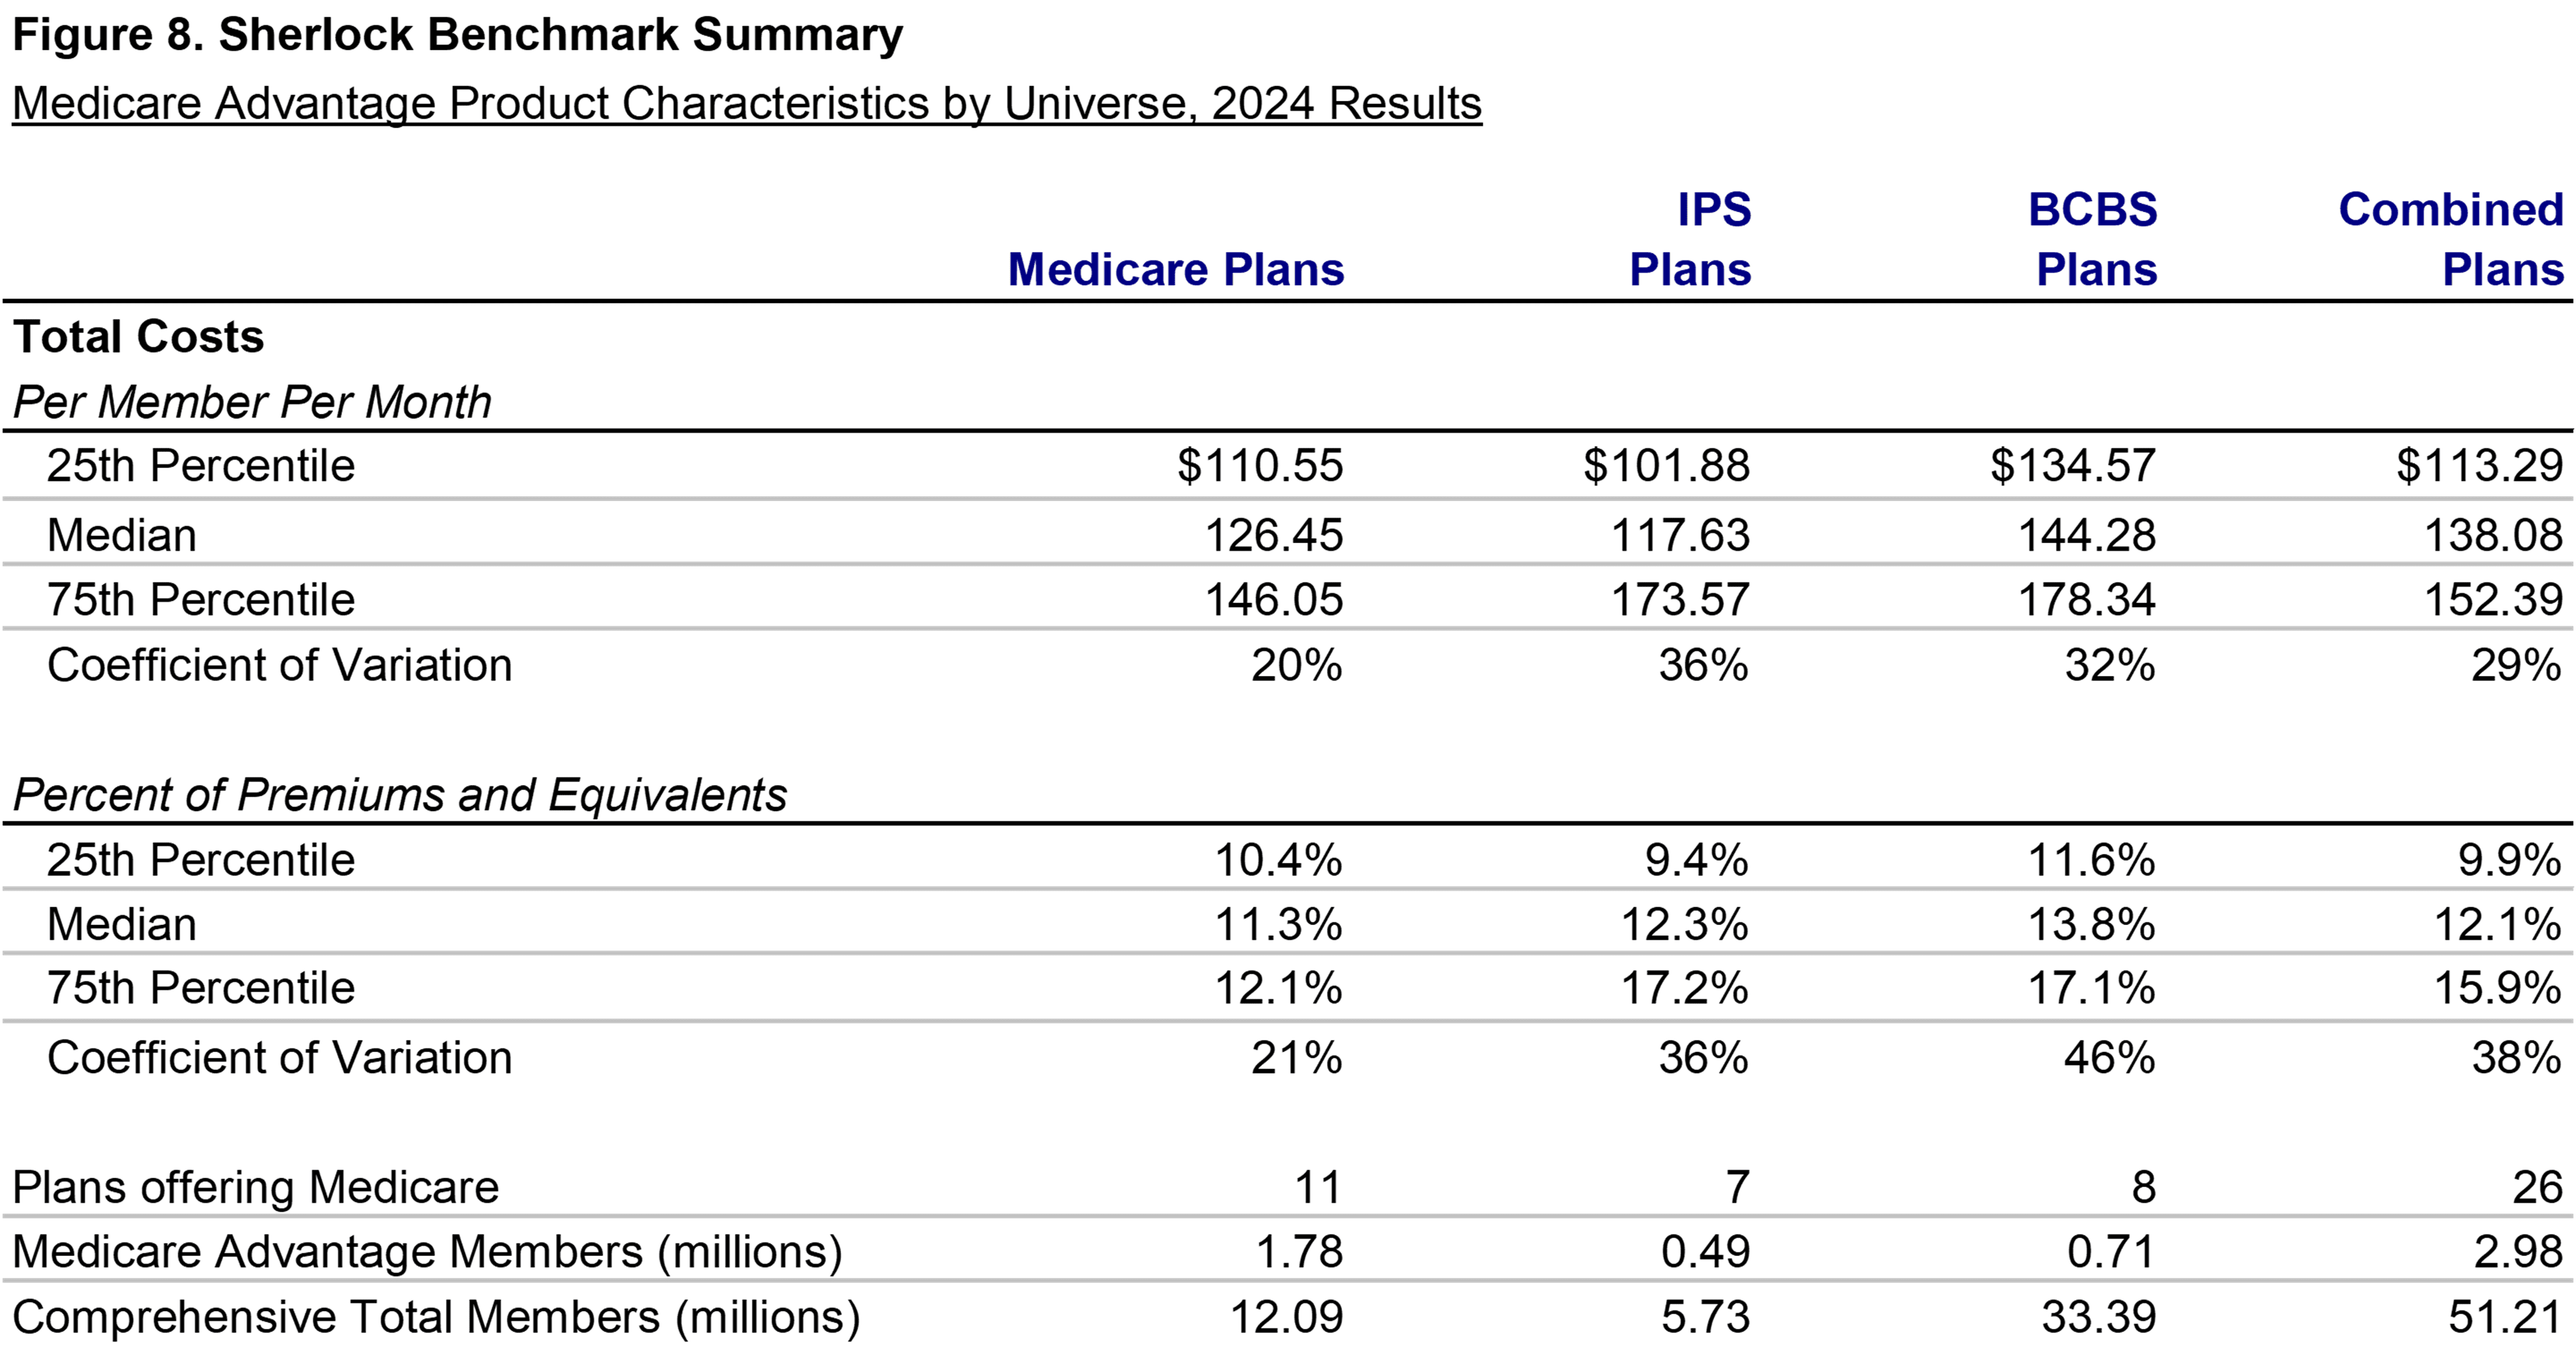
Comparisons Across Universes
Health plans in other Sherlock Benchmark universes also offer Medicare products. In this section, we compare the results of the Medicare universe to those of other universes.
Since the cost definitions and activities are the same, it is possible to directly compare the Medicare Advantage universe values to the those of the BCBS Plan universe and to compare them to the Independent / Provider-Sponsored universe.
The advantage was ambiguous when compared to the Independent / Provider - Sponsored plans. The Medicare plans were higher than IPS plans in Account and Membership Administration expenses while IPS plans were higher in Sales and Marketing and Medical and Provider Management.
Most of the plans in our set of Medicare focused plans are drawn from IPS and BCBS universe but were selected based on their strategic focus on Medicare.
Methodology
This analysis is based on the twenty-second annual edition of our performance benchmarks for Medicare-focused health plans. The Sherlock Benchmarks (Sherlock Expense Evaluation Report or SEER) represent the cumulative experience of over 1,000 plan-years beginning in 1997.
Each peer group in the Sherlock Benchmarks is established to be relatively uniform. So, within that constraint, it is optimal to have ten or more participants in a universe.
The average plan participating in the Medicare Sherlock Benchmarks this year served 1.1 million people and the median membership was 0.9 million.
Health plans included in the Medicare universe emphasized Medicare Advantage (including SNP), and collectively served 1.8 million members. In addition, they offered Medicare Supplement to an average of 10% of total revenues and 8% of membership, or 0.5 million members.
Medicaid products comprised an average of 14% of revenues and an average of 19% of membership, or 2.0 million members. In addition, they offered CHIP to 50,000 members, or 1% of membership and 0.4% of revenues.
An average of 41% of revenues and 70% of membership was commercial, or 7.9 million. Approximately 4.6 million of the commercial membership was insured while 3.3 million was ASO.
The Sherlock Benchmarks universe of Medicare plans is remarkable because of the high national concentration of Medicare Advantage. The 11 Medicare-focused participating plans collectively served 3% of national Medicare Advantage membership.
Reporting Conventions
We employ a number of conventions to make the metrics most beneficial for the audience of Plan Management Navigator.
The trends reported in this analysis are median changes, and when we refer to PMPM or percent of premium ratios, these too are medians.
References to growth rates hold the universe constant in the comparison years unless otherwise noted. Rates of change identified in this report exclude product mix changes unless explicitly noted. This change exclusion enables useful comparisons to changes experienced by continuous plans.
Percent of premium ratios are calculated on a premium-equivalent basis. That is, in the case of ASO arrangements, we build up a premium equivalent based on health care costs, administrative costs and margins.
Expenses exclude capital costs and investment income. We specifically exclude interest and similar debt capital costs and depreciation / amortization. Instead, we report Information Technology capital costs as amortized over the expected benefits period.
Participants in and licensees of the Sherlock Benchmarks will note that the values for Account and Membership Administration and Medical and Provider Management include the allocation of Pharmacy and Behavioral Health staff and expenses to the functions that they support within the Comprehensive products.
Medicare Part D is not discussed, but there were four plans that offered this product. In other universes, 64% of Blue Plans and 56% of IPS plans had non-trivial Part D activity.
Miscellaneous Business Taxes are a special case among administrative expenses since, short of recapitalization or elimination of tax-advantaged status (as applicable under BCBS Act of 1986), they are outside of management influence.