
Conclusions on Tactical Expenses
This is a very brief summary of our analysis of "Best-in-Class" Blue Cross Blue Shield (Blue) Plans compared with their Blue Peers. The complete document was provided to our participants. Our analysis is based on the 2025 edition of the Sherlock Benchmarks reflecting year-ended 2024 financials. The Sherlock Benchmarks for Blue Cross Blue Shield Plans is this universe's consecutive 27th annual edition.
Best-in-Class Plans had Tactical expenses that were lower by $8.40 PMPM, or lower by 25%. By "Tactical", we mean all health plan administrative costs for comprehensive products excluding Miscellaneous Business Taxes, the Sales and Marketing cluster of expenses and the Medical Management function.
Best-in-Class Plans had mean PMPM costs of $25.54 compared to $33.93 for the Peer Plans. The Best-in-Class Staffing Ratio was mainly responsible for the lower costs, at 14 FTEs per 10,000 members, compared to Peer Plans at 20. (Figure 1)
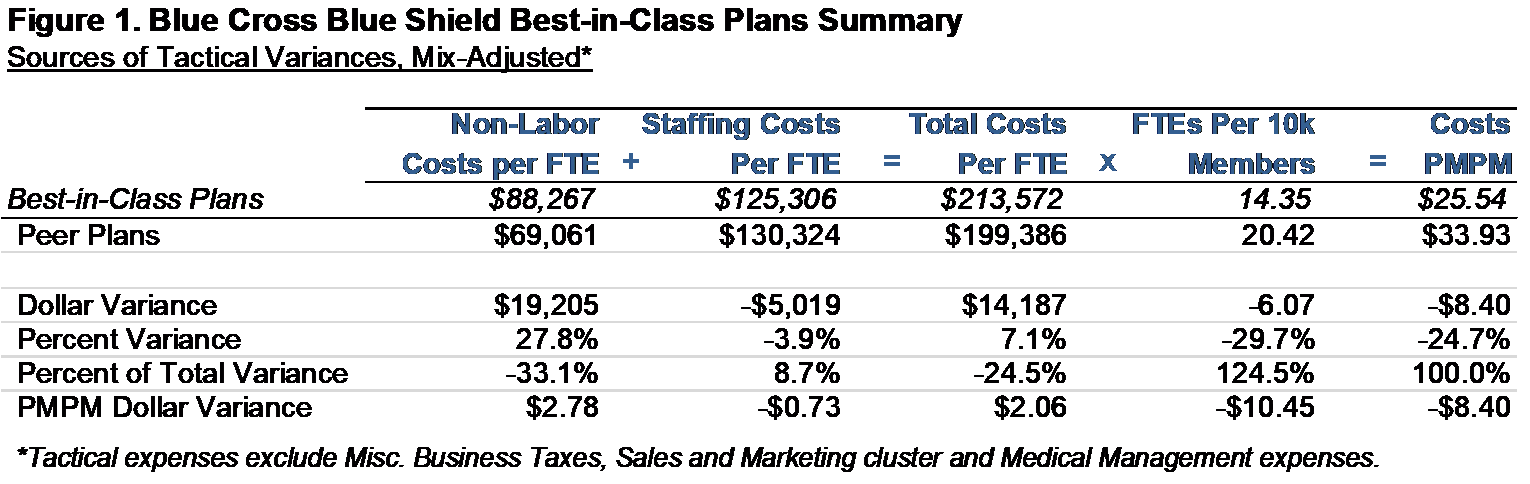
The Best-in-Class Staffing Costs per FTE were $125,000 versus $130,000 for the Peer Plans, lower by 4%. Non-Labor Costs (e.g., those found in Information Systems or Facilities) were approximately $88,000 per FTE for Best-in-Class Plans, which was 28% higher than those of the Peer Plans at $69,000.
It appears that Best-in-Class Plans operate in a culture of conservative administrative expenses since every cluster of Tactical expense was lower than its Peers. Also, almost every functional area was lower than those of the Peer Plans (Figure 2). Similar to previous years, the function contributing most to superior performance was Information Systems. The exceptions to this tendency was Claim and Encounter Capture and Adjudication and Corporate Executive & Governance, which were higher for the Best-in-Class Plans.
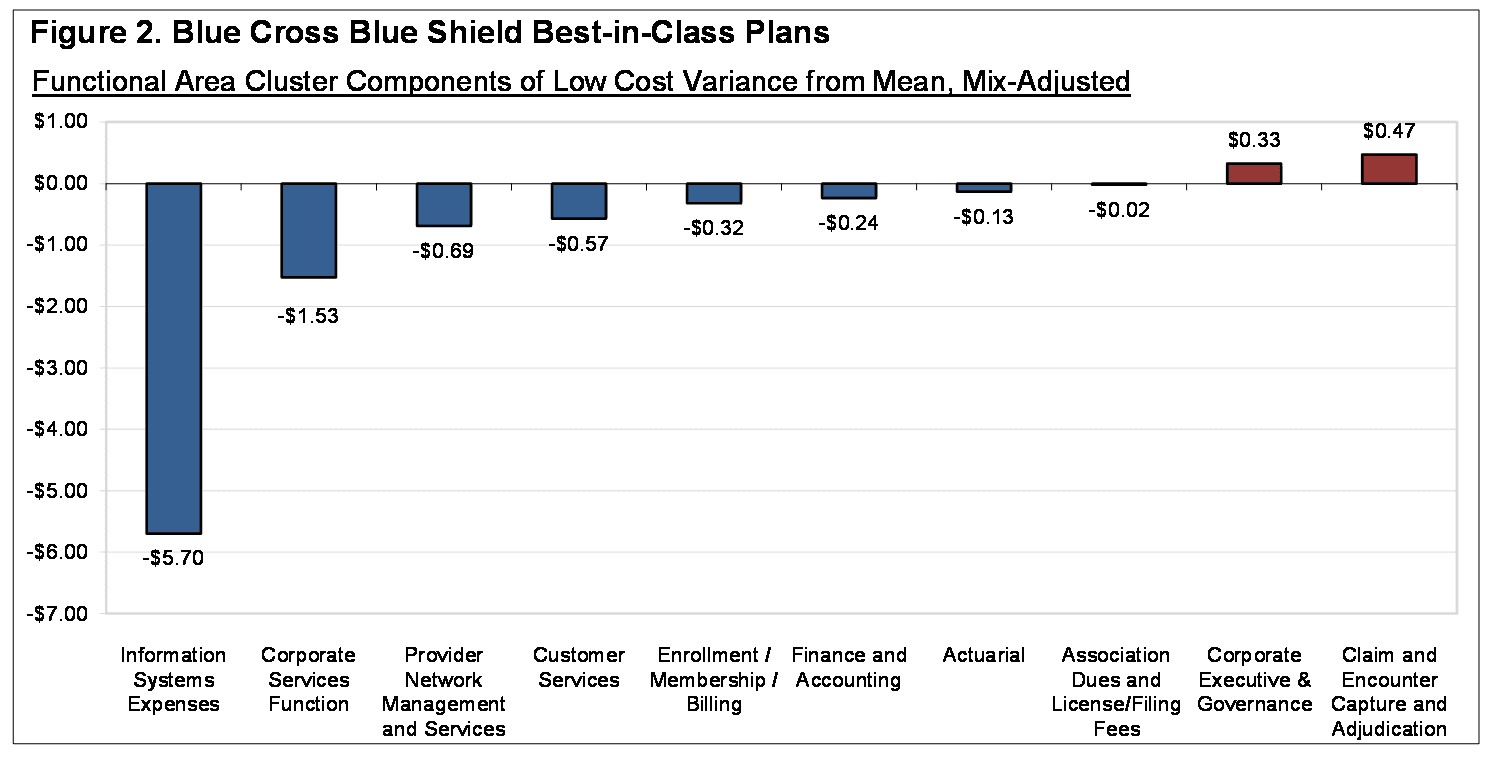
Low Information Systems cost was responsible for about 68% of the Tactical difference. Corporate Services Function, Provider Network Management and Services and Customer Services followed in their contribution to low Best-in-Class Tactical costs. These three functions comprised a further 33% of the difference between the two sets of Plans.
Strategic Expenses were Slightly Higher
Best-in-Class Plans had $0.05 PMPM higher Strategic expenses, the costs in the Sales and Marketing cluster and the Medical Management function.
The Sales and Marketing Cluster of expenses was higher for the Best-in-Class Plans by 6%. Rating and Underwriting and External Broker Commissions costs were higher for Best-in-Class Plans but Sales, Marketing, and Advertising and Promotion were lower.
Best-in-Class high Sales and Marketing costs may have affected membership growth. Comprehensive membership for Best-in-Class Plans grew by 2.2% on average, whereas Peer Plans declined by 2.2%. At the product-mix of the Best-in-Class Plans, the Peer Plans posted a mean membership decrease of 1.3%.
Medical Management expenses, on the other hand, were 11% lower for Best-in-Class Plans. Subfunctions of Disease Management, Quality Components, Medical Informatics, Utilization Review and Other Medical Management were lower.
Best-in-Class Plans had lower gross profit margins at a median of 9% versus 10% for the Peer Plans for insured products. (Insured products include Commercial Insured, Medicare Supplement, FEP, Medicare, and Medicaid. Gross profit margins are premiums less health benefits, all divided by premiums). The differences increased when reweighted at the mix of Best-in-Class Plans as Peer Plans' margins were 12%.
Possible Extraneous Characteristics
We considered five characteristics of the sets of Blue Plans that we thought could contribute to cost differences among Best-in-Class and Peer Plans, aside from shear performance. These included the effects of scale, cost of living, outsourcing, product mix, and strategic investments in Sales and Marketing and Medical Management.
Economies of Scale
Based on the results of Sherlock Company's 2025 Scale Study, 68% of Blue Cross Blue Shield Plans' Tactical administrative expenses were subject to economies of scale. The median size of the Best-in-Class plans was 184% larger than that of the Peer plans.
Using the regression lines used in the Economies of Scale analysis published in the late-October 2025 Plan Management Navigator, if the size of the Peer plans are adjusted to match the size of the Best-in-Class plans, would cause their cost advantage to fall by $5.34 PMPM or 64% of the total difference. This is an aggressive inference since, as shown in Figure 2 of that edition, only one function, Information Systems, had a coefficient of determination more than 50%.
Cost of Living
Cost of living is unlikely to have contributed to superior performance. The mean wage index for Best-in-Class Plans was lower than Peer Plans by 6%, but the median was higher by 2%. (We employ the Hospital Wage Index used by CMS).
Outsourcing Differences
The median rate of Outsourcing of Tactical FTEs was higher for Best-in-Class Plans, by 4.6 percentage points, while the mean rate was also higher by 6.1 percentage points.
Best-in-Class Plans' median was higher in the Corporate Services cluster by 9.8 percentage points and the median also higher in the Account and Membership Administration cluster by 5.6 percentage points. The median for Information Systems functional area was lower for Best-in-Class Plans by 1.8 percentage points but the mean was 4.6 percentage points higher.
Product Mix Differences
Our values were adjusted so that product mix did not impact comparisons: product mix was adjusted to eliminate its effect. We describe this method in the next section of this Navigator.
Strategic Investments
Finally, the strategic investments (Sales and Marketing and Medical Management) could not have affected comparisons because they were excluded from the central part of this analysis. We touched upon Strategic expenses previously; they were $0.05 higher for the Best-in-Class Plans.
Methodology
First, we separated Tactical from Strategic expenses in each Plans. "Tactical" costs are costs of Comprehensive products other than those in the Sales and Marketing cluster and Medical Management function, which we refer to as "Strategic. In making Strategic costs less of a focus of this analysis, we are recognizing that they have impacts outside of current period administrative costs. They may have costs most readily associated with longer-term objectives such increasing membership and market share and reducing health care costs.
We then ranked the plans to identify those whose expenses are Best-in-Class. We define "Best-in-Class" Plans as those whose Tactical costs are in the lowest 25th percentile. Plans not in the Best-in-Class subset are referred to as "Peer" Plans. To do this, we eliminate the potentially distorting effect of product mix differences on the cost comparisons. Since function costs are reported by product by the Plans, we compared each plan against its universe by reweighting the product costs in each function of the Blue universe to match the mix of each Plan. Plans were then ranked by the differences between their expenses and each of their re-weighted Blue universe costs. We selected the lowest cost Blue Plans as the 25% with the most favorable cost comparisons.
Because each of the Plans included in the dataset and in each of the subsets differ in product mix, we employed a composite approach to summarize the characteristics of each subset. To compare the two sets, we used the Best-in-Class product mix weighting.
After that reweighting, we then isolated and measure the specific contributing functional cost differences to overall Tactical performance. In this way, we identified differences in total, by cluster and by function.
Since Total Costs per FTE and PMPM costs together imply a mix-adjusted staffing ratio, we were also able to infer the effect of differences in staffing ratios on costs. Outsourced FTEs were included and were inferred from payments to outsourcers. The subset staffing ratios were drawn from the Best-in-Class and Peer Plans respectively, and each subset reflects the same reweighting of Plan values, using the same process as costs as described in the previous paragraph.
Our approach may enable health plans to identify areas where their performance can emulate those of Best-in-Class. Notwithstanding our referring to low-cost Plans as Best-in-Class, we recognize that a health plan's long-term objective is cost levels that are optimal for its corporate objectives. The implication of this notion of performance is that high-cost functions would demonstrate the value of their higher costs through other objective metrics of superior performance. Put a different way, the differences between a Plan's costs and those of its Best-in-Class peers, if intended to achieve the Plan's corporate goals, represents a form of investment upon which an ROI should be expected.