The Analysis
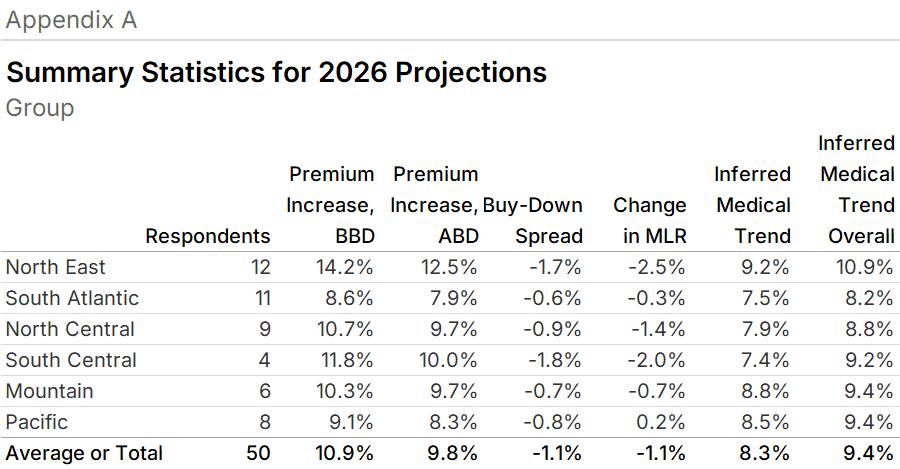
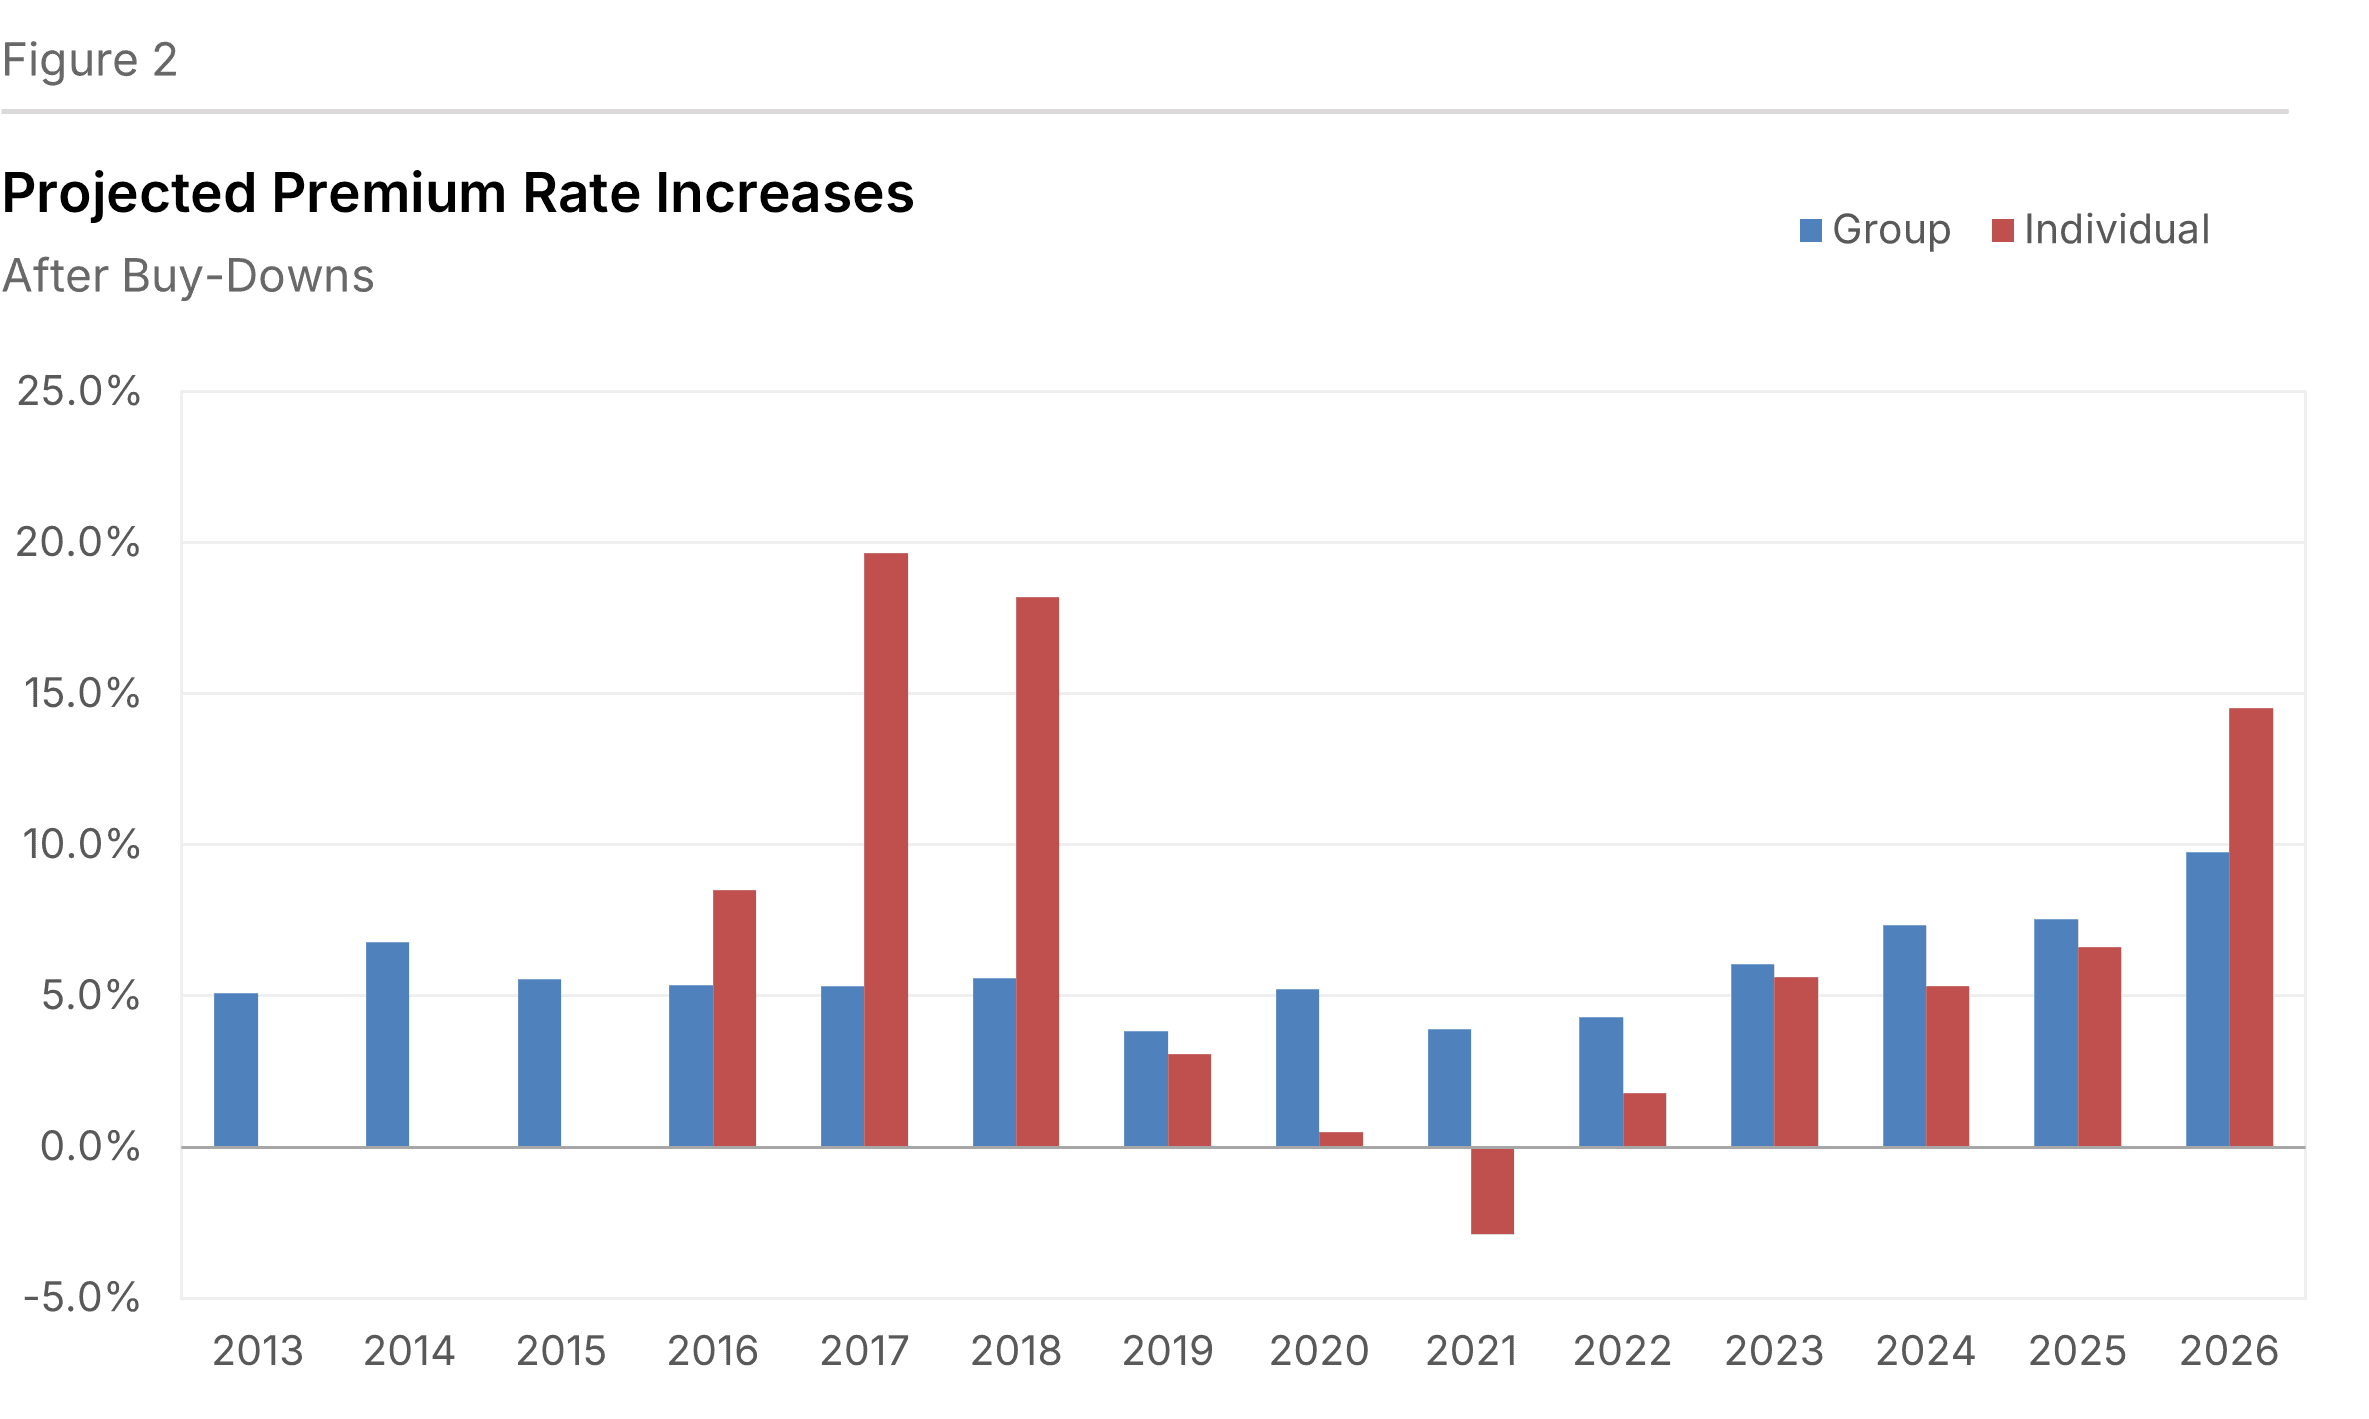
Health plans are expecting 2026 premiums to increase by 10.9% for Group fully-insured plans and by 16.8% for Individual plans (see Figure 1). For Individual plans, growth expectations are higher from 2025 by 9.0 percentage points. (Individual members include all who purchase insurance individually who are not eligible for Medicare or Medicaid, including ACA members.) For Group plans, this growth is 2.2 percentage points higher than their expectations for 2025. Both of these trends are before the effect of buy-downs.
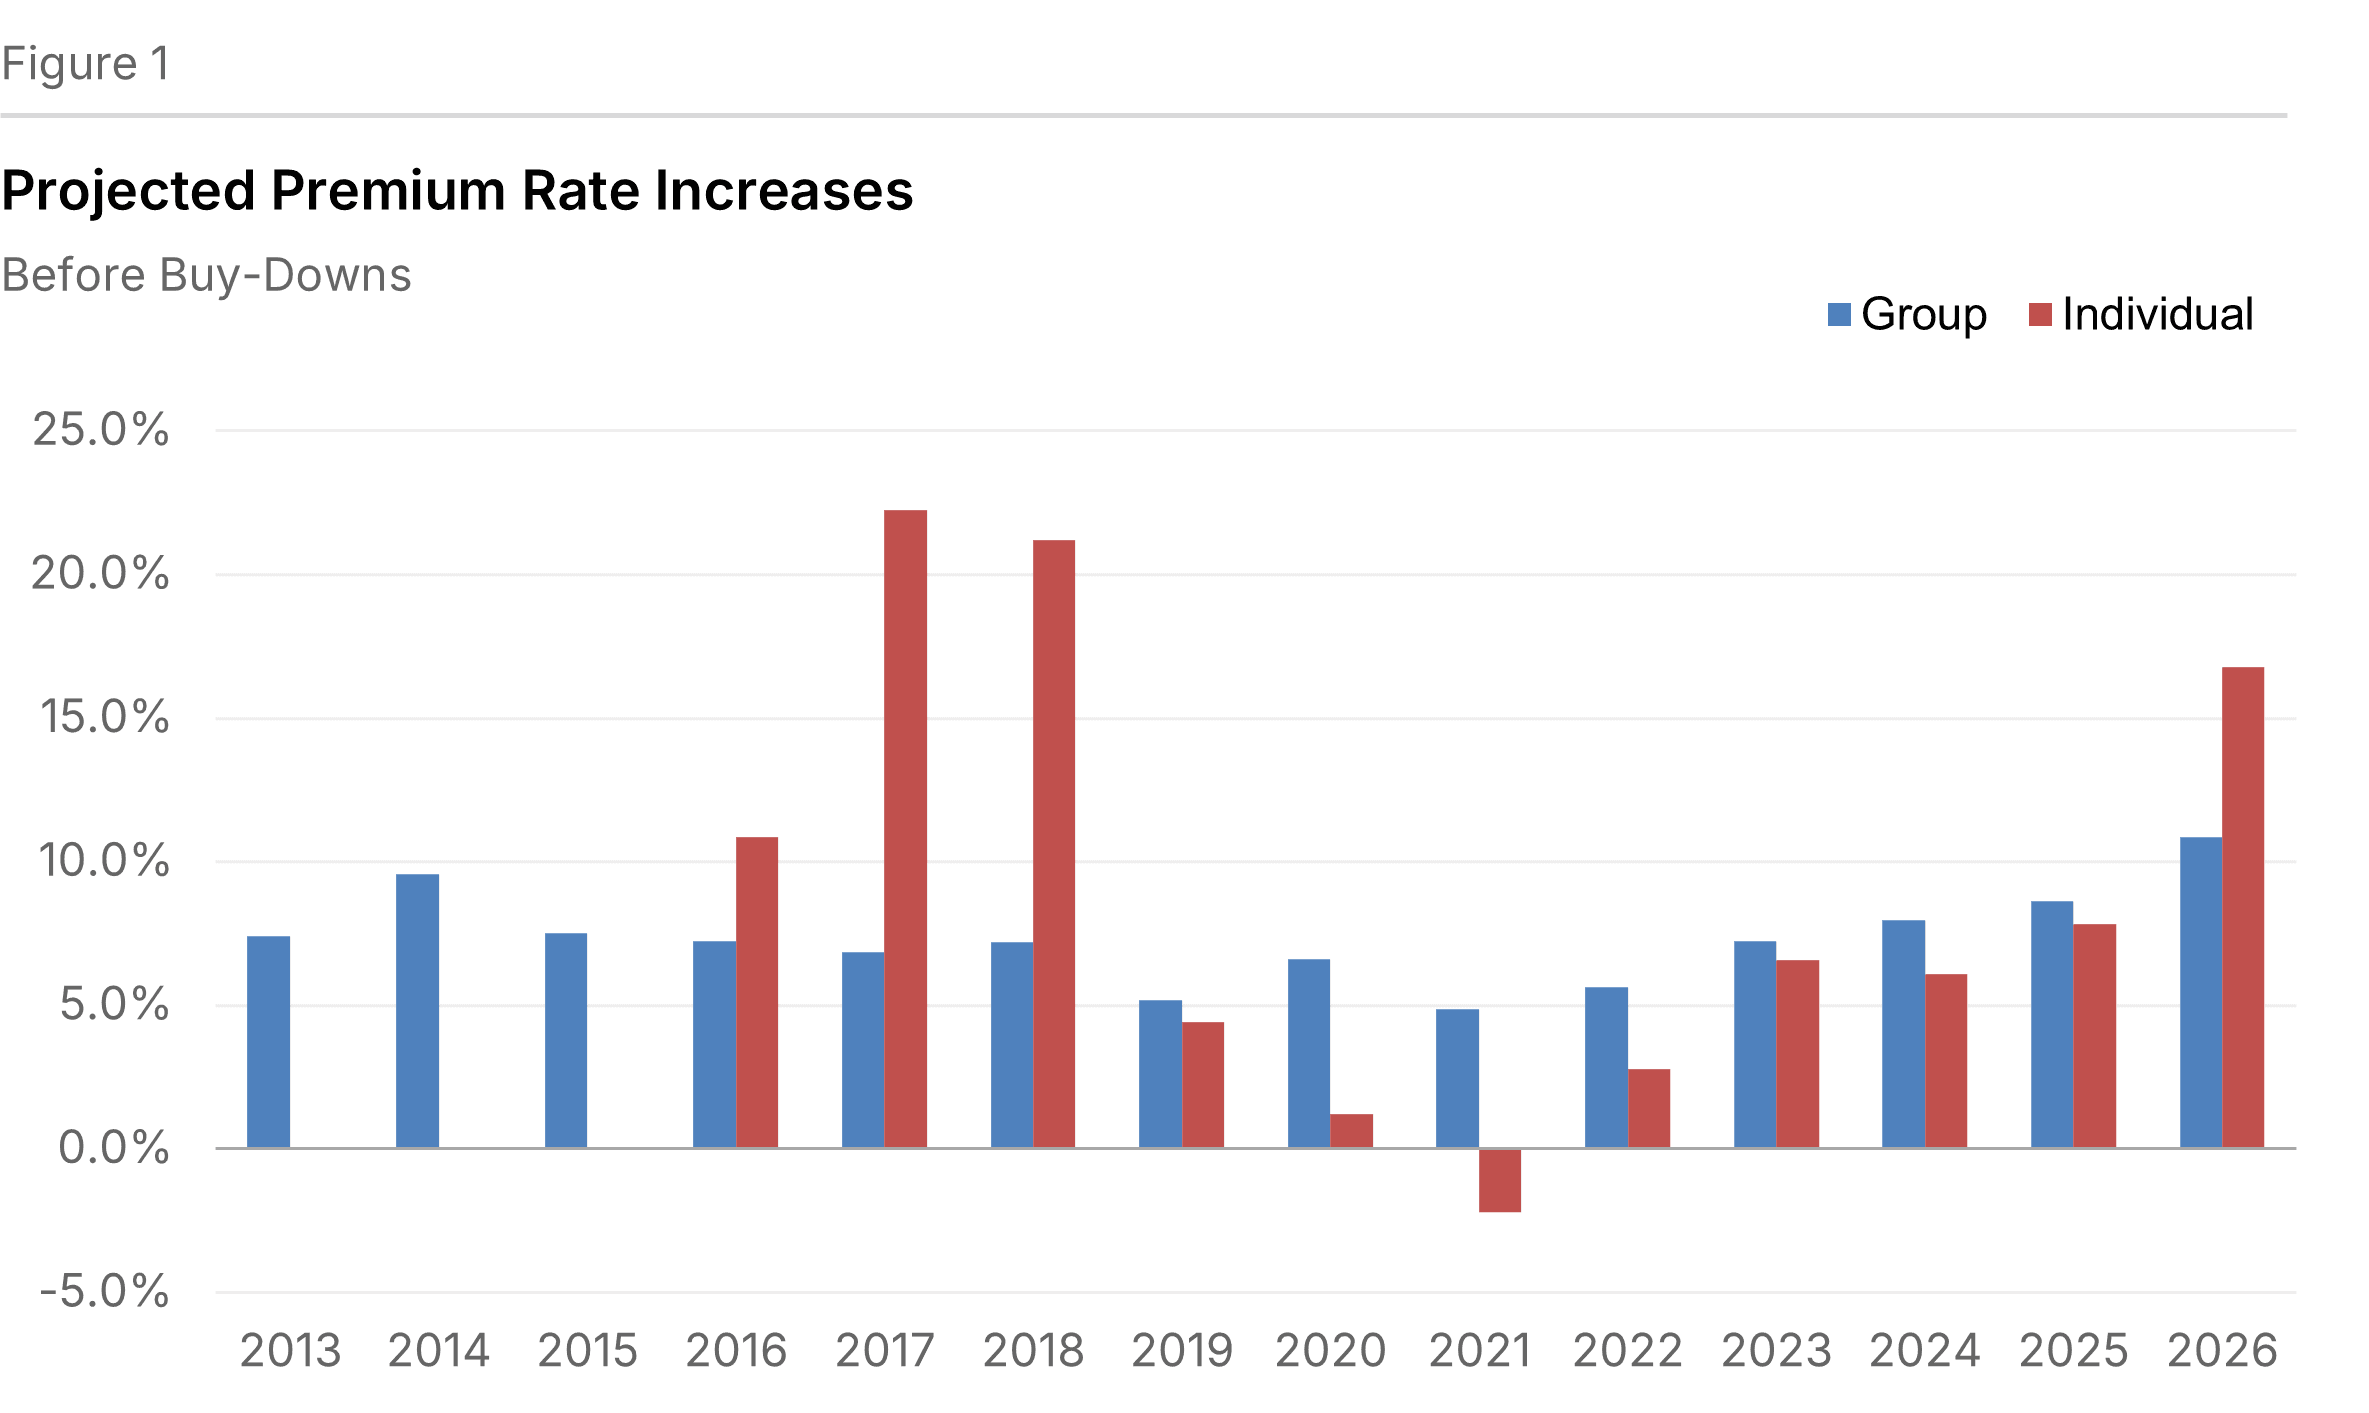
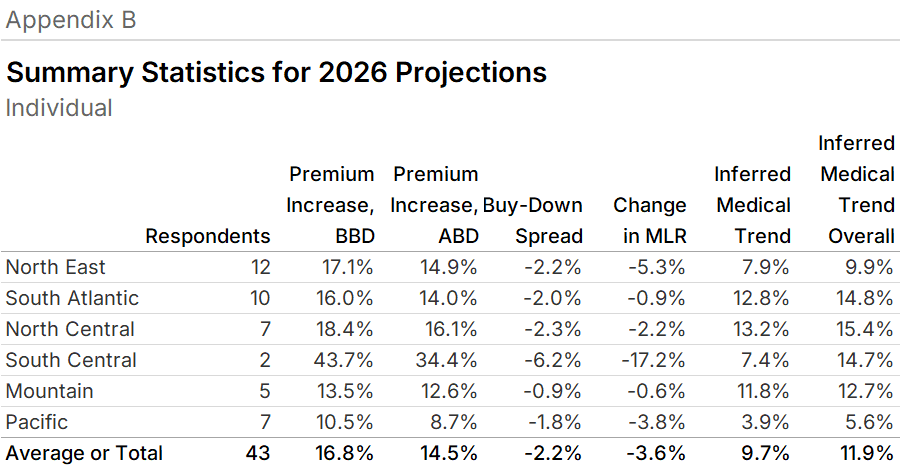
After the effect of buy-downs, plans anticipate premium increases for Group plans of 9.8% and 14.5% for Individual plans (see Figure 2). A buy-down is a change in a product's benefit design to secure a lower premium. Often, buy-downs reflect the increase in the amount of health benefits that beneficiaries are expected to share in the overall cost. We refer to the percentage point differences between the rate increase before and after the effects of buy-downs as the "buy-down spread", which are summarized by region in the appendices.
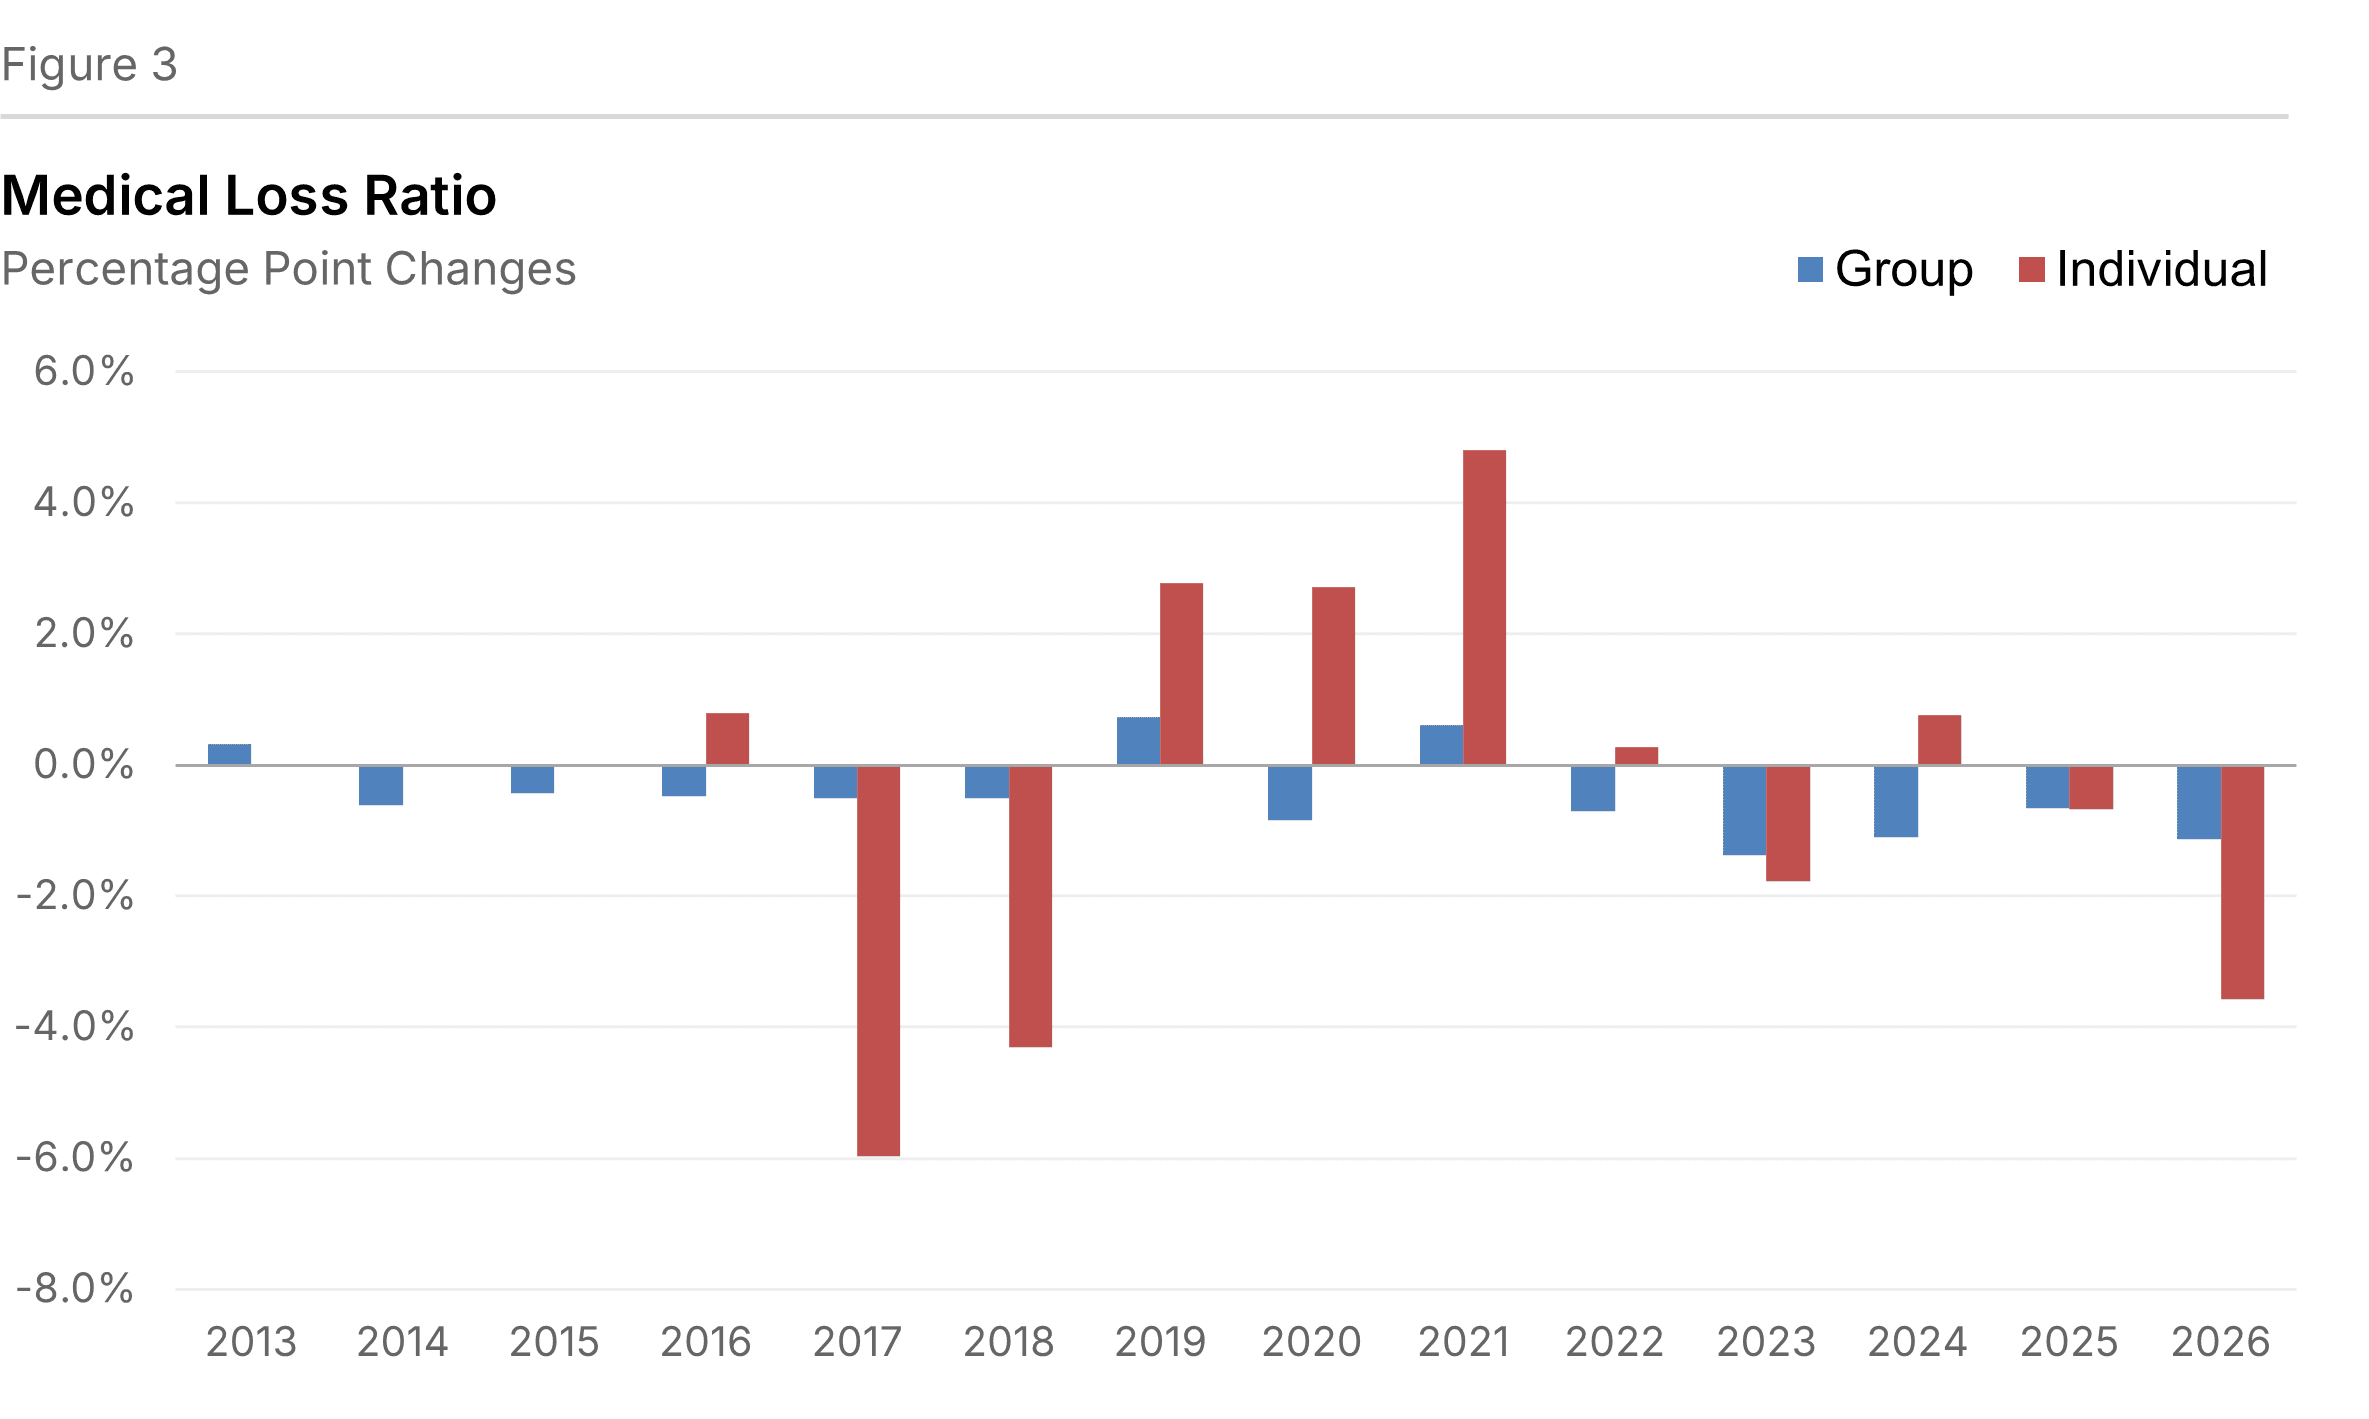
For plans participating in this survey, the expected decrease in medical loss ratio (MLR) is projected to be 1.1 percentage points for Group plans and by 3.6 percentage points for Individual plans (see Figure 3). The medical loss ratio is calculated as health benefits divided by premiums after buy-downs. This value is reported to us by the respondents.
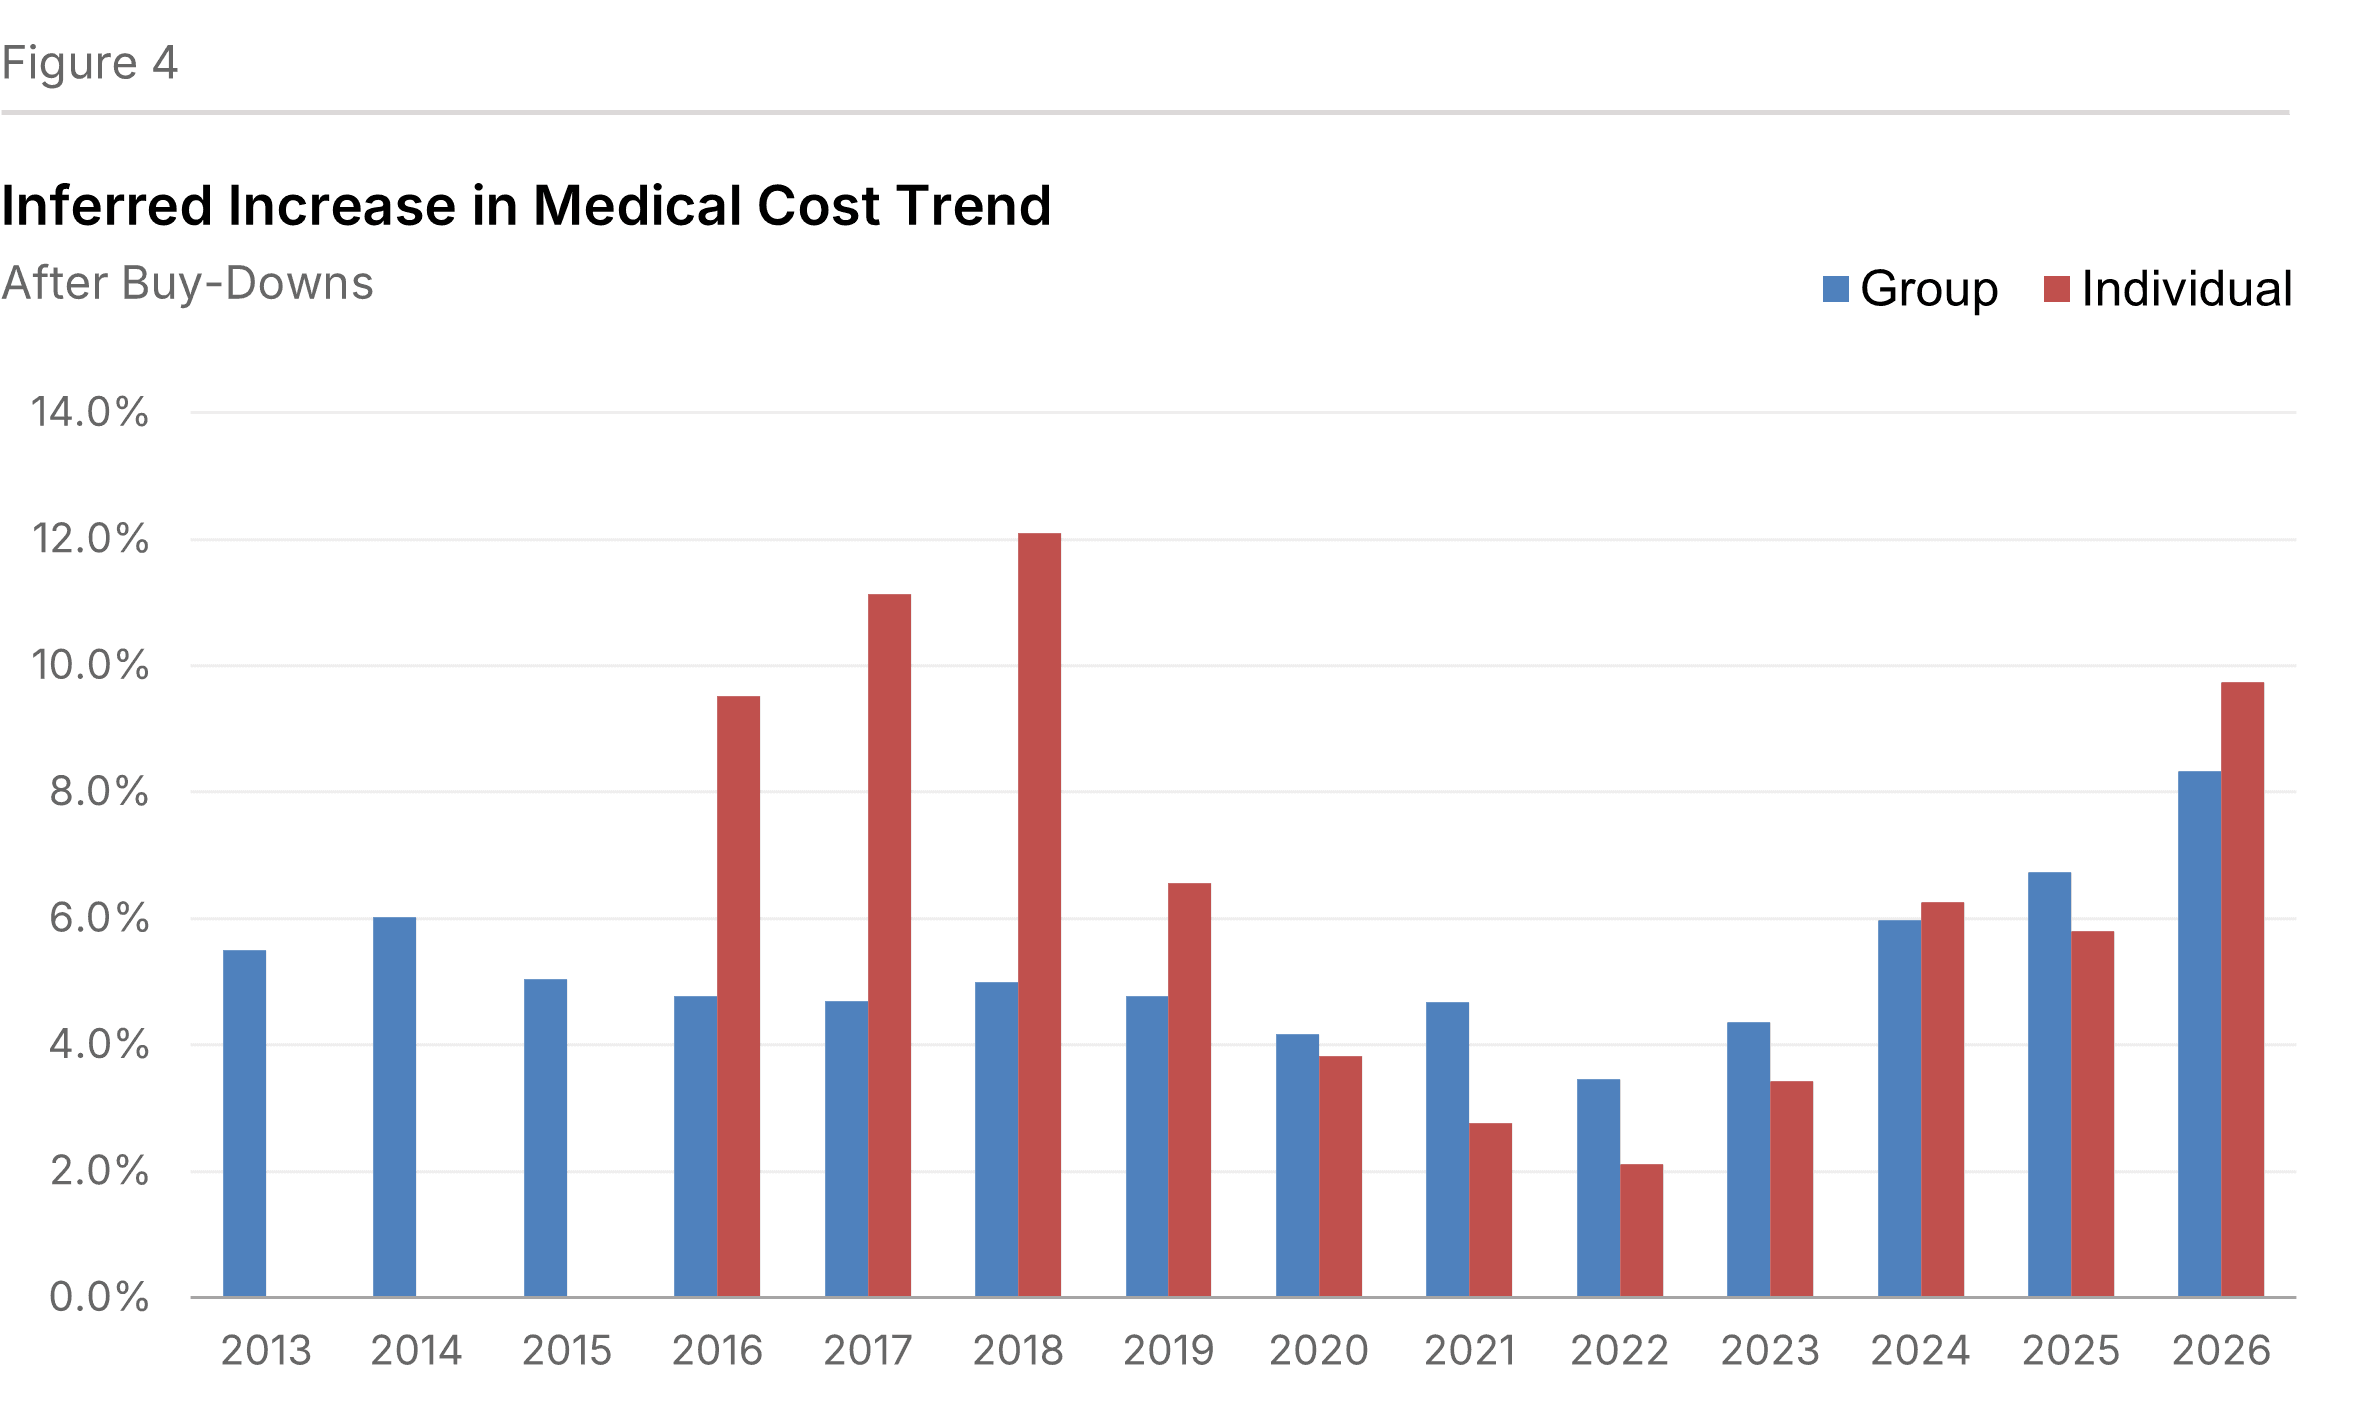
We infer from the change in the MLR that projected medical cost increases (after buy-downs) will be 8.3% for Group plans and 9.7% for Individual plans (see Figure 4). In other words, this is medical trend borne by the insurers. This trend is estimated based upon the medical loss ratio and the premium rate increase, after buy-downs.
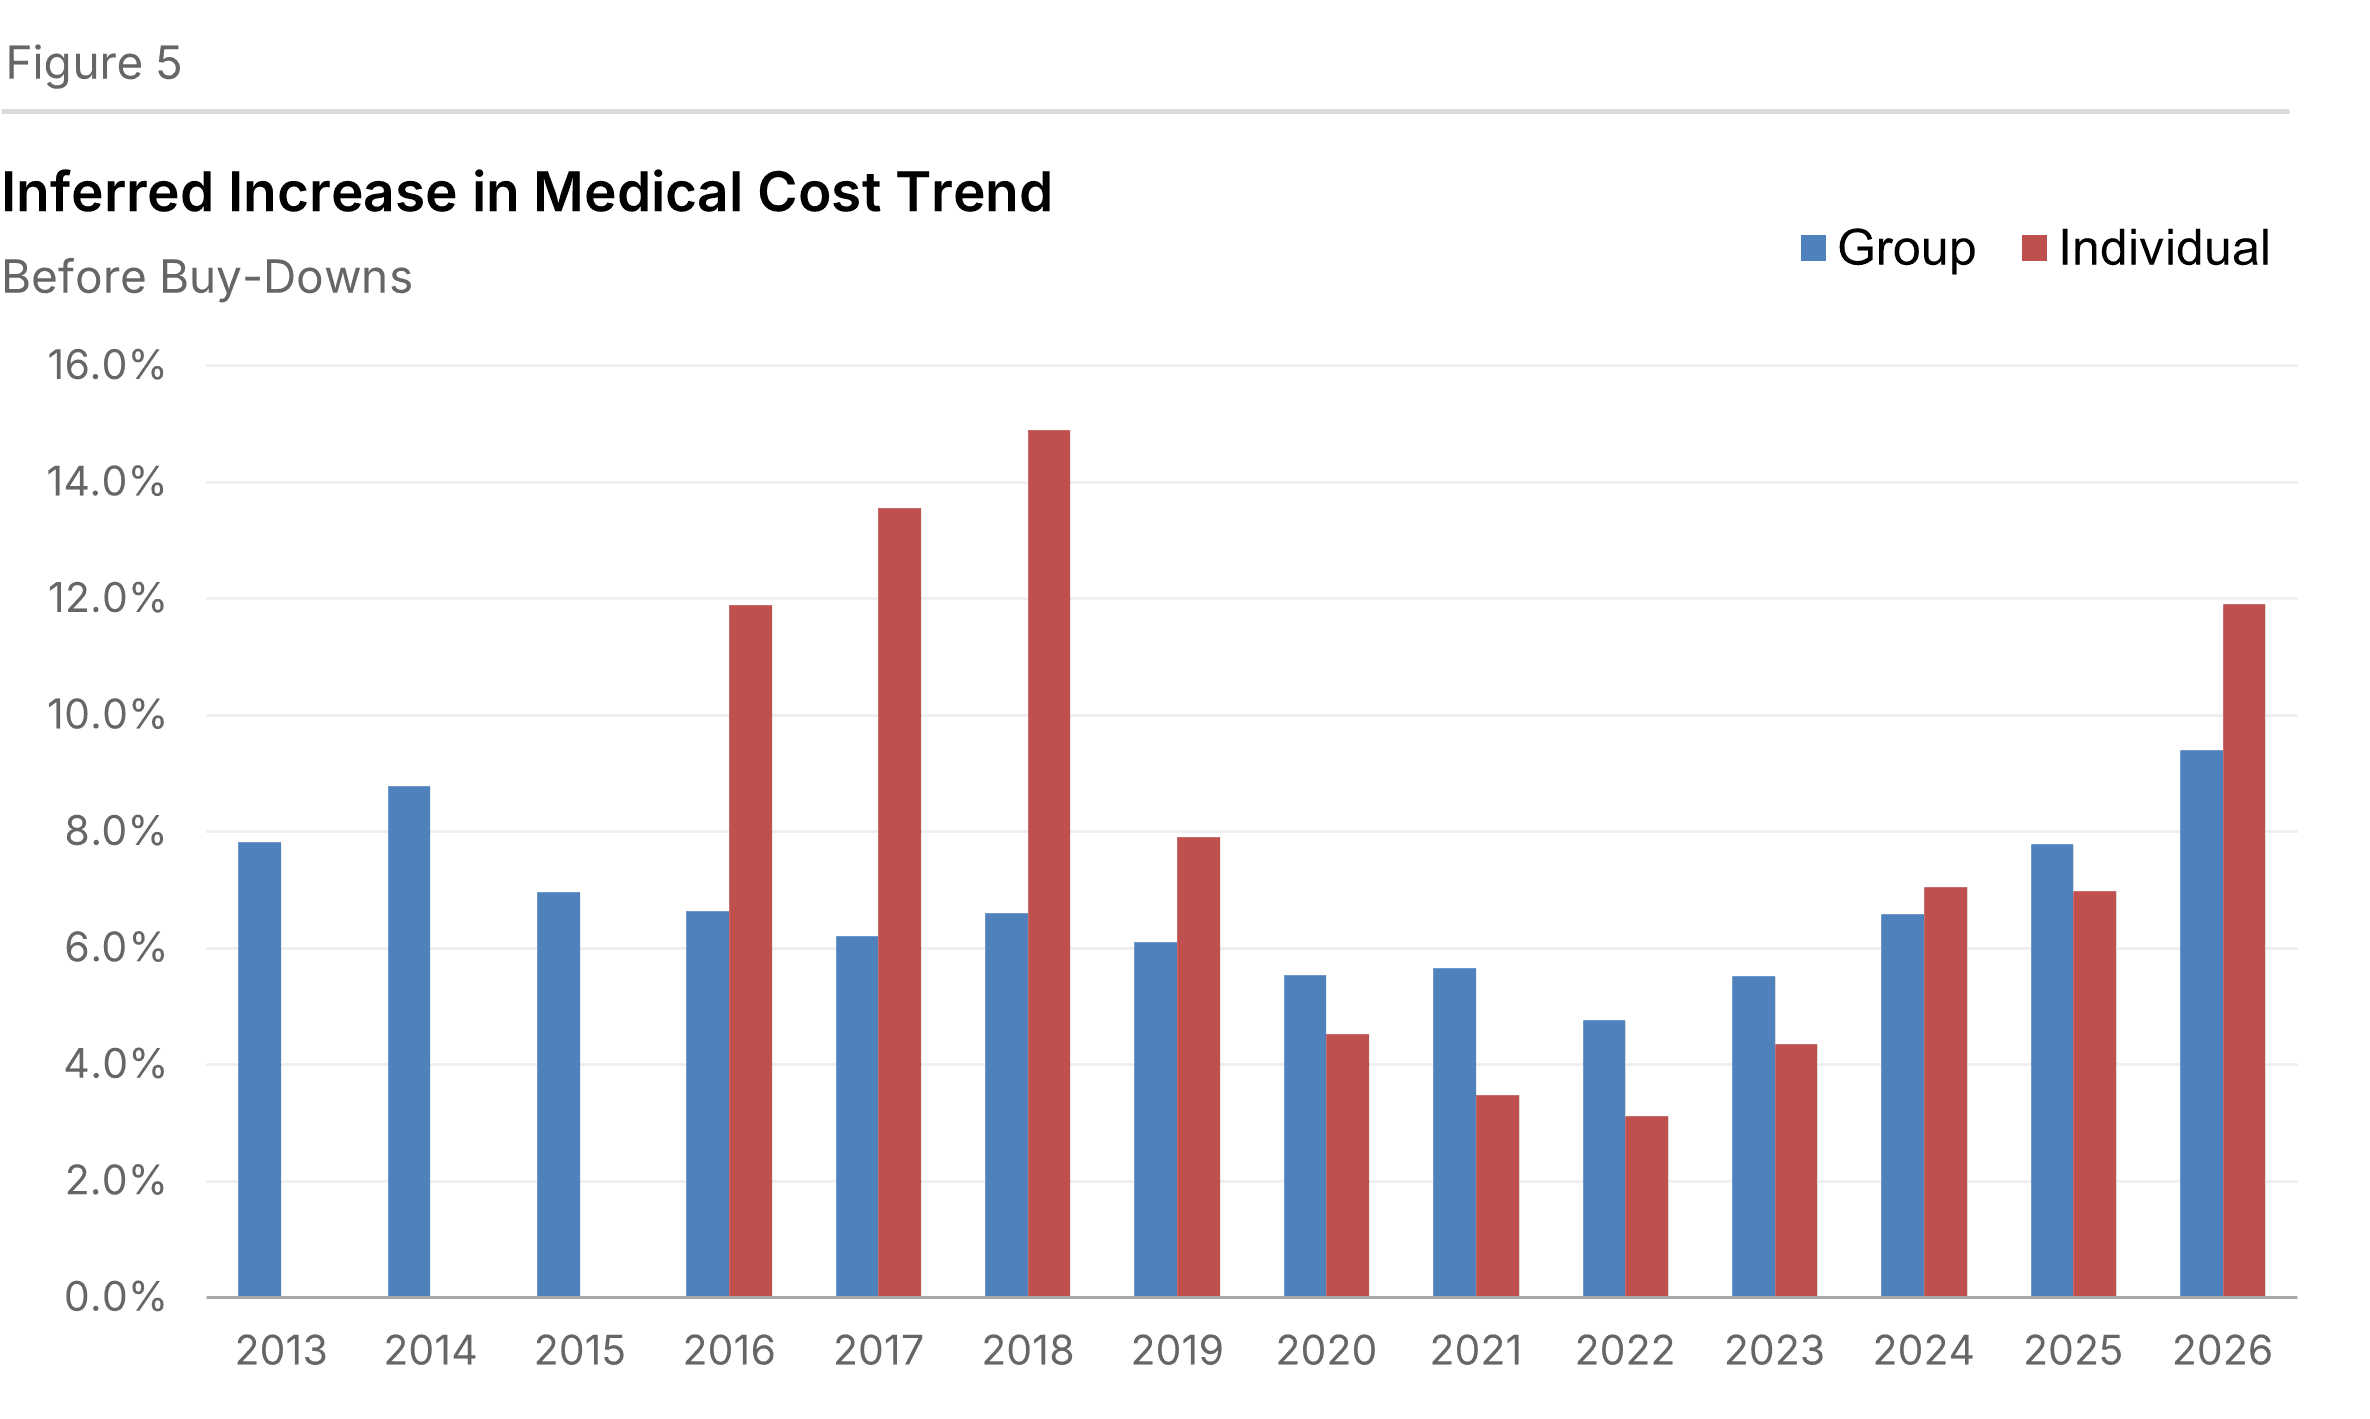
From the increase in premium before buy-downs and the change in the MLR, we can infer medical trend irrespective of whether it is borne by the insurers or by members. We estimate that projected medical cost increases (before buy-downs) will be 9.4% for Group plans and 11.9% for Individual plans (see Figure 5).
Background and Survey Design
The Thirty-First Annual Health Plan Pricing Survey summarizes health plan price and cost trends for individual and employer-sponsored health benefit plans. Our initial survey was in 1995 for expected premium rate increases for 1996.
Our survey originally sought increases solely for the commercial insured group market. Beginning in the 2015 survey, we sought information for the individual market similar to what we had gathered for the group market. The Affordable Care Act made this market segment more prominent. In addition to the results of the individual market itself, the comparisons between the group and individual segments can also be informative.
We distributed the survey this fall. It was succinct to increase the response rate. A two-page cover sheet included definitions to eliminate ambiguity. Responses were returned to us via email. Trends of these metrics are calculated for each region and overall.
We received responses from 25 organizations. Many of these operated in multiple geographic markets. Respondents offered 50 responses for the Group market segment and 43 for the Individual market segment. Collectively, we estimate that the plans serve 58 million people with comprehensive insurance in a variety of market segments and payment mechanisms.
The geographic regions are defined as follows:
- North East — Connecticut, Massachusetts, Maine, New Hampshire, Rhode Island, Vermont, New Jersey, New York, and Pennsylvania
- South Atlantic — Delaware, Washington DC, Florida, Georgia, Maryland, North Carolina, South Carolina, Virginia, and West Virginia
- North Central — Illinois, Indiana, Michigan, Ohio, Wisconsin, Iowa, Kansas, Minnesota, Missouri, Nebraska, North Dakota and South Dakota
- South Central — Alabama, Kentucky, Mississippi, Tennessee, Arkansas, Louisiana, Oklahoma and Texas
- Mountain — Arizona, Colorado, Idaho, Montana, Nevada, New Mexico, Utah, and Wyoming
- Pacific — Alaska, California, Hawaii, Oregon and Washington
Appendices